HNI Corp HNI
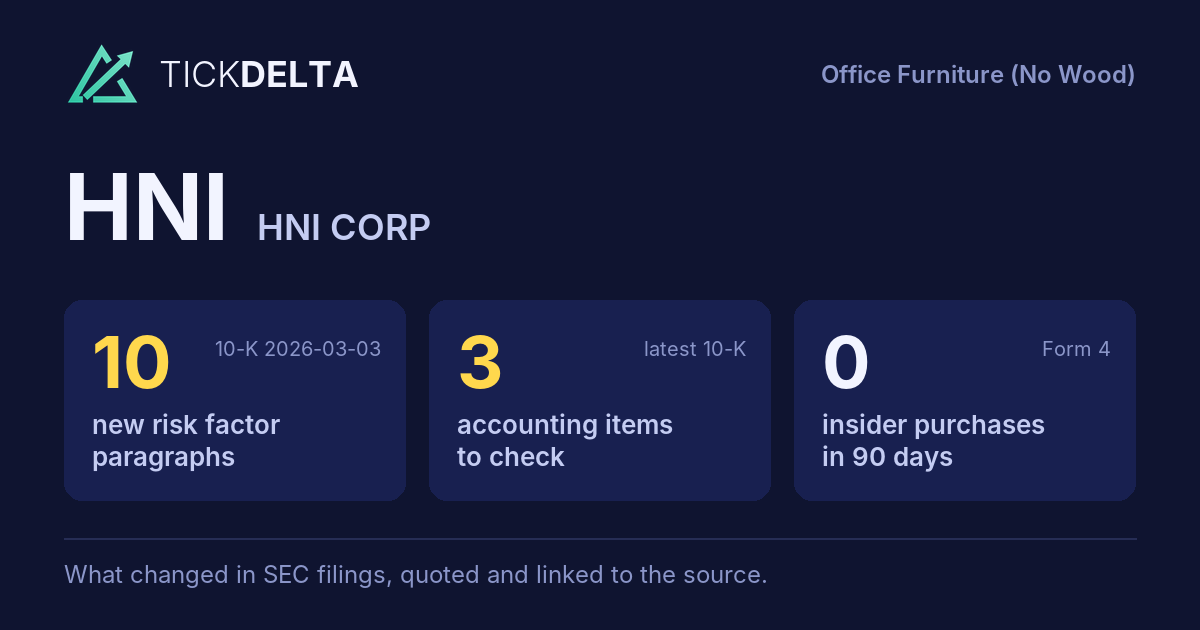
The biggest changes in the 10-K filed Mar 3, 2026, in management's words
10-K, Item 7This fiscal year against the last, and the sentences in the MD&A where management explains each change. Tickdelta picks sentences that name the line, a direction and a cause. It does not write explanations of its own.
Net income
Big change, FY to Jan 3, 2026 vs Dec 28, 2024
“Excluding these items, net income increased in the current year driven by higher net sales volume in the legacy HNI businesses and improved net productivity, partially offset by higher core Selling and administrative expenses ("SG&A").”
Read it in the 10-K
Operating margin
Big change, FY to Jan 3, 2026 vs Dec 28, 2024
“Excluding these items, operating margin was flat year-over-year with higher net sales volume in the legacy HNI businesses and improved net productivity, offset by impacts from the acquisition of Steelcase and higher core SG&A.”
Read it in the 10-K
Cash from operations
Big change, FY to Jan 3, 2026 vs Dec 28, 2024
The MD&A has no sentence that names a cause for this change.
Revenue
Big change, FY to Jan 3, 2026 vs Dec 28, 2024
“Excluding the impact of this transaction, segment net sales were up 4.7 percent driven by improved volume and price across most channels, with the exception of Hospitality which saw decreases in both volume and price.”
Read it in the 10-K
Gross margin
Change, FY to Jan 3, 2026 vs Dec 28, 2024
The MD&A has no sentence that names a cause for this change.
What management said, year by year
The cause given in each 10-K, 2 fiscal years, newest first · MD&A (Item 7)
Each bar is how the line changed that year (from the same 10-K's XBRL). Under it, the sentence in that year's MD&A that names the line, a direction and a cause, word for word. A year with no sentence says so.
Revenue
2 of 2 years explained-
FY 2026 +12.4%
“Excluding the impact of this transaction, segment net sales were up 4.7 percent driven by improved volume and price across most channels, with the exception of Hospitality which saw decreases in both volume and price.”
Read it in the FY 2026 10-K -
FY 2024 +3.8%
“Excluding the impact of these transactions, segment sales were down 4.0 percent driven by lower demand across most customer channels, partially offset by improved volume in the hospitality sector and price realization.”
Read it in the FY 2024 10-K
Gross margin
1 of 2 years explained-
FY 2026 +0.5 pts
The FY 2026 MD&A has no sentence that names a cause for this change.
-
FY 2024 +1.9 pts
“Gross profit as a percentage of net sales increased 190 basis points in 2024 compared to 2023, driven by improved net productivity and favorable price-cost, partially offset by lower volume in the legacy HNI businesses.”
Read it in the FY 2024 10-K
Operating margin
2 of 2 years explained-
FY 2026 -3.7 pts
“Excluding these items, operating margin was flat year-over-year with higher net sales volume in the legacy HNI businesses and improved net productivity, offset by impacts from the acquisition of Steelcase and higher core SG&A.”
Read it in the FY 2026 10-K -
FY 2024 +4.5 pts
“These actions drove strong growth in workplace furnishings operating margin for the year, despite demand variability driven by macroeconomic conditions and U.S. election ambiguity that particularly impacted the latter portion of the year.”
Read it in the FY 2024 10-K“Excluding these items, operating income as a percentage of sales increased driven by improved net productivity, the benefit of a full year of Kimball International ownership in 2024, and favorable price-cost, partially offset by lower sales volume in the legacy HNI businesses.”
Read it in the FY 2024 10-K
Net income
2 of 2 years explained-
FY 2026 -61.1%
“Excluding these items, net income increased in the current year driven by higher net sales volume in the legacy HNI businesses and improved net productivity, partially offset by higher core Selling and administrative expenses ("SG&A").”
Read it in the FY 2026 10-K -
FY 2024 +183.5%
“Excluding these items, net income increased in the current year driven by improved net productivity, favorable price-cost, and the full year benefit of the Kimball International acquisition, partially offset by lower sales volume in the legacy HNI businesses.”
Read it in the FY 2024 10-K“Additionally, non-cash items adjusted from net income to reconcile to operating cash flows were lower in 2024 primarily as a result of the absence of asset impairment charges and an increase in non-cash deferred tax benefits.”
Read it in the FY 2024 10-K
Cash from operations
0 of 2 years explained-
FY 2026 +21.9%
The FY 2026 MD&A has no sentence that names a cause for this change.
-
FY 2024 -15.3%
The FY 2024 MD&A has no sentence that names a cause for this change.
Changes are computed from the XBRL figures in the same 10-K. Hover a number to see the line item. Open the 10-K
Sources
The Management's Discussion and Analysis (Item 7) of the latest 10-K, quoted word for word; the changes are computed from the same 10-K's XBRL.
Also
Financials: the numbers year by year.
Work with it
Excel workbook · CSV. Google Sheet that stays up to date: paste =IMPORTDATA("https://tickdelta.com/company/HNI/export.csv") into a cell.