H2O America HTO
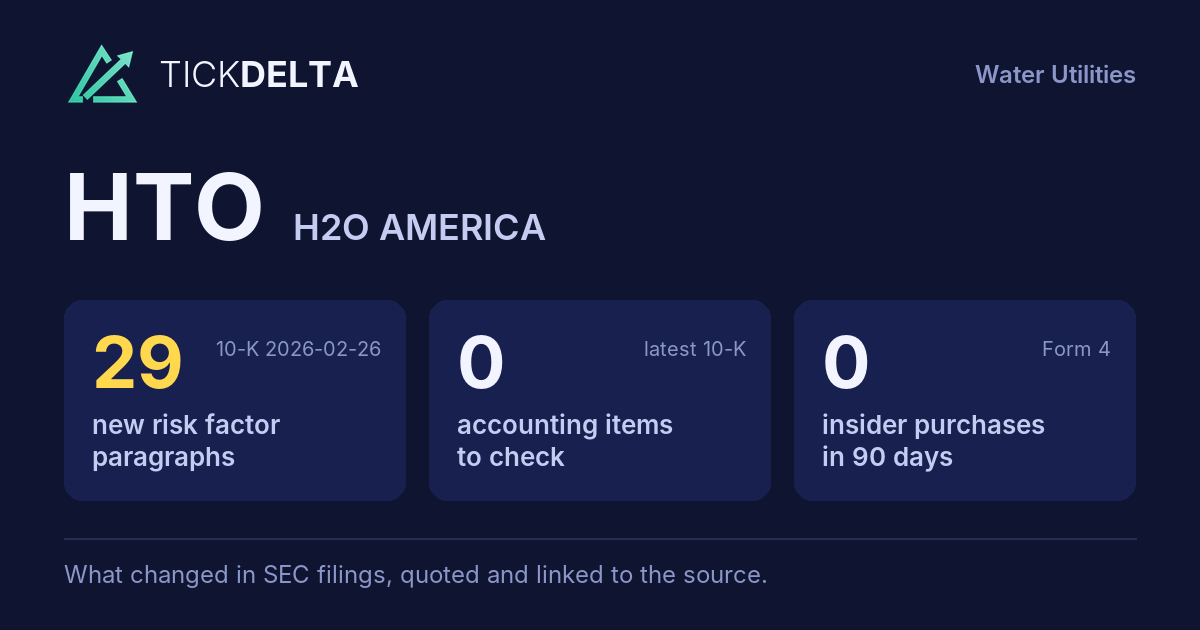
The biggest changes in the 10-K filed Feb 26, 2026, in management's words
10-K, Item 7This fiscal year against the last, and the sentences in the MD&A where management explains each change. Tickdelta picks sentences that name the line, a direction and a cause. It does not write explanations of its own.
Cash from operations
Big change, FY to Dec 31, 2025 vs Dec 31, 2024
“In 2025, the increase in cash flows from operations was primarily attributable to higher net income, changes in working capital balances, changes in regulatory assets and liabilities, proceeds from the PFAS litigation settlement, and the absence of the prior year’s up-front service concession fee payments related to Cupertino.”
Read it in the 10-K
Operating margin
Big change, FY to Dec 31, 2025 vs Dec 31, 2024
“Administrative and general expense increased $20,168 in 2025, or 3% of total operating expenses from 2024, The increase was primarily attributable to funds received from the California Extended Water and Wastewater Arrearage Payment Program in the prior year, higher employee expenses, insurance and consulting work.”
Read it in the 10-K
Revenue
Change, FY to Dec 31, 2025 vs Dec 31, 2024
“The revenue increase consists of $54,519 for Water Utility Services which is primarily due to a $44,134 increase in authorized rates in California, Connecticut and Texas, an increase in rates of $23,281 attributable to water supply costs that are passed through to customers, an increase of $1,452 from new customers, and increases in services and other revenue of $859, partially offset by decreases of $7,987 in other regulatory mechanisms, and a decrease of $7,220 due to lower usage.”
Read it in the 10-K
“The revenue decrease of $2,368 from Other Services is primarily attributable to lower real estate activity.”
Read it in the 10-K
Net income
Change, FY to Dec 31, 2025 vs Dec 31, 2024
“The increase in net income was primarily driven by higher revenue associated with rate increases in California and Connecticut partially offset by higher administrative and general expenses, higher water production expenses, lower customer usage, and higher depreciation and amortization expense primarily related to new utility plant additions.”
Read it in the 10-K
What management said, year by year
The cause given in each 10-K, 2 fiscal years, newest first · MD&A (Item 7)
Each bar is how the line changed that year (from the same 10-K's XBRL). Under it, the sentence in that year's MD&A that names the line, a direction and a cause, word for word. A year with no sentence says so.
Revenue
2 of 2 years explained-
FY 2025 +9.4%
“The revenue increase consists of $54,519 for Water Utility Services which is primarily due to a $44,134 increase in authorized rates in California, Connecticut and Texas, an increase in rates of $23,281 attributable to water supply costs that are passed through to customers, an increase of $1,452 from new customers, and increases in services and other revenue of $859, partially offset by decreases of $7,987 in other regulatory mechanisms, and a decrease of $7,220 due to lower usage.”
Read it in the FY 2025 10-K“The revenue decrease of $2,368 from Other Services is primarily attributable to lower real estate activity.”
Read it in the FY 2025 10-K -
FY 2024 +8.6%
“The revenue increase consists of $80,535 from Water Utility Services offset by a decrease of $2,459 from Other Services.”
Read it in the FY 2024 10-K“The revenue increase for Water Utility Services is primarily due to an increase in authorized rates in California and Connecticut, which resulted in an additional $36,076 in revenue, an increase in rates of $26,057 attributable to water supply costs that are passed through to customers, an increase of $14,861 due to higher usage, an increase of $2,532 from new customers, and increases in services and other revenue of $7,642, partially offset by decreases of $6,633 in other regulatory mechanisms and a decrease of $2,459 in Other Services.”
Read it in the FY 2024 10-K
Operating margin
2 of 2 years explained-
FY 2025 -1.1 pts
“Administrative and general expense increased $20,168 in 2025, or 3% of total operating expenses from 2024, The increase was primarily attributable to funds received from the California Extended Water and Wastewater Arrearage Payment Program in the prior year, higher employee expenses, insurance and consulting work.”
Read it in the FY 2025 10-K -
FY 2024 +1.1 pts
“Administrative and general expense increased $7,174 in 2024, or 2% of total operating expenses from 2023, primarily due to expenses associated with certain acquisition evaluation and due diligence activities of $3,393, and an increase for pension expense, contracted work, and inflationary increases, offset by decreases in the allowance for credit losses of $6,082 and higher allocations to construction activities.”
Read it in the FY 2024 10-K“Maintenance expenses increased $5,572 in 2024 or 1% of total operating expenses from 2023, primarily due to higher maintenance expenses related to contracted work for others, security expenses, and adjustments to certain regulatory assets as a result of the final decision in the Connecticut general rate case.”
Read it in the FY 2024 10-K
Net income
2 of 2 years explained-
FY 2025 +9.2%
“The increase in net income was primarily driven by higher revenue associated with rate increases in California and Connecticut partially offset by higher administrative and general expenses, higher water production expenses, lower customer usage, and higher depreciation and amortization expense primarily related to new utility plant additions.”
Read it in the FY 2025 10-K -
FY 2024 +10.6%
“The increase in net income was primarily driven by rate increases in California and Connecticut, higher customer usage, decreases in the allowance for credit losses, lower income tax expense attributable to a tax accounting method change, partially offset by higher water production expenses, higher administrative and general expenses, and higher depreciation and amortization expense primarily related to new utility plant additions.”
Read it in the FY 2024 10-K
Cash from operations
1 of 2 years explained-
FY 2025 +25.2%
“In 2025, the increase in cash flows from operations was primarily attributable to higher net income, changes in working capital balances, changes in regulatory assets and liabilities, proceeds from the PFAS litigation settlement, and the absence of the prior year’s up-front service concession fee payments related to Cupertino.”
Read it in the FY 2025 10-K -
FY 2024 +2.5%
The FY 2024 MD&A has no sentence that names a cause for this change.
Changes are computed from the XBRL figures in the same 10-K. Hover a number to see the line item. Open the 10-K
Sources
The Management's Discussion and Analysis (Item 7) of the latest 10-K, quoted word for word; the changes are computed from the same 10-K's XBRL.
Also
Financials: the numbers year by year.
Work with it
Excel workbook · CSV. Google Sheet that stays up to date: paste =IMPORTDATA("https://tickdelta.com/company/HTO/export.csv") into a cell.