IFFInternational Flavors & Fragrances
- Employees
- 21,500
- Headquarters
- New York, NY
- CEO
- J. Erik Fyrwald
- Next results
- around Feb 10, 2027
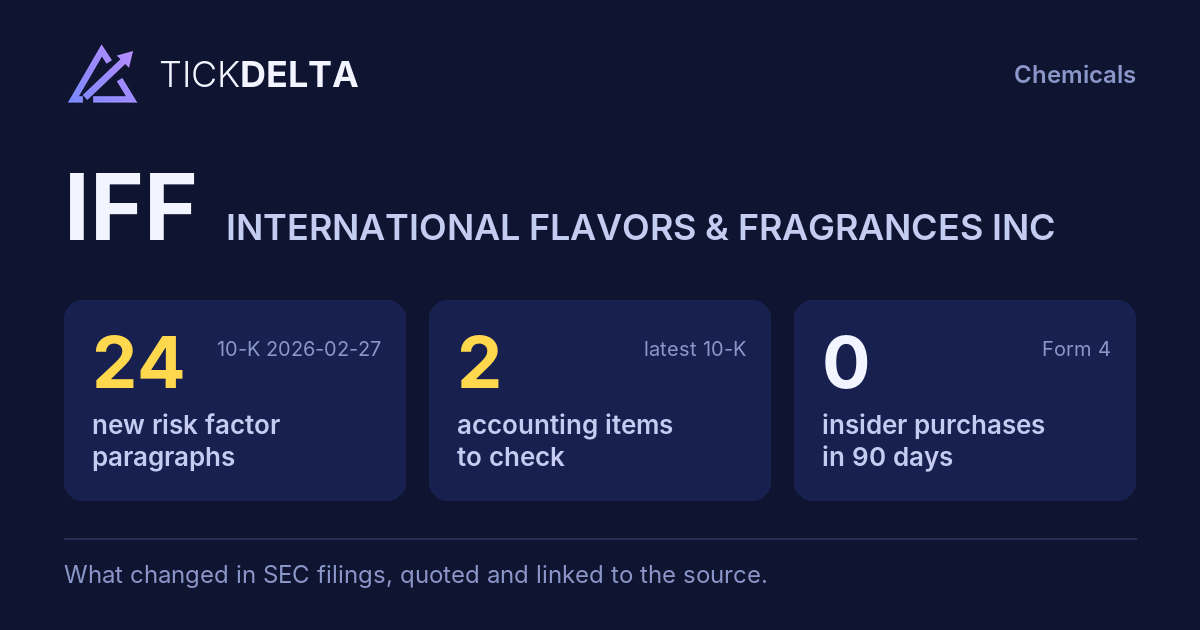
The biggest changes in the 10-K filed 2026-02-27, this fiscal year against the last, and the sentences in the MD&A (Item 7) where management explains them, quoted word for word. Tickdelta picks sentences that name the line, a direction and a cause. It does not write explanations of its own.
Net income
-237.3% Big change FY to 2025-12-31 vs 2024-12-31The MD&A has no sentence that names a cause for this change. That can be worth a question: ask about the filing.
Operating margin
6.7% → -3.5% (-10.2 pts) Big change FY to 2025-12-31 vs 2024-12-31The MD&A has no sentence that names a cause for this change. That can be worth a question: ask about the filing.
Cash from operations
-20.6% Big change FY to 2025-12-31 vs 2024-12-31“The decrease in cash flows from operating activities from 2024 to 2025 was primarily driven by an increase in working capital and a larger incentive compensation payout made in 2025 related to 2024 results, offset in part by an increase in accounts receivables in the prior year.”
Read it in the 10-K ↗
Revenue
-5.2% FY to 2025-12-31 vs 2024-12-31“On a comparable currency neutral basis, Taste sales increased 4% in 2025 compared to the 2024 period, driven by volume increases across all business entities.”
Read it in the 10-K ↗
“On a comparable currency neutral basis, Food Ingredients sales decreased 3% in 2025 compared to the 2024 period, driven by volumes decreases in Protein Solutions offset by volume growth in Inclusions as well the proactive exit of low margin business over the course of 2025.”
Read it in the 10-K ↗
Gross margin
35.9% → 36.2% (+0.3 pts) FY to 2025-12-31 vs 2024-12-31“The decrease in gross profit was primarily driven by the impact of divestitures of $264 million and the effect of exchange rate variations, offset in part by volume increases and productivity gains.”
Read it in the 10-K ↗
“The decrease in cost of sales was primarily driven by the divestitures the impact of which was approximately $493 million, lower raw material costs and lower unfavorable manufacturing absorption compared to the prior year period, increased productivity compared to the prior year period, offset in part by volume increases.”
Read it in the 10-K ↗
Changes are computed from the XBRL figures in the same 10-K. Hover a number to see the line item. Open the 10-K ↗
Work on IFF in a spreadsheet:
Excel workbook (a sheet per section, ten years by column, charts, links to the filings) ·
CSV.
For a Google Sheet that stays up to date, paste =IMPORTDATA("https://tickdelta.com/company/IFF/export.csv") into a cell.