Ingredion Inc INGR
- Employees
- 11,200
- Headquarters
- Westchester, IL
- Next results
- around Feb 2, 2027
Where each dollar of revenue went, FY2025
Revenue of $7.2B through the costs to a net profit of $729.0M · income statement of the 10-K
INGR among Consumer staples peers
Six ratios from the latest 10-K. Each corner is the share of 63 peers the company is above, not a score.
What changed
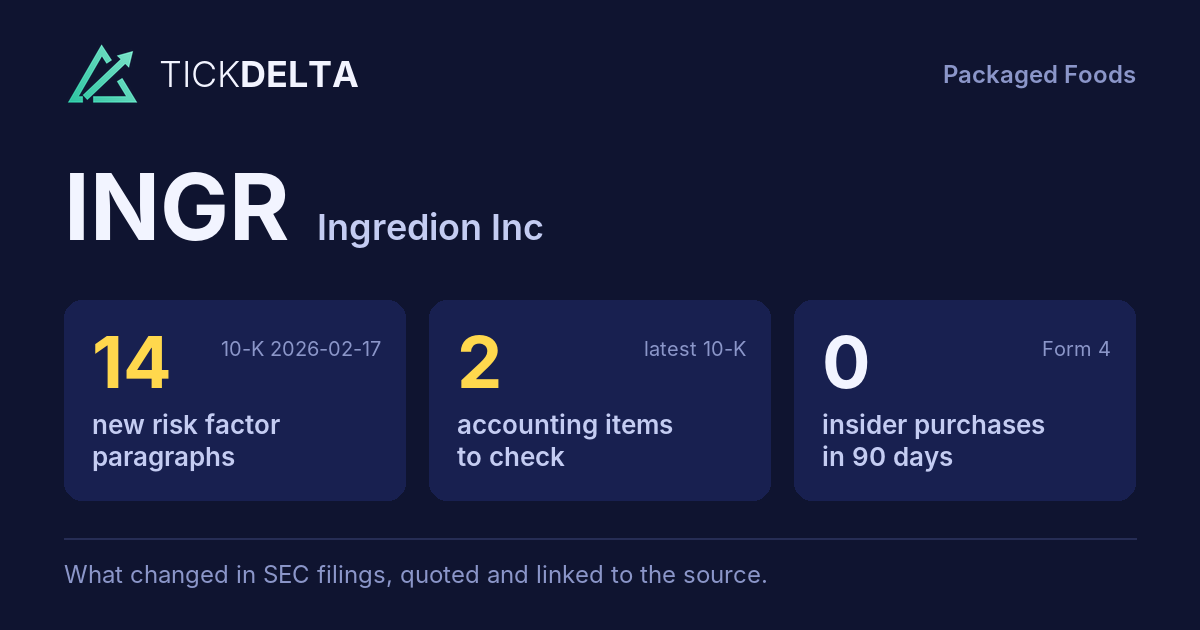
14 new risk paragraphs and 2 accounting facts worth reading about. 10-K filed Feb 17, 2026 against Feb 20, 2025.
Each row opens the detail with the quote and the filing. A row is a change worth reading, not a verdict.
Accounting checks
11 checks on the latest 10-K. Checks, not verdicts.
2facts worth reading about the other 9 checks found nothing to note
-
Receivables growing faster than revenueReceivables +8.4% ($1.1B to $1.2B) vs revenue -2.8% ($7.4B to $7.2B), +11.3 pts apart
-
Material impairment (8-K item 2.06)8-K item 2.06 (material impairments) filed May 5, 2026 (2 in 2 years): “. In connection with the cessation of operations at the Cabo manufacturing facility, the Company expects to record approximately $36 million in pre-tax, non-cash impairment charges in the second quarter of 2026 relating to fixed asset and inventory write-downs. Forward-Looking Statements This current report on Form 8-K contains or may contain forward-looking statements within the meaning of…”
-
Cash from operations $944.0M vs net income $729.0M (FY ending Dec 31, 2025)
8 more checks with nothing to note
-
Inventory +3.4% ($1.2B to $1.2B) vs revenue -2.8% ($7.4B to $7.2B), +6.2 pts apart
-
Same auditor in both 10-Ks: KPMG LLP
-
No statement of substantial doubt about going concern
-
No 8-K item 4.02 in the last 2 years
-
No NT 10-K or NT 10-Q in the last 2 years
-
The same matters as last year: Sufficiency of audit evidence over inventory
-
No sentence in the 10-K concludes that controls were not effective because of a material weakness
-
No 8-K item 1.03 in the last 2 years
In their words
14 paragraphs in Risk Factors that were not in the 10-K filed Feb 20, 2025. Quoted as filed.
-
Item 1A · new paragraph · not in the 10-K filed Feb 20, 2025 10-K, ITEM 1A
The demand for food products that contain our ingredients, including agricultural products developed through biotechnology, may be adversely affected by changes in consumer practices, preferences, price sensitivities, tastes, and national, regional and local economic conditions. Consumer preferences and purchasing behaviors relating to…
-
Item 1A · new paragraph · not in the 10-K filed Feb 20, 2025 10-K, ITEM 1A
As a result, certain customers may reformulate products, reduce volumes, or discontinue products that incorporate certain of our ingredients, including sweeteners, starches, texturizers, and other specialty ingredients, or seek alternative ingredients from our competitors. Such changes could reduce demand for our products, increase…
-
Item 1A · new paragraph · not in the 10-K filed Feb 20, 2025 10-K, ITEM 1A
Our ability to expand our business may suffer if we do not keep pace with technological developments and continue to offer innovative products, including more sustainable production methods.
-
Item 1A · new paragraph · not in the 10-K filed Feb 20, 2025 10-K, ITEM 1A
Competitive pressures may adversely affect our market share, revenue and profitability.
New risk paragraphs, against peers
Latest 10-K of each, Consumer staples companies closest in revenue
Paragraphs in Risk Factors with nothing like them in the company's 10-K the year before. A count of text, not of risk.
Financial performance
Last 4 fiscal years · 10-K XBRL
| Metric | FY2022 | FY2023 | FY2024 | FY2025 |
|---|---|---|---|---|
| Revenue | $7.9B | $8.2B | $7.4B | $7.2B |
| Net income | $492.0M | $643.0M | $647.0M | $729.0M |
| Operating cash flow | $152.0M | $1.1B | $1.4B | $944.0M |
| Free cash flow | −$148.0M | $743.0M | $1.1B | $511.0M |
Revenue, FY2016 to FY2025
Ten fiscal years, each from its own 10-K · XBRL · USD
$7.2B ▼ 2.8% in FY2025$729.0M ▲ 12.7% in FY2025$511.0M ▼ 55.2% in FY2025
Recent filings
3 filings in the last 30 days · SEC EDGAR
-
Planned saleNov 6, 2026Larry Fernandes (Senior Vice President, Chief Commercial and Sustainability Officer) adopted a 10b5-1 trading plan reported in the 10-Q, up to 21,303 shares, runs to Mar 3, 2028
-
10-QNov 6, 2026Quarterly report (10-Q) period ended Sep 30, 2026
-
8-KNov 5, 2026Quarterly results 8-K item 2.02
About the company
Ingredion Inc, Westchester, IL · from the 10-K filed Feb 17, 2026
Ingredion Incorporated (together with its consolidated subsidiaries, the “Company,” “Ingredion,” “we,” “us,” and “our”) is a leading global ingredient solutions provider that transforms grains, fruits, vegetables and other plant-based materials into value-added ingredient solutions for the food, beverage, animal nutrition, brewing and industrial markets. Our purpose is to bring the potential of people, nature and technology together to make life better. We develop, produce and sell a variety of food and beverage ingredients, primarily starches and sweeteners, for a broad range of customers in over 60 industries worldwide.
- Headquarters
- Westchester, IL
- Country
- United States
- Reports in
- USD
- Listed on
- NYSE
- Fiscal year ends
- December 31
- Last results
- Nov 5, 2026
- Incorporated in
- DE
Employees, at the top of the page: "As of December 31, 2025, we employed approximately 11,200 people, of whom approximately 3,200 were located in the U" (10-K). Address and exchange: SEC's company file.
Email alerts
Sources
The 10-K filed Feb 17, 2026 (open at SEC), compared with the 10-K filed Feb 20, 2025. Numbers from the XBRL of the 10-Ks; filings from SEC EDGAR.
Work with it: Excel workbook · CSV. Google Sheet that stays up to date: paste =IMPORTDATA("https://tickdelta.com/company/INGR/export.csv") into a cell.