International Seaways, Inc. INSW
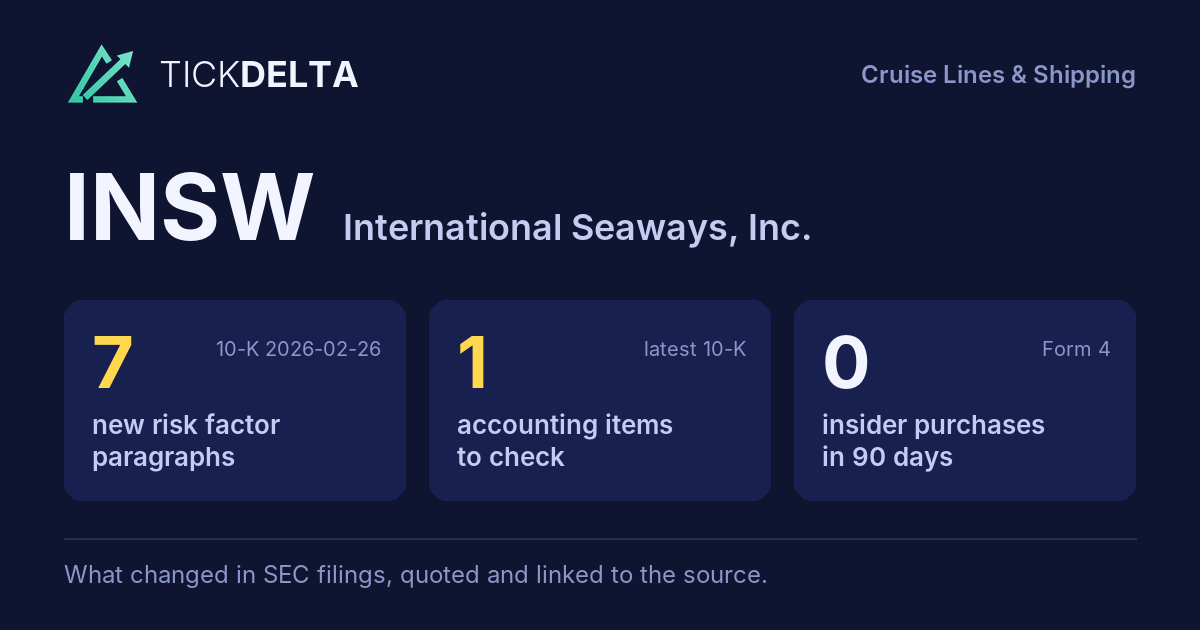
The biggest changes in the 10-K filed Feb 26, 2026, in management's words
10-K, Item 7This fiscal year against the last, and the sentences in the MD&A where management explains each change. Tickdelta picks sentences that name the line, a direction and a cause. It does not write explanations of its own.
Operating margin
Big change, FY to Dec 31, 2025 vs Dec 31, 2024
The MD&A has no sentence that names a cause for this change.
Cash from operations
Big change, FY to Dec 31, 2025 vs Dec 31, 2024
The MD&A has no sentence that names a cause for this change.
Net income
Big change, FY to Dec 31, 2025 vs Dec 31, 2024
The MD&A has no sentence that names a cause for this change.
Revenue
Big change, FY to Dec 31, 2025 vs Dec 31, 2024
“The decrease in TCE revenues in 2025 of $113.5 million, or 12%, to $819.6 million from $933.1 million in 2024 primarily reflects (i) a net aggregate rates-based decrease of $112.4 million resulting from lower average daily rates in the Product Carrier sectors, (ii) a $26.2 million days-based decline in the VLCC fleet associated with the first quarter of 2025 sales of one 2010-built VLCC and one 2011-built VLCC and (iii) a $16.7 million decrease in the Crude Tankers Lightering business.”
Read it in the 10-K
“Partially offsetting the TCE revenue decreases described above were (i) a rates-based increase in the VLCC fleet of $26.4 million due to strengthening rates in the sector and (ii) a $10.2 million days-based increase in the MR fleet, which reflects the timing of the acquisition of nine modern MRs between April 2024 and January 2025 as compared to the sales of 11 older vessels in the fleet between April 2024 and December 2025.”
Read it in the 10-K
What management said, year by year
The cause given in each 10-K, 2 fiscal years, newest first · MD&A (Item 7)
Each bar is how the line changed that year (from the same 10-K's XBRL). Under it, the sentence in that year's MD&A that names the line, a direction and a cause, word for word. A year with no sentence says so.
Revenue
2 of 2 years explained-
FY 2025 -11.4%
“The decrease in TCE revenues in 2025 of $113.5 million, or 12%, to $819.6 million from $933.1 million in 2024 primarily reflects (i) a net aggregate rates-based decrease of $112.4 million resulting from lower average daily rates in the Product Carrier sectors, (ii) a $26.2 million days-based decline in the VLCC fleet associated with the first quarter of 2025 sales of one 2010-built VLCC and one 2011-built VLCC and (iii) a $16.7 million decrease in the Crude Tankers Lightering business.”
Read it in the FY 2025 10-K“Partially offsetting the TCE revenue decreases described above were (i) a rates-based increase in the VLCC fleet of $26.4 million due to strengthening rates in the sector and (ii) a $10.2 million days-based increase in the MR fleet, which reflects the timing of the acquisition of nine modern MRs between April 2024 and January 2025 as compared to the sales of 11 older vessels in the fleet between April 2024 and December 2025.”
Read it in the FY 2025 10-K -
FY 2024 -11.2%
“(c) Revenue days represent ship-operating days less days that vessels were not available for employment due to repairs, drydock or lay-up.”
Read it in the FY 2024 10-K
Operating margin
0 of 2 years explained-
FY 2025 -6.9 pts
The FY 2025 MD&A has no sentence that names a cause for this change.
-
FY 2024 -9.6 pts
The FY 2024 MD&A has no sentence that names a cause for this change.
Net income
0 of 2 years explained-
FY 2025 -25.8%
The FY 2025 MD&A has no sentence that names a cause for this change.
-
FY 2024 -25.1%
The FY 2024 MD&A has no sentence that names a cause for this change.
Cash from operations
0 of 2 years explained-
FY 2025 -30.5%
The FY 2025 MD&A has no sentence that names a cause for this change.
-
FY 2024 -20.5%
The FY 2024 MD&A has no sentence that names a cause for this change.
Changes are computed from the XBRL figures in the same 10-K. Hover a number to see the line item. Open the 10-K
Sources
The Management's Discussion and Analysis (Item 7) of the latest 10-K, quoted word for word; the changes are computed from the same 10-K's XBRL.
Also
Financials: the numbers year by year.
Work with it
Excel workbook · CSV. Google Sheet that stays up to date: paste =IMPORTDATA("https://tickdelta.com/company/INSW/export.csv") into a cell.