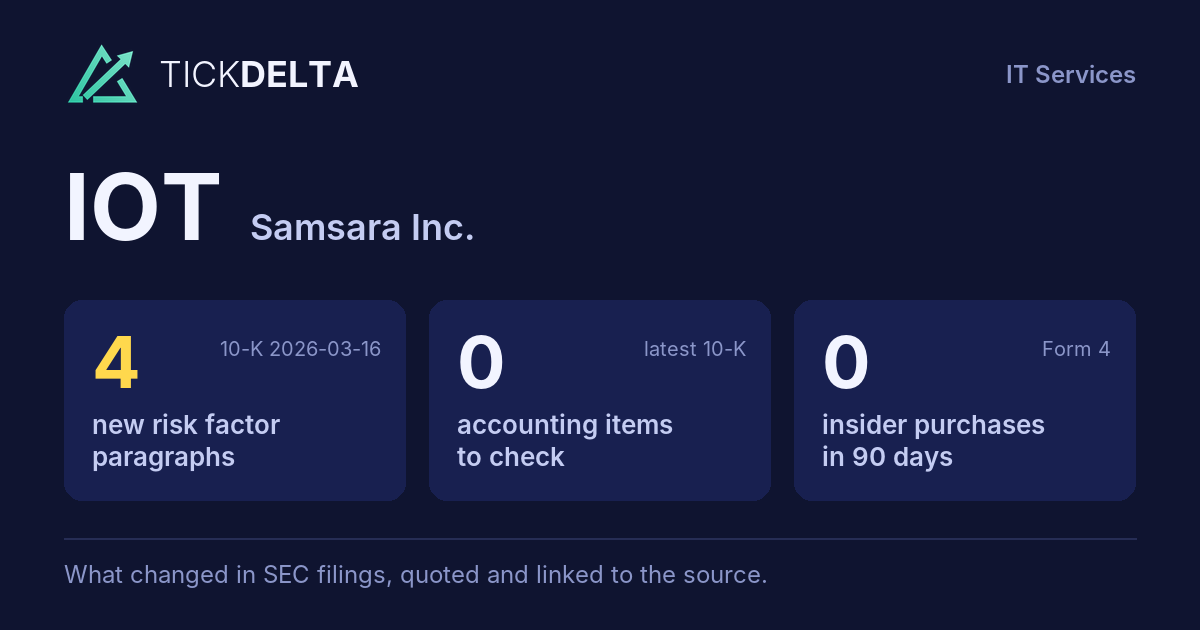
Screener / SEC EDGAR /CIK 0001642896 /10-K filed Mar 16, 2026, compared with Mar 25, 2025 /Numbers from the XBRL of the 10-Ks
NYSE Technology · IT Services

Samsara Inc. IOT

Compare with peers Embed
Earnings releases

Latest results release: Sep 3, 2026

8-K item 2.02, exhibit 99

What IOT's management wrote with each quarter's results: the press release and, when the company files them, its prepared remarks or the call transcript. The call itself is not filed with SEC, so most quarters have the release only.

Adjusted vs GAAP earnings per share

In the company's own words · read from each release, never computed

What the company says its adjusted numbers leave out:

Non-GAAP Net Income and Non-GAAP Net Income per Share—We define non-GAAP net income as net income (loss) excluding the effect of stock-based compensation expense-related charges, lease modification, impairment, and related charges, and legal settlements and awards, in periods when they occur. release Sep 3, 2026

Both numbers are read from the words of each release (usually the highlights), never computed by us; hover a number for its sentence. Quarters where the release gives them only in a table are not shown. The company decides what "adjusted" leaves out; the full reconciliation is in the release.

Read and search

Every release, in full · linked to sec.gov

Press release Sep 3, 2026 · EX-99.1

Samsara Reports Second Quarter Fiscal Year 2027 Financial Results

Open on SEC

Samsara Reports Second Quarter Fiscal Year 2027 Financial Results • Q2 revenue of $508.4 million, representing 30% year-over-year growth and 29% in constant currency

• Q2 net new ARR of $134.1 million, representing 28% year-over-year growth in both actual and constant currency

• Customers with ARR over $1,000,000 generated over $500 million of ARR, representing over 50% year-over-year growth for the third consecutive quarter

• GAAP earnings per share of $0.03, representing the fourth consecutive quarter of GAAP profitability

SAN FRANCISCO, September 3, 2026 — Samsara Inc. (NYSE: IOT), the pioneer of the Connected Operations ® Platform, today reported financial results for the second quarter ended August 1, 2026, and released a shareholder letter accessible from the Samsara investor relations website at investors.samsara.com.

“Samsara delivered another quarter of durable and efficient growth, crossing $2.1 billion in ARR with 30% year-over-year growth for the third consecutive quarter,” said Sanjit Biswas, CEO and co-founder of Samsara. “Our large customers continue to drive our momentum, and customer adoption of some of our latest AI features is up more than 4x in the last two months. We’re innovating at an unprecedented pace and are excited to deliver even greater impact for our customers who keep the global economy running.”

(1) ARR and revenue are adjusted for constant currency. See the section titled “Operating Metrics and Non-GAAP Financial Measures” for constant currency methodology. 1 We report non-GAAP financial measures in addition to, and not as a substitute for, or superior to, financial measures calculated in accordance with generally accepted accounting principles (“GAAP”). See the section titled “Use of Non-GAAP Financial Measures” for an explanation of non-GAAP financial measures and the tables in the section titled “Reconciliation Between GAAP and Non-GAAP Financial Measures” for a reconciliation of GAAP to non-GAAP financial measures.

Our guidance includes GAAP and non-GAAP financial measures. For the third quarter and fiscal year 2027, Samsara expects the following:

Q3 FY2027 Outlook FY2027 Outlook Total revenue $514 million – $516 $2.043 billion – $2.047 million billion Year/Year revenue 24% 26% growth Year/Year revenue growth in constant 23% – 24% 26% currency(1) Non-GAAP operating 21% 21% margin(2) Non-GAAP net income per share, $0.18 – $0.19 $0.76 – $0.78 diluted(2) GAAP net income per GAAP Profitable GAAP Profitable share, diluted

(1) Constant currency impact to revenue guidance is $2 million for Q3 FY2027 and $10 million for FY2027. See the section titled “Operating Metrics and Non-GAAP Financial Measures” for constant currency methodology.

(2) Other than with respect to revenue growth adjusted for constant currency, a reconciliation of non-GAAP guidance financial measures to corresponding GAAP guidance financial measures is not available on a forward-looking basis without unreasonable effort due to the uncertainty and potential variability of expenses, such as stock-based compensation expense-related charges, that may be incurred in the future and cannot be reasonably determined or predicted at this time. It is important to note that these factors could be material to our results of operations calculated in accordance with GAAP.

Samsara is the pioneer of the Connected Operations ® Platform, which is an open platform that connects the people, assets, and systems of some of the world’s most complex operations, allowing them to develop actionable insights and improve their operations. With tens of thousands of customers across North America and Europe, Samsara is a proud technology partner to the people who keep our global economy running, including the world’s leading organizations across industries in construction, transportation, wholesale and retail trade, field services, logistics, manufacturing, utilities and energy, government, healthcare and education, food and beverage, and others. The company’s mission is to increase the safety, efficiency, and sustainability of the operations that power the global economy.

This press release contains forward-looking statements within the meaning of Section 27A of the Securities Act of 1933 and Section 21E of the Securities Exchange Act of 1934. These statements may relate to, but are not limited to, expectations of future operating results or financial performance, the calculation of certain of our key financial and operating metrics, our market opportunity, industry developments and trends, macroeconomic conditions, customer purchasing, adoption of and expected results from our Connected Operations Platform, including cost savings and return on investment, our pace of product development, our product roadmap, and our technological capability, including AI, and our competitive position, as well as assumptions relating to the foregoing. 2 Forward-looking statements are inherently subject to risks and uncertainties, some of which cannot be predicted or quantified and could cause actual results and events to differ. In some cases, you can identify forward-looking statements by terminology such as “anticipate,” “believe,” “contemplate,” “continue,” “could,” “estimate,” “expect,” “goal,” “guidance,” “intend,” “may,” “objective,” “ongoing,” “plan,” “potential,” “predict,” “project,” “seek,” “should,” “target,” “will,” “would,” or the negative of these terms or other comparable expressions that concern our expectations, strategies, plans, or intentions. You should not put undue reliance on any forward-looking statements. Forward-looking statements should not be read as a guarantee of future performance or results and will not necessarily be accurate indications of the times at, or by, which such performance or results will be achieved, if at all. Forward-looking statements are based on information available at the time those statements are made, including information furnished to us by third parties that we have not independently verified, and/or management’s good faith beliefs and assumptions as of that time with respect to future events, and are subject to risks and uncertainties that could cause actual performance or results to differ materially from those expressed in or suggested by the forward-looking statements. In light of these risks and uncertainties, the forward-looking events and circumstances discussed in this press release may not occur and actual results could differ materially from those anticipated or implied in the forward-looking statements.

These risks and uncertainties include our ability to retain customers and expand the use of our solution by our customers, our ability to attract new customers, our future financial performance, including trends in revenue and annual recurring revenue, net retention rate, costs of revenue, gross profit or gross margin, operating expenses, customer counts, non-GAAP financial measures (such as revenue adjusted for constant currency, year-over-year revenue growth adjusted for constant currency, non-GAAP gross margin, non-GAAP operating margin, and free cash flow and free cash flow margin, our ability to achieve or maintain profitability, the demand for our products or for solutions for connected operations in general, the impact of geopolitical tension, the emergence of public health crises, and similar macroeconomic events, including financial distress caused by bank failures, the impact of political elections in the United States and abroad, global supply chain challenges, increased costs (such as increases in the cost of memory and computing), foreign currency fluctuations, elevated inflation and interest rates, and changes to monetary, fiscal, and trade (including tariff) policies, on our and our customers’ and partners’ respective businesses, the length of our sales cycles, possible harm caused by a security breach or other incident affecting our or our customers’ assets or data, our ability to compete successfully in competitive markets, our ability to respond to rapid technological, legal, and regulatory changes, and our ability to continue to innovate and develop new Applications. The forward- looking statements contained in this press release are also subject to other risks and uncertainties, including those more fully described in our filings and reports that we may file from time to time with the Securities and Exchange Commission, including our Annual Reports on Form 10-K and Quarterly Reports on Form 10-Q.

Except as required by law, we do not undertake any obligation to publicly update or revise any forward-looking statement, whether as a result of new information, future developments, or otherwise.

This document includes certain non-GAAP financial measures. Reconciliations of non-GAAP financial measures to our financial results as determined in accordance with GAAP are included at the end of this press release following the accompanying financial data.

Non-GAAP financial measures have limitations as analytical tools and should not be considered in isolation or as substitutes for financial information presented under GAAP. There are a number of limitations related to the use of non-GAAP financial measures versus comparable financial measures determined under GAAP. For example, other companies in our industry may calculate these non-GAAP financial measures differently or may use other measures to evaluate their performance. In addition, free cash flow does not reflect our future contractual commitments or the total increase or decrease of our cash balance for a given period. These and other limitations could reduce the usefulness of these non- GAAP financial measures as analytical tools. Investors are encouraged to review the related GAAP financial measures and the reconciliations of these non-GAAP financial measures to their most directly comparable GAAP financial measures and to not rely on any single financial measure to evaluate our business.

We present these non-GAAP financial measures to assist investors in seeing Samsara’s operating results through the eyes of management and because we believe that these measures provide an additional tool for investors to evaluate our business. 3 Expenses (Income) Excluded from Non-GAAP Performance Financial Measures — Stock- based compensation expense-related charges include the amortization of deferred stock-based compensation expense for internal-use software and cloud computing arrangements and employer taxes on employee equity transactions. Stock-based compensation expense is a non-cash expense and is dependent on our stock price, which is beyond our control. Accordingly, we find it useful to exclude stock- based compensation expense in order to better understand our ongoing operational performance. Employer taxes on employee equity transactions, which are cash expenses, are excluded because such taxes are directly tied to the timing and size of employee equity transactions and the future fair market value of our common stock, which may vary from period to period independent of the operating performance of our business.

In periods when they occur, significant lease modification, impairment, and related charges, and legal settlements and awards are excluded because management believes that such items are not reflective of our ongoing operational performance.

Annual Recurring Re venue (ARR)—We define ARR a s the annualized value of subscription contracts that have commenced revenue recognition as of the measurement date.

Net New ARR —Net new ARR is calculated as the difference between the annualized value of subscription contracts that have commenced revenue recognition as of the end of the reporting period and the annualized value of subscription contracts that have commenced revenue recognition as of the end of the prior reporting period.

Constant Currency—Constant currency is a methodology for assessing how our underlying business performed excluding the effect of foreign currency rate fluctuations. To present this information, current period results for customer contracts denominated in currencies other than U.S. dollars are converted into U.S. dollars using the average currency exchange rates in effect during the comparative period, rather than the actual currency exchange rates in effect during the current period. For ARR and net new ARR, customer contracts denominated in currencies other than U.S. dollars are translated into U.S. dollars based on the currency exchange rate as of the day of the effective date of the contract. For guidance, currency impact on total revenue growth is derived by applying the average currency exchange rates in effect during the comparative period, rather than the currency exchange rates for the guidance period.

Customer—We define a customer as an entity, or group of affiliated entities with a shared parent organization, that has ARR of greater than $1,000 at the end of a reporting period. Determinations regarding the relationship between customer entities are primarily based on publicly available information and information supplied to us by our customers, and we have not independently verified the legal relationship between entities in all cases. Our customer count is subject to adjustments for acquisitions, spin-offs, segmentation by geography, and other market and commercial activity.

Non-GAAP Gross Profit and Non-GAAP Gross Margin—We define non-GAAP gross profit as gross profit excluding the effect of stock-based compensation expense-related charges included in cost of revenue. Non-GAAP gross margin is defined as non- GAAP gross profit as a percentage of total revenue. We use non-GAAP gross profit and non-GAAP gross margin in conjunction with traditional GAAP measures to evaluate our financial performance. We believe that non-GAAP gross profit and non-GAAP gross margin provide our management and investors consistency and comparability with our past financial performance and facilitate period-to- period comparisons of operations.

Non-GAAP Operating Income and Non-GAAP Operating Margin—We define non-GAAP operating income as income (loss) from operations excluding the effect of stock- based compensation expense-related charges, lease modification, impairment, and related charges, and legal settlements and awards, in periods when they occur. Non-GAAP operating margin is defined as non-GAAP operating income as a percentage of total revenue. We use non-GAAP operating income and non-GAAP operating margin in conjunction with traditional GAAP measures to evaluate our financial performance. We believe that non-GAAP operating income and non-GAAP operating margin provide our management and investors consistency and comparability with our past financial performance and facilitate period-to- period comparisons of operations.

Non-GAAP Net Income and Non-GAAP Net Income per Share—We define non-GAAP net income as net income (loss) excluding the effect of stock-based compensation expense-related charges, lease modification, impairment, and related charges, and legal settlements and awards, in periods when they occur. Our non-GAAP net income per share–basic is calculated by dividing non-GAAP net income by the weighted-average number of shares of common stock outstanding during the period. Our non-GAAP net income per share–diluted is calculated by giving effect to all potentially dilutive common stock equivalents (stock options, restricted stock units, and shares issued under our 2021 Employee Stock Purchase Plan) to the extent they are dilutive. Non-GAAP net loss per share–diluted is the same as non-GAAP net loss per share–basic as the inclusion of all potential dilutive common stock equivalents would be antidilutive. We use non-GAAP net income and non-GAAP net income per share in conjunction with traditional GAAP measures to evaluate our financial performance. We believe that non-GAAP net income and non- GAAP net income per share provide our management and investors consistency and comparability with our past financial performance and facilitate period-to- period comparisons of operations. 4 Free Cash Flow and Free Cash Flow Margin—We define free cash flow as net cash provided by operating activities reduced by cash used for purchases of property and equipment. Free cash flow margin is calculated as free cash flow as a percentage of total revenue. We believe that free cash flow and free cash flow margin, even if negative, are useful in evaluating liquidity and provide information to management and investors about our ability to fund future operating needs and strategic initiatives.

An investor presentation and accompanying shareholder letter are accessible from the Samsara investor relations website at https://investors.samsara.com/. Samsara will host a live webcast to discuss the results at 2:00 p.m. Pacific Time (5:00 p.m. Eastern Time) today. The live webcast may be accessed at https://investors.samsara.com/. Following the webcast, a replay will be accessible from the same website. Investor Contact:

As of August 1, 2026 January 31, 2026 ────────────────────────────────────────────────────────────────────────────── Assets Current assets: Cash and cash equivalents $ 291,392 $ 318,789 Short-term investments 537,536 515,003 Accounts receivable, net 337,792 321,442 Inventories 57,032 48,194 Connected device costs, 155,670 142,904 current Deferred commissions, 95,030 85,463 current Prepaid expenses and other current 98,315 75,323 assets Total current assets 1,572,767 1,507,118 Long-term investments 496,782 403,123 Property and equipment, net 88,030 81,607 Operating lease right-of-use 58,317 60,303 assets Connected device costs, 333,878 297,245 non-current Deferred commissions, 199,224 176,415 non-current Other assets 20,130 14,863 Total assets $ 2,769,128 $ 2,540,674 Liabilities and stockholders’ equity Current liabilities: Accounts payable $ 41,239 $ 47,680 Accrued expenses and other current 123,171 102,073 liabilities Accrued compensation and 62,236 75,403 benefits Deferred revenue, current 728,904 679,316 Operating lease liabilities, 12,535 12,566 current Total current liabilities 968,085 917,038 Deferred revenue, 123,868 129,726 non-current Operating lease liabilities, 56,957 60,202 non-current Other liabilities 18,244 13,261 Total liabilities 1,167,154 1,120,227 Stockholders’ equity: Preferred stock — — Class A common stock 13 13 Class B common stock 23 23 Class C common stock — — Additional paid-in capital 3,161,197 3,035,176 Accumulated other comprehensive income -887 4,357 (loss) Accumulated deficit -1,558,372 -1,619,122 Total stockholders’ equity 1,601,974 1,420,447 Total liabilities and stockholders’ $ 2,769,128 $ 2,540,674 equity

(1) To facilitate comparability across periods, revenue and revenue growth are adjusted for constant currency by excluding the effect of foreign currency rate fluctuations.

(2) Stock-based compensation expense-related charges were included in the following line items of our condensed consolidated statements of operations and comprehensive income (loss) as follows:

(3) On February 3, 2026, in the breach of contract, fraud, unfair competition, and false advertising arbitration matter between Samsara Inc. and Motive Technologies, Inc., an arbitration award was rendered in favor of Samsara. As a result of the arbitration award, Samsara recognized a gain of $30.3 million during the six months ended August 1, 2026 .

(4) There were no material income tax effects on our non-GAAP adjustments for all periods presented.

(5) For each period in which we had net income, diluted net income per share is calculated using weighted-average number of shares of common stock outstanding during the period, adjusted for dilutive potential shares that were assumed outstanding during the period.

(6) Stock-based compensation expense-related charges included amortization of capitalized stock-based compensation expense of approximately $1.5 million and $2.8 million for the three and six months ended August 1, 2026, respectively, and approximately $0.8 million and $1.6 million for the three and six months ended August 2, 2025, respectively, which was initially capitalized as internal- use software or cloud computing arrangements. Stock-based compensation expense- related charges also included approximately $3.3 million and $8.3 million of employer taxes on employee equity transactions for the three and six months ended August 1, 2026, respectively, and approximately $4.4 million and $10.9 million of employer taxes on employee equity transactions for the three and six months ended August 2, 2025, respectively. 11

Full text with the tables
                                                                                
  Exhibit 99.1                                                                  
                                                                                
       Samsara Reports Second Quarter Fiscal Year 2027 Financial Results        
• Q2 revenue of $508.4 million, representing 30% year-over-year growth and 29%
in constant currency

• Q2 net new ARR of $134.1 million, representing 28% year-over-year growth in
both actual and constant currency

• Ending ARR of $2.125 billion, representing 30% year-over-year growth

• Customers with ARR over $1,000,000 generated over $500 million of ARR,
representing over 50% year-over-year growth for the third consecutive quarter

• GAAP earnings per share of $0.03, representing the fourth consecutive quarter
of GAAP profitability

SAN FRANCISCO, September 3, 2026 — Samsara Inc. (NYSE: IOT), the pioneer of the
Connected Operations ® Platform, today reported financial results for the second
quarter ended August 1, 2026, and released a shareholder letter accessible from
the Samsara investor relations website at investors.samsara.com.

“Samsara delivered another quarter of durable and efficient growth, crossing
$2.1 billion in ARR with 30% year-over-year growth for the third consecutive
quarter,” said Sanjit Biswas, CEO and co-founder of Samsara. “Our large
customers continue to drive our momentum, and customer adoption of some of our
latest AI features is up more than 4x in the last two months. We’re innovating
at an unprecedented pace and are excited to deliver even greater impact for our
customers who keep the global economy running.”
                                                                                
   Second Quarter Fiscal Year 2027 Financial Highlights                         
                                                                                
(In millions, except percentage, percentage points, and per share data)
                                                                                
                        Q2 FY2027          Q2 FY2026           Y/Y Change       
 ────────────────────────────────────────────────────────────────────────────── 
  Annual                                                                        
  Recurring          $    2,124.7       $    1,640.1                   30  %    
  Revenue (ARR)                                                                 
  ARR adjusted                                                                  
  for constant       $    2,124.3       $    1,640.1                   30  %    
  currency(1)                                                                   
  Total revenue      $      508.4       $      391.5                   30  %    
  Total revenue                                                                 
  adjusted for       $      506.1       $      391.5                   29  %    
  constant                                                                      
  currency(1)                                                                   
  GAAP gross         $      392.6       $      301.0        $        91.6       
  profit                                                                        
  GAAP gross                   77  %              77  %                 —  pt   
  margin                                                                        
  Non-GAAP gross     $      398.0       $      305.7        $        92.3       
  profit                                                                        
  Non-GAAP gross               78  %              78  %                 —  pt   
  margin                                                                        
  GAAP income                                                                   
  (loss) from        $        4.9       $      -26.6        $        31.5       
  operations                                                                    
  GAAP operating                1  %              (7  %)                8  pts  
  margin                                                                        
  Non-GAAP                                                                      
  operating          $      106.0       $       59.7        $        46.3       
  income                                                                        
  Non-GAAP                                                                      
  operating                    21  %              15  %                 6  pts  
  margin                                                                        
  GAAP net income                                                               
  (loss) per         $       0.03       $      -0.03        $        0.06       
  share, basic                                                                  
  and diluted                                                                   
  Non-GAAP net                                                                  
  income per                                                                    
  share, basic       $       0.20       $       0.12        $        0.08       
  and                                                                           
  diluted                                                                       
  Net cash                                                                      
  provided by        $       73.5       $       50.2        $        23.3       
  operating                                                                     
  activities                                                                    
  Net cash                                                                      
  provided by                                                                   
  operating                    14  %              13  %                 2  pts  
  activities                                                                    
  margin                                                                        
  Free cash flow     $       64.7       $       44.2        $        20.5       
  Free cash flow               13  %              11  %                 1  pt   
  margin                                                                        
                                                                                
__________

Note: Numbers are rounded for presentation purposes.

(1) ARR and revenue are adjusted for constant currency. See the section titled
“Operating Metrics and Non-GAAP Financial Measures” for constant currency
methodology.
                                       1                                        
We report non-GAAP financial measures in addition to, and not as a substitute
for, or superior to, financial measures calculated in accordance with generally
accepted accounting principles (“GAAP”). See the section titled “Use of Non-GAAP
Financial Measures” for an explanation of non-GAAP financial measures and the
tables in the section titled “Reconciliation Between GAAP and Non-GAAP Financial
Measures” for a reconciliation of GAAP to non-GAAP financial measures.
                                                                                
   Financial Outlook                                                            
                                                                                
Our guidance includes GAAP and non-GAAP financial measures. For the third
quarter and fiscal year 2027, Samsara expects the following:
                                                                                
                            Q3 FY2027 Outlook          FY2027 Outlook           
  Total revenue             $514 million – $516        $2.043 billion – $2.047  
                            million                    billion                  
  Year/Year revenue         24%                        26%                      
  growth                                                                        
  Year/Year revenue                                                             
  growth in constant        23%  – 24%                 26%                      
  currency(1)                                                                   
  Non-GAAP operating        21%                        21%                      
  margin(2)                                                                     
  Non-GAAP net income                                                           
  per share,                $0.18 – $0.19              $0.76 – $0.78            
  diluted(2)                                                                    
  GAAP net income per       GAAP Profitable            GAAP Profitable          
  share, diluted                                                                
                                                                                
__________

(1) Constant currency impact to revenue guidance is $2 million for Q3 FY2027 and
$10 million for FY2027. See the section titled “Operating Metrics and Non-GAAP
Financial Measures” for constant currency methodology.

(2) Other than with respect to revenue growth adjusted for constant currency, a
reconciliation of non-GAAP guidance financial measures to corresponding GAAP
guidance financial measures is not available on a forward-looking basis without
unreasonable effort due to the uncertainty and potential variability of
expenses, such as stock-based compensation expense-related charges, that may be
incurred in the future and cannot be reasonably determined or predicted at this
time. It is important to note that these factors could be material to our
results of operations calculated in accordance with GAAP.
                                                                                
  About Samsara                                                                 
                                                                                
Samsara is the pioneer of the Connected Operations ® Platform, which is an open
platform that connects the people, assets, and systems of some of the world’s
most complex operations, allowing them to develop actionable insights and
improve their operations. With tens of thousands of customers across North
America and Europe, Samsara is a proud technology partner to the people who keep
our global economy running, including the world’s leading organizations across
industries in construction, transportation, wholesale and retail trade, field
services, logistics, manufacturing, utilities and energy, government, healthcare
and education, food and beverage, and others. The company’s mission is to
increase the safety, efficiency, and sustainability of the operations that power
the global economy.
                                                                                
  Forward-Looking Statements                                                    
                                                                                
This press release contains forward-looking statements within the meaning of
Section 27A of the Securities Act of 1933 and Section 21E of the Securities
Exchange Act of 1934. These statements may relate to, but are not limited to,
expectations of future operating results or financial performance, the
calculation of certain of our key financial and operating metrics, our market
opportunity, industry developments and trends, macroeconomic conditions,
customer purchasing, adoption of and expected results from our Connected
Operations Platform, including cost savings and return on investment, our pace
of product development, our product roadmap, and our technological capability,
including AI, and our competitive position, as well as assumptions relating to
the foregoing.
                                       2                                        
Forward-looking statements are inherently subject to risks and uncertainties,
some of which cannot be predicted or quantified and could cause actual results
and events to differ. In some cases, you can identify forward-looking statements
by terminology such as “anticipate,” “believe,” “contemplate,” “continue,”
“could,” “estimate,” “expect,” “goal,” “guidance,” “intend,” “may,” “objective,”
“ongoing,” “plan,” “potential,” “predict,” “project,” “seek,” “should,”
“target,” “will,” “would,” or the negative of these terms or other comparable
expressions that concern our expectations, strategies, plans, or intentions. You
should not put undue reliance on any forward-looking statements. Forward-looking
statements should not be read as a guarantee of future performance or results
and will not necessarily be accurate indications of the times at, or by, which
such performance or results will be achieved, if at all. Forward-looking
statements are based on information available at the time those statements are
made, including information furnished to us by third parties that we have not
independently verified, and/or management’s good faith beliefs and assumptions
as of that time with respect to future events, and are subject to risks and
uncertainties that could cause actual performance or results to differ
materially from those expressed in or suggested by the forward-looking
statements. In light of these risks and uncertainties, the forward-looking
events and circumstances discussed in this press release may not occur and
actual results could differ materially from those anticipated or implied in the
forward-looking statements.

These risks and uncertainties include our ability to retain customers and expand
the use of our solution by our customers, our ability to attract new customers,
our future financial performance, including trends in revenue and annual
recurring revenue, net retention rate, costs of revenue, gross profit or gross
margin, operating expenses, customer counts, non-GAAP financial measures (such
as revenue adjusted for constant currency, year-over-year revenue growth
adjusted for constant currency, non-GAAP gross margin, non-GAAP operating
margin, and free cash flow and free cash flow margin, our ability to achieve or
maintain profitability, the demand for our products or for solutions for
connected operations in general, the impact of geopolitical tension, the
emergence of public health crises, and similar macroeconomic events, including
financial distress caused by bank failures, the impact of political elections in
the United States and abroad, global supply chain challenges, increased costs
(such as increases in the cost of memory and computing), foreign currency
fluctuations, elevated inflation and interest rates, and changes to monetary,
fiscal, and trade (including tariff) policies, on our and our customers’ and
partners’ respective businesses, the length of our sales cycles, possible harm
caused by a security breach or other incident affecting our or our customers’
assets or data, our ability to compete successfully in competitive markets, our
ability to respond to rapid technological, legal, and regulatory changes, and
our ability to continue to innovate and develop new Applications. The forward-
looking statements contained in this press release are also subject to other
risks and uncertainties, including those more fully described in our filings and
reports that we may file from time to time with the Securities and Exchange
Commission, including our Annual Reports on Form 10-K and Quarterly Reports on
Form 10-Q.

Except as required by law, we do not undertake any obligation to publicly update
or revise any forward-looking statement, whether as a result of new information,
future developments, or otherwise.
                                                                                
   Use of Non-GAAP Financial Measures                                           
                                                                                
This document includes certain non-GAAP financial measures. Reconciliations of
non-GAAP financial measures to our financial results as determined in accordance
with GAAP are included at the end of this press release following the
accompanying financial data.

Non-GAAP financial measures have limitations as analytical tools and should not
be considered in isolation or as substitutes for financial information presented
under GAAP. There are a number of limitations related to the use of non-GAAP
financial measures versus comparable financial measures determined under GAAP.
For example, other companies in our industry may calculate these non-GAAP
financial measures differently or may use other measures to evaluate their
performance. In addition, free cash flow does not reflect our future contractual
commitments or the total increase or decrease of our cash balance for a given
period. These and other limitations could reduce the usefulness of these non-
GAAP financial measures as analytical tools. Investors are encouraged to review
the related GAAP financial measures and the reconciliations of these non-GAAP
financial measures to their most directly comparable GAAP financial measures and
to not rely on any single financial measure to evaluate our business.

We present these non-GAAP financial measures to assist investors in seeing
Samsara’s operating results through the eyes of management and because we
believe that these measures provide an additional tool for investors to evaluate
our business.
                                       3                                        
Expenses (Income) Excluded from Non-GAAP Performance Financial Measures — Stock-
based compensation expense-related charges include the amortization of deferred
stock-based compensation expense for internal-use software and cloud computing
arrangements and employer taxes on employee equity transactions. Stock-based
compensation expense is a non-cash expense and is dependent on our stock price,
which is beyond our control. Accordingly, we find it useful to exclude stock-
based compensation expense in order to better understand our ongoing operational
performance. Employer taxes on employee equity transactions, which are cash
expenses, are excluded because such taxes are directly tied to the timing and
size of employee equity transactions and the future fair market value of our
common stock, which may vary from period to period independent of the operating
performance of our business.

In periods when they occur, significant lease modification, impairment, and
related charges, and legal settlements and awards are excluded because
management believes that such items are not reflective of our ongoing
operational performance.
                                                                                
   Operating Metrics and Non-GAAP Financial Measures                            
                                                                                
Annual Recurring Re venue (ARR)—We define ARR a s the annualized value of
subscription contracts that have commenced revenue recognition as of the
measurement date.

Net New ARR —Net new ARR is calculated as the difference between the annualized
value of subscription contracts that have commenced revenue recognition as of
the end of the reporting period and the annualized value of subscription
contracts that have commenced revenue recognition as of the end of the prior
reporting period.

Constant Currency—Constant currency is a methodology for assessing how our
underlying business performed excluding the effect of foreign currency rate
fluctuations. To present this information, current period results for customer
contracts denominated in currencies other than U.S. dollars are converted into
U.S. dollars using the average currency exchange rates in effect during the
comparative period, rather than the actual currency exchange rates in effect
during the current period. For ARR and net new ARR, customer contracts
denominated in currencies other than U.S. dollars are translated into U.S.
dollars based on the currency exchange rate as of the day of the effective date
of the contract. For guidance, currency impact on total revenue growth is
derived by applying the average currency exchange rates in effect during the
comparative period, rather than the currency exchange rates for the guidance
period.

Customer—We define a customer as an entity, or group of affiliated entities with
a shared parent organization, that has ARR of greater than $1,000 at the end of
a reporting period. Determinations regarding the relationship between customer
entities are primarily based on publicly available information and information
supplied to us by our customers, and we have not independently verified the
legal relationship between entities in all cases. Our customer count is subject
to adjustments for acquisitions, spin-offs, segmentation by geography, and other
market and commercial activity.

Non-GAAP Gross Profit and Non-GAAP Gross Margin—We define non-GAAP gross profit
as gross profit excluding the effect of stock-based compensation expense-related
charges included in cost of revenue. Non-GAAP gross margin is defined as non-
GAAP gross profit as a percentage of total revenue. We use non-GAAP gross profit
and non-GAAP gross margin in conjunction with traditional GAAP measures to
evaluate our financial performance. We believe that non-GAAP gross profit and
non-GAAP gross margin provide our management and investors consistency and
comparability with our past financial performance and facilitate period-to-
period comparisons of operations.

Non-GAAP Operating Income and Non-GAAP Operating Margin—We define non-GAAP
operating income as income (loss) from operations excluding the effect of stock-
based compensation expense-related charges, lease modification, impairment, and
related charges, and legal settlements and awards, in periods when they occur.
Non-GAAP operating margin is defined as non-GAAP operating income as a
percentage of total revenue. We use non-GAAP operating income and non-GAAP
operating margin in conjunction with traditional GAAP measures to evaluate our
financial performance. We believe that non-GAAP operating income and non-GAAP
operating margin provide our management and investors consistency and
comparability with our past financial performance and facilitate period-to-
period comparisons of operations.

Non-GAAP Net Income and Non-GAAP Net Income per Share—We define non-GAAP net
income as net income (loss) excluding the effect of stock-based compensation
expense-related charges, lease modification, impairment, and related charges,
and legal settlements and awards, in periods when they occur. Our non-GAAP net
income per share–basic is calculated by dividing non-GAAP net income by the
weighted-average number of shares of common stock outstanding during the period.
Our non-GAAP net income per share–diluted is calculated by giving effect to all
potentially dilutive common stock equivalents (stock options, restricted stock
units, and shares issued under our 2021 Employee Stock Purchase Plan) to the
extent they are dilutive. Non-GAAP net loss per share–diluted is the same as
non-GAAP net loss per share–basic as the inclusion of all potential dilutive
common stock equivalents would be antidilutive. We use non-GAAP net income and
non-GAAP net income per share in conjunction with traditional GAAP measures to
evaluate our financial performance. We believe that non-GAAP net income and non-
GAAP net income per share provide our management and investors consistency and
comparability with our past financial performance and facilitate period-to-
period comparisons of operations.
                                       4                                        
Free Cash Flow and Free Cash Flow Margin—We define free cash flow as net cash
provided by operating activities reduced by cash used for purchases of property
and equipment. Free cash flow margin is calculated as free cash flow as a
percentage of total revenue. We believe that free cash flow and free cash flow
margin, even if negative, are useful in evaluating liquidity and provide
information to management and investors about our ability to fund future
operating needs and strategic initiatives.
                                                                                
  Webcast Information and Shareholder Letter                                    
                                                                                
An investor presentation and accompanying shareholder letter are accessible from
the Samsara investor relations website at https://investors.samsara.com/.
Samsara will host a live webcast to discuss the results at 2:00 p.m. Pacific
Time (5:00 p.m. Eastern Time) today. The live webcast may be accessed at
https://investors.samsara.com/. Following the webcast, a replay will be
accessible from the same website.
Investor Contact:

Mike Chang

[email protected]

Media Contact:

Stephanie Burke

[email protected]
                                       5                                        
                                                                                
                                  SAMSARA INC.                                  
                                                                                
                                                                                
                     CONDENSED CONSOLIDATED BALANCE SHEETS                      
                                                                                
                                 (In thousands)                                 
                                                                                
                                  (Unaudited)                                   
                                                                                
                                  As of  August 1, 2026       January 31, 2026  
 ────────────────────────────────────────────────────────────────────────────── 
  Assets                                                                        
  Current assets:                                                               
  Cash and cash equivalents       $             291,392    $           318,789  
  Short-term investments                        537,536                515,003  
  Accounts receivable, net                      337,792                321,442  
  Inventories                                    57,032                 48,194  
  Connected device costs,                       155,670                142,904  
  current                                                                       
  Deferred commissions,                          95,030                 85,463  
  current                                                                       
  Prepaid expenses and other                                                    
  current                                        98,315                 75,323  
  assets                                                                        
  Total current assets                        1,572,767              1,507,118  
  Long-term investments                         496,782                403,123  
  Property and equipment, net                    88,030                 81,607  
  Operating lease right-of-use                   58,317                 60,303  
  assets                                                                        
  Connected device costs,                       333,878                297,245  
  non-current                                                                   
  Deferred commissions,                         199,224                176,415  
  non-current                                                                   
  Other assets                                   20,130                 14,863  
  Total assets                    $           2,769,128    $         2,540,674  
  Liabilities and                                                               
  stockholders’ equity                                                          
  Current liabilities:                                                          
  Accounts payable                $              41,239    $            47,680  
  Accrued expenses and other                                                    
  current                                       123,171                102,073  
  liabilities                                                                   
  Accrued compensation and                       62,236                 75,403  
  benefits                                                                      
  Deferred revenue, current                     728,904                679,316  
  Operating lease liabilities,                   12,535                 12,566  
  current                                                                       
  Total current liabilities                     968,085                917,038  
  Deferred revenue,                             123,868                129,726  
  non-current                                                                   
  Operating lease liabilities,                   56,957                 60,202  
  non-current                                                                   
  Other liabilities                              18,244                 13,261  
  Total liabilities                           1,167,154              1,120,227  
  Stockholders’ equity:                                                         
  Preferred stock                                     —                      —  
  Class A common stock                               13                     13  
  Class B common stock                               23                     23  
  Class C common stock                                —                      —  
  Additional paid-in capital                  3,161,197              3,035,176  
  Accumulated other                                                             
  comprehensive income                             -887                  4,357  
  (loss)                                                                        
  Accumulated deficit                        -1,558,372             -1,619,122  
  Total stockholders’ equity                  1,601,974              1,420,447  
  Total liabilities and                                                         
  stockholders’                   $           2,769,128    $         2,540,674  
  equity                                                                        
                                                                                
                                       6                                        
                                                                                
                                  SAMSARA INC.                                  
                                                                                
CONDENSED CONSOLIDATED STATEMENTS OF OPERATIONS AND COMPREHENSIVE INCOME (LOSS) 
                                                                                
                (In thousands, except share and per share data)                 
                                                                                
                                  (Unaudited)                                   
                                                                                
            Three                              Six                              
            Months    August         August    Months     August        August  
            Ended    1, 2026        2, 2025    Ended     1, 2026       2, 2025  
 ────────────────────────────────────────────────────────────────────────────── 
  Reven…    $        508,437    $   391,480    $         987,281    $  758,364  
  Cost                                                                          
  of                 115,856         90,501              233,557       173,670  
  reven…                                                                        
  Gross              392,581        300,979              753,724       584,694  
  profit                                                                        
  Opera…                                                                        
  expen…                                                                        
  Resea…                                                                        
  and                102,556         85,612              200,123       168,854  
  devel…                                                                        
  Sales                                                                         
  and                217,774        174,083              421,377       339,483  
  marke…                                                                        
  Gener…                                                                        
  and                 67,376         67,903              120,154       136,231  
  admin…                                                                        
  Total                                                                         
  opera…             387,706        327,598              741,654       644,568  
  expen…                                                                        
  Income                                                                        
  (loss)               4,875        -26,619               12,070       -59,874  
  from                                                                          
  opera…                                                                        
  Inter…                                                                        
  income                                                                        
  and                 12,654         11,426               54,386        24,149  
  other                                                                         
  incom…                                                                        
  net                                                                           
  Income                                                                        
  (loss)                                                                        
  before                                                                        
  provi…              17,529        -15,193               66,456       -35,725  
  for                                                                           
  income                                                                        
  taxes                                                                         
  Provi…                                                                        
  for                  1,287          1,607                5,706         3,196  
  income                                                                        
  taxes                                                                         
  Net                                                                           
  income    $         16,242    $   -16,800    $          60,750    $  -38,921  
  (loss)                                                                        
  Other                                                                         
  compr…                                                                        
  income                                                                        
  (loss…                                                                        
  Forei…                                                                        
  curre…                                                                        
  trans…                 284            733                  353         1,693  
  adjus…                                                                        
  net of                                                                        
  tax                                                                           
  Unrea…                                                                        
  gains                                                                         
  (loss…                                                                        
  on                  -2,500            818               -5,597         1,377  
  inves…                                                                        
  net of                                                                        
  tax                                                                           
  Total                                                                         
  other                                                                         
  compr…              -2,216          1,551               -5,244         3,070  
  income                                                                        
  (loss…                                                                        
  Compr…                                                                        
  income    $         14,026    $   -15,249    $          55,506    $  -35,851  
  (loss)                                                                        
  Basic                                                                         
  and                                                                           
  dilut…                                                                        
  net                                                                           
  income                                                                        
  (loss)                                                                        
  per                                                                           
  share:                                                                        
  Net                                                                           
  income                                                                        
  (loss)                                                                        
  per       $           0.03    $     -0.03    $            0.10    $    -0.07  
  share,                                                                        
  basic                                                                         
  and                                                                           
  dilut…                                                                        
  Weigh…                                                                        
  shares                                                                        
  used                                                                          
  in                                                                            
  compu…                                                                        
  net                584,13…       571,738…             582,985…       569,73…  
  income                                                                        
  (loss)                                                                        
  per                                                                           
  share,                                                                        
  basic                                                                         
  Weigh…                                                                        
  shares                                                                        
  used                                                                          
  in                                                                            
  compu…                                                                        
  net                590,46…       571,738…             589,069…       569,73…  
  income                                                                        
  (loss)                                                                        
  per                                                                           
  share,                                                                        
  dilut…                                                                        
                                                                                
                                       7                                        
                                                                                
                                  SAMSARA INC.                                  
                                                                                
                                                                                
                CONDENSED CONSOLIDATED STATEMENTS OF CASH FLOWS                 
                                                                                
                                 (In thousands)                                 
                                                                                
                                  (Unaudited)                                   
                                                                                
            Three                              Six                              
            Months    August         August    Months     August        August  
            Ended    1, 2026        2, 2025    Ended     1, 2026       2, 2025  
 ────────────────────────────────────────────────────────────────────────────── 
  Opera…                                                                        
  activ…                                                                        
  Net                                                                           
  income    $         16,242    $   -16,800    $          60,750    $  -38,921  
  (loss)                                                                        
  Adjus…                                                                        
  to                                                                            
  recon…                                                                        
  net                                                                           
  income                                                                        
  (loss)                                                                        
  to net                                                                        
  cash                                                                          
  provi…                                                                        
  by                                                                            
  opera…                                                                        
  activ…                                                                        
  Depre…                                                                        
  and                  8,411          5,399               16,339        10,541  
  amort…                                                                        
  Stock…                                                                        
  compe…              96,385         81,135              173,856       158,214  
  expen…                                                                        
  Net                                                                           
  accre…                                                                        
  of                  -2,867         -2,406               -5,790        -4,988  
  disco…                                                                        
  on                                                                            
  inves…                                                                        
  Other                3,284           -695                3,894        -1,043  
  Chang…                                                                        
  in                                                                            
  opera…                                                                        
  assets                                                                        
  and                                                                           
  liabi…                                                                        
  Accou…                                                                        
  recei…             -53,122        -30,002              -17,417       -14,100  
  net                                                                           
  Inven…              -4,955        -15,057              -10,026       -13,943  
  Prepa…                                                                        
  expen…                                                                        
  and                  1,722         -6,693                  936        -5,653  
  other                                                                         
  curre…                                                                        
  assets                                                                        
  Arbit…                                                                        
  award                    —              —              -30,329             —  
  recei…                                                                        
  Conne…                                                                        
  device             -30,997         -4,683              -49,222       -10,643  
  costs                                                                         
  Defer…             -20,748         -9,820              -32,305       -16,255  
  commi…                                                                        
  Other                4,069            194               -2,954           181  
  assets                                                                        
  Accou…                                                                        
  payab…                                                                        
  and                 34,274         16,004                8,852       -15,232  
  other                                                                         
  liabi…                                                                        
  Defer…              21,793         33,290               38,289        53,900  
  reven…                                                                        
  Opera…                                                                        
  lease                   33            295                   64           715  
  liabi…                                                                        
  Net                                                                           
  cash                                                                          
  provi…              73,524         50,161              154,937       102,773  
  by                                                                            
  opera…                                                                        
  activ…                                                                        
  Inves…                                                                        
  activ…                                                                        
  Purch…                                                                        
  of                                                                            
  prope…              -8,783         -5,969              -17,019       -12,889  
  and                                                                           
  equip…                                                                        
  Purch…                                                                        
  of                 -220,9…       -248,805             -578,487       -421,9…  
  inves…                                                                        
  Proce…                                                                        
  from                                                                          
  matur…                                                                        
  and                249,317        186,618              465,888       348,590  
  redem…                                                                        
  of                                                                            
  inves…                                                                        
  Other                                                                         
  inves…                 100              —                  100          -200  
  activ…                                                                        
  Net                                                                           
  cash                                                                          
  provi…                                                                        
  by                  19,670        -68,156             -129,518       -86,445  
  (used                                                                         
  in)                                                                           
  inves…                                                                        
  activ…                                                                        
  Finan…                                                                        
  activ…                                                                        
  Proce…                                                                        
  from                                                                          
  issua…                                                                        
  of                                                                            
  common              17,117         18,715               17,128        18,737  
  stock                                                                         
  from                                                                          
  equity                                                                        
  compe…                                                                        
  plans                                                                         
  Taxes                                                                         
  paid                                                                          
  for                                                                           
  net                                                                           
  share              -36,027              —              -70,372             —  
  settl…                                                                        
  of                                                                            
  equity                                                                        
  awards                                                                        
  Other                                                                         
  finan…                 -74           -316                 -171          -694  
  activ…                                                                        
  Net                                                                           
  cash                                                                          
  provi…                                                                        
  by                 -18,984         18,399              -53,415        18,043  
  (used                                                                         
  in)                                                                           
  finan…                                                                        
  activ…                                                                        
  Effect                                                                        
  of                                                                            
  forei…                                                                        
  excha…                                                                        
  rate                                                                          
  chang…                                                                        
  on                  -1,916            219               -2,308         1,344  
  cash,                                                                         
  cash                                                                          
  equiv…                                                                        
  and                                                                           
  restr…                                                                        
  cash                                                                          
  Net                                                                           
  incre…                                                                        
  (decr…                                                                        
  in                                                                            
  cash,               72,294            623              -30,304        35,715  
  cash                                                                          
  equiv…                                                                        
  and                                                                           
  restr…                                                                        
  cash                                                                          
  Cash,                                                                         
  cash                                                                          
  equiv…                                                                        
  and                                                                           
  restr…             222,245        280,886              324,843       245,794  
  cash,                                                                         
  begin…                                                                        
  of                                                                            
  period                                                                        
  Cash,                                                                         
  cash                                                                          
  equiv…                                                                        
  and       $        294,539    $   281,509    $         294,539    $  281,509  
  restr…                                                                        
  cash,                                                                         
  end of                                                                        
  period                                                                        
                                                                                
                                       8                                        
                                                                                
                                  SAMSARA INC.                                  
                                                                                
                                                                                
          RECONCILIATION BETWEEN GAAP AND NON-GAAP FINANCIAL MEASURES           
                                                                                
          (In thousands, except percentages, share and per share data)          
                                                                                
                                  (Unaudited)                                   
                                                                                
          Three  Augu…          August        Six    August          Augu…      
          Mont…     1,              2,        Mont…      1,             2,      
          Ended   2026            2025        Ended    2026           2025      
 ────────────────────────────────────────────────────────────────────────────── 
  Tot…                                                                          
  rev…                                                                          
  and                                                                           
  rev…                                                                          
  gro…                                                                          
  rec…                                                                          
  GAAP    $      508,…       $  391,4…        $      987,2…       $  758,…      
  rev…                                                                          
  Add:                                                                          
  Con…                                                                          
  cur…           -2,2…               —               -7,423              —      
  adj…                                                                          
  Rev…                                                                          
  adj…                                                                          
  for     $      506,…       $  391,4…        $      979,8…       $  758,…      
  con…                                                                          
  cur…                                                                          
  GAAP                                                                          
  rev…              30  %           30  %                30  %          31  %   
  gro…                                                                          
  Rev…                                                                          
  gro…                                                                          
  in                29  %           30  %                29  %          31  %   
  con…                                                                          
  cur…                                                                          
  Gro…                                                                          
  pro…                                                                          
  and                                                                           
  gro…                                                                          
  mar…                                                                          
  rec…                                                                          
  GAAP                                                                          
  gro…    $      392,…       $  300,9…        $      753,7…       $  584,…      
  pro…                                                                          
  Add:                                                                          
  Sto…                                                                          
  com…           5,417           4,713               10,582          9,074      
  exp…                                                                          
  cha…                                                                          
  Non…                                                                          
  gro…    $      397,…       $  305,6…        $      764,3…       $  593,…      
  pro…                                                                          
  GAAP                                                                          
  gro…              77  %           77  %                76  %          77  %   
  mar…                                                                          
  Non…                                                                          
  gro…              78  %           78  %                77  %          78  %   
  mar…                                                                          
  Ope…                                                                          
  inc…                                                                          
  (lo…                                                                          
  and                                                                           
  ope…                                                                          
  mar…                                                                          
  rec…                                                                          
  GAAP                                                                          
  inc…                                                                          
  (lo…    $      4,875       $  -26,6…        $      12,070       $  -59,…      
  from                                                                          
  ope…                                                                          
  Add:                                                                          
  Sto…                                                                          
  com…           101,…          86,317               184,9…          170,…      
  exp…                                                                          
  cha…                                                                          
  Non…                                                                          
  ope…    $      105,…       $  59,698        $      196,9…       $  110,…      
  inc…                                                                          
  GAAP                                                                          
  ope…               1  %           (7  %)                1  %          (8  %)  
  mar…                                                                          
  Non…                                                                          
  ope…              21  %           15  %                20  %          15  %   
  mar…                                                                          
  Net                                                                           
  inc…                                                                          
  (lo…                                                                          
  rec…                                                                          
  GAAP                                                                          
  net     $      16,2…       $  -16,8…        $      60,750       $  -38,…      
  inc…                                                                          
  (lo…                                                                          
  Add:                                                                          
  Sto…                                                                          
  com…           101,…          86,317               184,9…          170,…      
  exp…                                                                          
  cha…                                                                          
  Leg…                                                                          
  gain                                                                          
  from               —               —               -30,3…              —      
  arb…                                                                          
  awa…                                                                          
  Non…                                                                          
  net     $      117,…       $  69,517        $      215,3…       $  131,…      
  inc…                                                                          
                                                                                
                                       9                                        
                                                                                
                                  SAMSARA INC.                                  
                                                                                
                                                                                
          RECONCILIATION BETWEEN GAAP AND NON-GAAP FINANCIAL MEASURES           
                                                                                
          (In thousands, except percentages, share and per share data)          
                                                                                
                                  (Unaudited)                                   
                                                                                
            Three                              Six                              
            Months    August         August    Months     August        August  
            Ended    1, 2026        2, 2025    Ended     1, 2026       2, 2025  
 ────────────────────────────────────────────────────────────────────────────── 
  Net                                                                           
  income                                                                        
  (loss)                                                                        
  per                                                                           
  share,                                                                        
  basic                                                                         
  and                                                                           
  dilut…                                                                        
  recon…                                                                        
  GAAP                                                                          
  net                                                                           
  income                                                                        
  (loss)    $           0.03    $     -0.03    $            0.10    $    -0.07  
  per                                                                           
  share,                                                                        
  basic                                                                         
  Total                                                                         
  impact                                                                        
  on net                                                                        
  income                                                                        
  (loss)                                                                        
  per                   0.17           0.15                 0.27          0.30  
  share,                                                                        
  basic,                                                                        
  from                                                                          
  non-G…                                                                        
  adjus…                                                                        
  Non-G…                                                                        
  net                                                                           
  income    $           0.20    $      0.12    $            0.37    $     0.23  
  per                                                                           
  share,                                                                        
  basic                                                                         
  GAAP                                                                          
  net                                                                           
  income                                                                        
  (loss)    $           0.03    $     -0.03    $            0.10    $    -0.07  
  per                                                                           
  share,                                                                        
  dilut…                                                                        
  Total                                                                         
  impact                                                                        
  on net                                                                        
  income                                                                        
  (loss)                                                                        
  per                   0.17           0.15                 0.27          0.30  
  share,                                                                        
  dilut…                                                                        
  from                                                                          
  non-G…                                                                        
  adjus…                                                                        
  Non-G…                                                                        
  net                                                                           
  income    $           0.20    $      0.12    $            0.37    $     0.23  
  per                                                                           
  share,                                                                        
  dilut…                                                                        
  Weigh…                                                                        
  shares                                                                        
  used                                                                          
  in                                                                            
  compu…                                                                        
  GAAP                                                                          
  and                584,13…       571,738…             582,985…       569,73…  
  non-G…                                                                        
  net                                                                           
  income                                                                        
  (loss)                                                                        
  per                                                                           
  share,                                                                        
  basic                                                                         
  Weigh…                                                                        
  shares                                                                        
  used                                                                          
  in                                                                            
  compu…                                                                        
  GAAP               590,46…       571,738…             589,069…       569,73…  
  net                                                                           
  income                                                                        
  (loss)                                                                        
  per                                                                           
  share,                                                                        
  dilut…                                                                        
  Weigh…                                                                        
  shares                                                                        
  used                                                                          
  in                                                                            
  compu…                                                                        
  non-G…             590,46…       585,391…             589,069…       584,09…  
  net                                                                           
  income                                                                        
  per                                                                           
  share,                                                                        
  dilut…                                                                        
                                                                                
                                       10                                       
                                                                                
                                  SAMSARA INC.                                  
                                                                                
                                                                                
          RECONCILIATION BETWEEN GAAP AND NON-GAAP FINANCIAL MEASURES           
                                                                                
          (In thousands, except percentages, share and per share data)          
                                                                                
                                  (Unaudited)                                   
                                                                                
           Three   Augu…          August       Six    August          Augu…     
           Months     1,              2,       Mont…      1,             2,     
           Ended    2026            2025       Ended    2026           2025     
 ────────────────────────────────────────────────────────────────────────────── 
  Free                                                                          
  cash                                                                          
  flow                                                                          
  and                                                                           
  free                                                                          
  cash                                                                          
  flow                                                                          
  marg…                                                                         
  reco…                                                                         
  Net                                                                           
  cash                                                                          
  prov…    $       73,5…       $  50,161       $      154,9…       $  102,…     
  by                                                                            
  oper…                                                                         
  acti…                                                                         
  Purc…                                                                         
  of                                                                            
  prop…            -8,7…          -5,969              -17,0…          -12,…     
  and                                                                           
  equi…                                                                         
  Free                                                                          
  cash     $       64,7…       $  44,192       $      137,9…       $  89,8…     
  flow                                                                          
  Net                                                                           
  cash                                                                          
  prov…                                                                         
  by                  14  %           13  %               16  %          14  %  
  oper…                                                                         
  acti…                                                                         
  marg…                                                                         
  Free                                                                          
  cash                13  %           11  %               14  %          12  %  
  flow                                                                          
  marg…                                                                         
                                                                                
__________

(1) To facilitate comparability across periods, revenue and revenue growth are
adjusted for constant currency by excluding the effect of foreign currency rate
fluctuations.

(2) Stock-based compensation expense-related charges were included in the
following line items of our condensed consolidated statements of operations and
comprehensive income (loss) as follows:
                                                                                
            Three                              Six                              
            Months    August         August    Months     August        August  
            Ended    1, 2026        2, 2025    Ended     1, 2026       2, 2025  
 ────────────────────────────────────────────────────────────────────────────── 
  Cost                                                                          
  of        $          5,417    $     4,713    $          10,582    $    9,074  
  reven…                                                                        
  Resea…                                                                        
  and                 37,498         31,346               69,608        60,902  
  devel…                                                                        
  Sales                                                                         
  and                 29,447         25,345               54,067        50,925  
  marke…                                                                        
  Gener…                                                                        
  and                 28,744         24,913               50,666        49,742  
  admin…                                                                        
  Total                                                                         
  stock…                                                                        
  compe…    $        101,106    $    86,317    $         184,923    $  170,643  
  expen…                                                                        
  charg…                                                                        
                                                                                
(3) On February 3, 2026, in the breach of contract, fraud, unfair competition,
and false advertising arbitration matter between Samsara Inc. and Motive
Technologies, Inc., an arbitration award was rendered in favor of Samsara. As a
result of the arbitration award, Samsara recognized a gain of $30.3 million
during the six months ended August 1, 2026 .

(4) There were no material income tax effects on our non-GAAP adjustments for
all periods presented.

(5) For each period in which we had net income, diluted net income per share is
calculated using weighted-average number of shares of common stock outstanding
during the period, adjusted for dilutive potential shares that were assumed
outstanding during the period.

(6) Stock-based compensation expense-related charges included amortization of
capitalized stock-based compensation expense of approximately $1.5 million and
$2.8 million for the three and six months ended August 1, 2026, respectively,
and approximately $0.8 million and $1.6 million for the three and six months
ended August 2, 2025, respectively, which was initially capitalized as internal-
use software or cloud computing arrangements. Stock-based compensation expense-
related charges also included approximately $3.3 million and $8.3 million of
employer taxes on employee equity transactions for the three and six months
ended August 1, 2026, respectively, and approximately $4.4 million and $10.9
million of employer taxes on employee equity transactions for the three and six
months ended August 2, 2025, respectively.
                                       11                                       

Sources

The 8-K item 2.02 filings (SEC EDGAR) and their EX-99 exhibits: the results release and, when filed, prepared remarks or the call transcript.

Also

Said vs did: the targets in these releases against what was then reported. Filings: every filing.

Work with it

Excel workbook · CSV. Google Sheet that stays up to date: paste =IMPORTDATA("https://tickdelta.com/company/IOT/export.csv") into a cell.

Next:Presentations
Esc

Type a ticker such as AAPL, a name, an investor such as Buffett, or a topic such as tariffs. ↑ ↓ to move, Enter to open.