IPG Photonics Corp IPGP
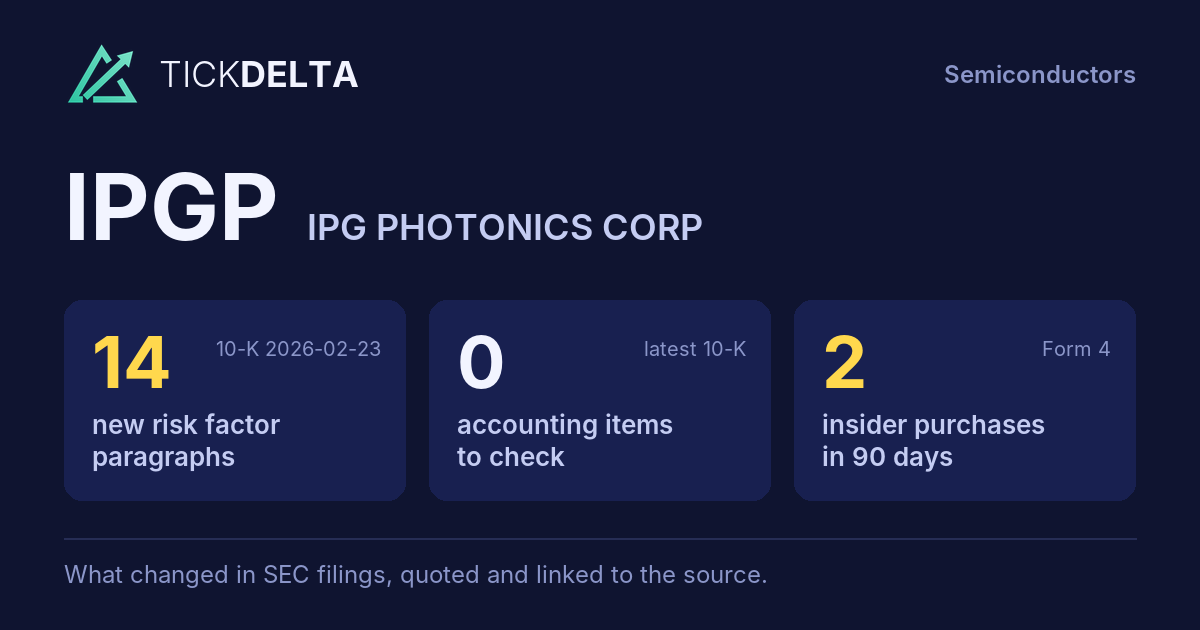
The biggest changes in the 10-K filed Feb 23, 2026, in management's words
10-K, Item 7This fiscal year against the last, and the sentences in the MD&A where management explains each change. Tickdelta picks sentences that name the line, a direction and a cause. It does not write explanations of its own.
Operating margin
Big change, FY to Dec 31, 2025 vs Dec 31, 2024
“In addition, the increase in research and development expense was also due to an increase of $3.3 million in consultant fees, and an increase of $1.4 million in materials expense, partially offset by a decrease of $0.9 million in premises expense, a decrease of $0.7 million in lease expense, a decrease of $0.6 million in other R&D expenses, and an increase of $0.4 million in grant income.”
Read it in the 10-K
Cash from operations
Big change, FY to Dec 31, 2025 vs Dec 31, 2024
“Net cash provided by operating activities decreased by $172.6 million to $75.3 million in 2025 from $247.9 million in 2024 primarily due to a decrease in net income after adding back non-cash expenses and an increase in cash used by working capital.”
Read it in the 10-K
“The decrease in cash flow from operating activities in 2025 primarily resulted from:”
Read it in the 10-K
Gross margin
Big change, FY to Dec 31, 2025 vs Dec 31, 2024
“Our gross margin from products on new manufacturing lines can be lower due to production inefficiencies, lower yields and high scrap costs.”
Read it in the 10-K
“Additionally, the increase in gross margin was due to a decrease in unabsorbed manufacturing costs of $20.9 million, partially offset by an increase in cost of products sold of $4.3 million, primarily as a result of higher product costs due to product and geographic mix, and import duties driven by tariffs, partially offset by lower inventory provisions.”
Read it in the 10-K
Revenue
Change, FY to Dec 31, 2025 vs Dec 31, 2024
“(2)Revenue in Europe declined year over year primarily due to lower sales in cutting and welding applications and the impact of the divestiture of our Russian operations, partially offset by increased sales in cleaning applications, driven largely by the cleanLASER acquisition, as well as increased sales in additive manufacturing.”
Read it in the 10-K
“Materials processing sales accounted for 85.7% of total revenue and increased 0.3% year over year, as a result of increased sales in cleaning, mainly due to the cleanLASER acquisition, additive manufacturing, micromachining, drilling, and annealing, partially offset by decreased sales in cutting, service and parts, and other material processing applications.”
Read it in the 10-K
What management said, year by year
The cause given in each 10-K, 2 fiscal years, newest first · MD&A (Item 7)
Each bar is how the line changed that year (from the same 10-K's XBRL). Under it, the sentence in that year's MD&A that names the line, a direction and a cause, word for word. A year with no sentence says so.
Revenue
2 of 2 years explained-
FY 2025 +2.7%
“(2)Revenue in Europe declined year over year primarily due to lower sales in cutting and welding applications and the impact of the divestiture of our Russian operations, partially offset by increased sales in cleaning applications, driven largely by the cleanLASER acquisition, as well as increased sales in additive manufacturing.”
Read it in the FY 2025 10-K“Materials processing sales accounted for 85.7% of total revenue and increased 0.3% year over year, as a result of increased sales in cleaning, mainly due to the cleanLASER acquisition, additive manufacturing, micromachining, drilling, and annealing, partially offset by decreased sales in cutting, service and parts, and other material processing applications.”
Read it in the FY 2025 10-K -
FY 2024 -24.1%
“Sales for materials processing applications decreased primarily due to lower sales of high power CW lasers, pulsed lasers, and other laser products and services.”
Read it in the FY 2024 10-K“High power CW laser sales decreased due to lower sales for cutting and welding applications, and were primarily impacted by softer industrial demand and a decrease in e-mobility investments.”
Read it in the FY 2024 10-K
Gross margin
2 of 2 years explained-
FY 2025 +3.4 pts
“Our gross margin from products on new manufacturing lines can be lower due to production inefficiencies, lower yields and high scrap costs.”
Read it in the FY 2025 10-K“Additionally, the increase in gross margin was due to a decrease in unabsorbed manufacturing costs of $20.9 million, partially offset by an increase in cost of products sold of $4.3 million, primarily as a result of higher product costs due to product and geographic mix, and import duties driven by tariffs, partially offset by lower inventory provisions.”
Read it in the FY 2025 10-K -
FY 2024 -7.5 pts
“Our gross margin from products on new manufacturing lines can be lower due to production inefficiencies, lower yields and high scrap costs.”
Read it in the FY 2024 10-K“Gross margin decreased mainly due to increased provisions for excess and obsolete inventory, specifically additional inventory provisions of $29.5 million attributed to items previously considered safety stock and items that became technologically obsolete.”
Read it in the FY 2024 10-K
Operating margin
1 of 2 years explained-
FY 2025 +22.6 pts
“In addition, the increase in research and development expense was also due to an increase of $3.3 million in consultant fees, and an increase of $1.4 million in materials expense, partially offset by a decrease of $0.9 million in premises expense, a decrease of $0.7 million in lease expense, a decrease of $0.6 million in other R&D expenses, and an increase of $0.4 million in grant income.”
Read it in the FY 2025 10-K -
FY 2024 -39.3 pts
The FY 2024 MD&A has no sentence that names a cause for this change.
Cash from operations
2 of 2 years explained-
FY 2025 -69.6%
“Net cash provided by operating activities decreased by $172.6 million to $75.3 million in 2025 from $247.9 million in 2024 primarily due to a decrease in net income after adding back non-cash expenses and an increase in cash used by working capital.”
Read it in the FY 2025 10-K“The decrease in cash flow from operating activities in 2025 primarily resulted from:”
Read it in the FY 2025 10-K -
FY 2024 -16.2%
“Net cash provided by operating activities decreased by $48.1 million to $247.9 million in 2024 from $296.0 million in 2023 primarily due to a decrease in net income after adding back non-cash expenses, partially offset by an increase in cash provided by working capital.”
Read it in the FY 2024 10-K“The decrease in cash flow from operating activities in 2024 primarily resulted from:”
Read it in the FY 2024 10-K
Changes are computed from the XBRL figures in the same 10-K. Hover a number to see the line item. Open the 10-K
Sources
The Management's Discussion and Analysis (Item 7) of the latest 10-K, quoted word for word; the changes are computed from the same 10-K's XBRL.
Also
Financials: the numbers year by year.
Work with it
Excel workbook · CSV. Google Sheet that stays up to date: paste =IMPORTDATA("https://tickdelta.com/company/IPGP/export.csv") into a cell.