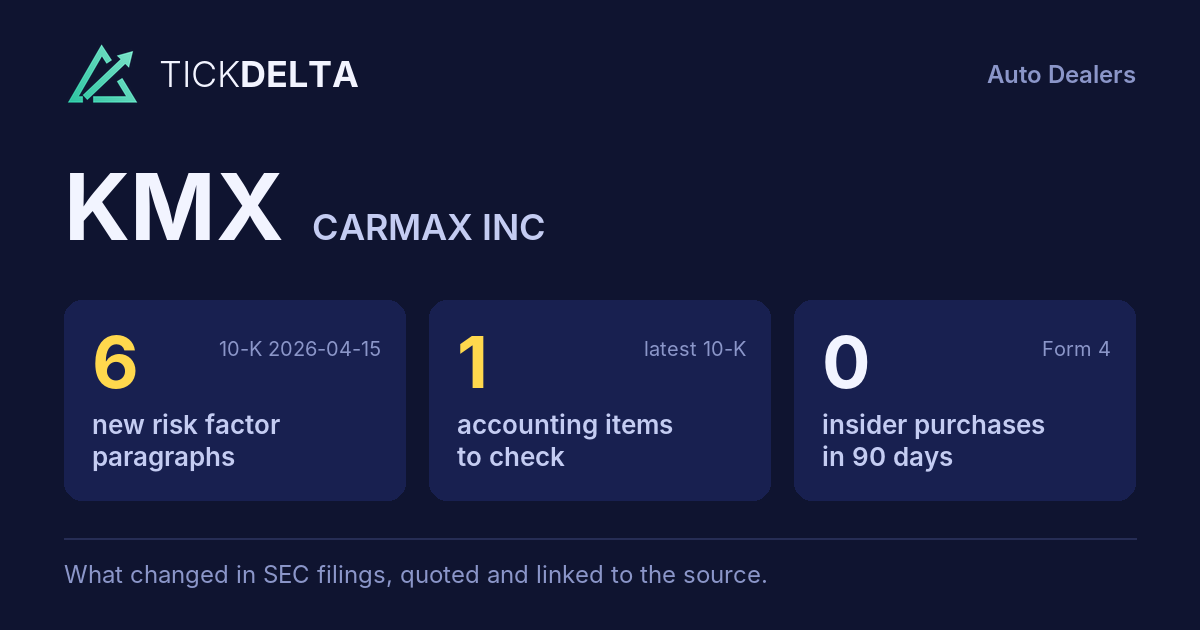
Screener / SEC EDGAR /CIK 0001170010 /10-K filed Apr 15, 2026, compared with Apr 11, 2025 /Numbers from the XBRL of the 10-Ks
NYSE Consumer discretionary · Auto Dealers

Carmax Inc KMX

Compare with peers Embed
Earnings releases

Latest results release: Sep 29, 2026

8-K item 2.02, exhibit 99

What KMX's management wrote with each quarter's results: the press release and, when the company files them, its prepared remarks or the call transcript. The call itself is not filed with SEC, so most quarters have the release only.

Adjusted vs GAAP earnings per share

In the company's own words · read from each release, never computed

In its release of Apr 14, 2026, KMX reported −$0.85 per share under GAAP and $0.34 on its own adjusted basis.

ReleaseGAAP EPSAdjusted EPSGap
Apr 14, 2026 -0.85 0.34 –
The company's words, latest release
Net (loss) earnings per diluted share of ($0.85) versus $0.58 a year ago, as the quarter was negatively impacted by $0.99 related to a non-cash goodwill impairment and $0.20 of restructuring charges. release
Excluding these two items, adjusted net earnings per diluted share was $0.34 this quarter (2) . release

Both numbers are read from the words of each release (usually the highlights), never computed by us; hover a number for its sentence. Quarters where the release gives them only in a table are not shown. The company decides what "adjusted" leaves out; the full reconciliation is in the release.

Read and search

Every release, in full · linked to sec.gov

Press release Sep 29, 2026 · EX-99.1

CARMAX REPORTS SECOND QUARTER FISCAL 2027 RESULTS

Open on SEC

Richmond, Va., September 29, 2026 – CarMax, Inc. (NYSE:KMX) today reported results for the second quarter ended August 31, 2026.

• Retail used unit sales increased 13.8% and comparable store used unit sales increased 13.0%; g ross profit per retail used unit of $2,105 declined by $111, reflecting the continuation of pricing actions implemented to support an improved sales trend.

• Wholesale units increased 15.9%; gross profit per wholesale unit of $858 , a decrease of $135.

• Extended Protection Plans (EPP) margin per retail unit of $623, an increase of $46 per unit.

• SG&A expenses increased 4.6% to $628.6 million, while leveraging robustly by $157, or 8.8%, per total unit. Ongoing cost reduction efforts were offset as we annualized over materially reduced incentive-based compensation and by variable costs tied to strong unit growth.

• CarMax Auto Finance (CAF) income increased 32.1% to $135.6 million. In regard to the continued execution of our full spectrum growth strategy, CAF financed 22% of Tier 2 volume versus 10% a year ago and was the largest lender in this space.

• Net earnings per diluted share of $1.16 versus $0.64 a year ago, an increase of 81.3%.

• CarMax will host a virtual Strategic Update on November 3 rd at 8:00 a.m. ET where we will provide details on our strategy for growth, key initiatives and milestones.

(1) Comparisons to the prior year’s second quarter unless otherwise stated. -more- CarMax, Inc.

“Our strong second quarter results reflect solid execution and early progress against Shift into GEAR, our four-pillar strategy to strengthen CarMax’s core business and return the company to sustained growth,”said Keith Barr, President and Chief Executive Officer. “We delivered 81% EPS growth as we strengthened our price competitiveness, increased Extended Protection Plan margins, expanded CAF’s share of Tier 2 originations, continued to enhance our digital experience, and drove material SG&A leverage. I am confident in our ability to build on this early momentum. We have a clear strategy, a solid foundation, and an exceptional team accelerating our progress to create long-term value for our shareholders.”

Last quarter, we introduced our strategy for growth, which we have named Shift into GEAR. The strategy is built around four pillars designed to place the customer at the center of everything we do with the objective of driving sustainable growth and strong operating performance over time:

• Price competitively across demand cycles while growing saleable inventory and providing customers faster access to our vehicles

• Better connect digital capabilities with in-store experiences to improve conversion and customer satisfaction

• Lower reconditioning costs through technology and operational efficiency while continuing to deliver the high-quality vehicles customers expect from CarMax, enhance our logistics network, and continue to reduce SG&A

CarMax will host a Strategic Update virtually on November 3 rd where details about our strategy for growth, key initiatives and milestones will be provided. Registration details will be available in the days ahead.

Total net revenues rose 19.5% to $7.9 billion compared to the prior year’s second quarter.

Combined retail and wholesale used vehicle unit sales were 387,735 , an increase of 14.7% from the prior year’s second quarter.

Total retail used vehicle unit sales increased 13.8% to 227,391 compared to the prior year’s second quarter. Comparable store used unit sales increased 13.0% from the prior second quarter. Total retail used vehicle revenues increased 19.7% compared with the prior year’s second quarter, driven by the increase in retail used units sold and an increase in average retail selling price of approximately $1,600 per unit or 6.3%.

Total wholesale vehicle unit sales increased 15.9% to 160,344 versus the prior year’s second quarter. Total wholesale revenues increased 18.2% compared with the prior year’s second quarter due to an increase in wholesale units and an increase in average wholesale selling price of $145 per unit or 1.8%.

We bought 310,107 vehicles from consumers and dealers, up 5.9% compared to last year’s second quarter. Of these vehicles, 262,570 were bought from consumers, flat compared to last year’s second quarter, and 47,537 were bought through dealers, an increase of 53.7%. -more- CarMax, Inc.

Other sales and revenues increased by 19.5%, or $34.0 million, compared with the second quarter of fiscal 2026, primarily reflecting an increase in EPP revenues.

Our digital capabilities supported 81% of retail unit sales. Omni sales (2) were 68% and online retail sales (3) accounted for 13% of retail unit sales.

. Total gross profit was $799.5 million , up 11.4% versus last year’s second quarter. Retail used vehicle gross profit increased 8.1% driven by higher volume and partially offset by lower profit per used unit of $2,105. Retail gross profit per unit decreased $111 from last year’s second quarter, reflecting the continuation of pricing actions to support an improved sales trend.

Wholesale vehicle margin of $137.6 million was flat to a year ago with higher volume offset by lower gross profit per unit of $858, down $135 per unit.

Other gross profit was $183.3 million, an increase of 33.1% from last year’s second quarter. EPP margin dollars were up $26.5 million driven by growth in both unit volume and unit margins, up $46 per unit in the second quarter. Service margin increased by $22.0 million, driven primarily by efficiency gains in cost of sales and leverage from unit volume growth.

. Compared with the second quarter of fiscal 2026, SG&A expenses increased 4.6% to $628.6 million , while SG&A per total unit improved by $157, or 8.8% , to $1,621. Ongoing cost reduction efforts were offset as we annualized over materially reduced incentive-based compensation and by variable costs tied to strong unit growth. This increase was partially offset by savings from actions taken to reduce field and corporate payroll as part of our targeted SG&A reductions. We remain on track to achieve targeted SG&A reductions of $200 million in exit rate savings by the end of fiscal 2027.

. (4) CAF income was $135.6 million, up 32.1% from the prior year’s second quarter, driven by a decrease of $28.8 million in the loan loss provision to $113.4 million. During the second quarter of the prior year, we recorded additional provision due to the worsening performance of older vintages at that time, whereas performance this year has been in line with expectations. This was partially offset by provisioning related to Tier 2 originations in the quarter from our full credit spectrum expansion. Additionally, CAF income benefited from a $16.6 million gain on sale of auto loans recorded during the quarter and a $6.1 million increase in servicing fees year-over-year. This was partially offset by impacts from a $1.2 billion year-over-year reduction in outstanding receivables related to the combination of selling the residual interest in two non-prime securitizations and from lower sales during fiscal 2026.

As of August 31, 2026, the allowance for loan losses of $497.3 million was 3.07% of auto loans held for investment, up from 2.95% as of May 31, 2026.

CAF’s total interest margin percentage, which represents the spread between interest and fees charged to consumers and our funding costs, was 6.6% of average auto loans outstanding, consistent with the prior year’s second quarter. After the effect of 3-day payoffs, CAF financed 40.9% of units sold in the current quarter, down from 42.6% in the prior year’s second quarter. Additionally, CAF financed 22% of Tier 2 volume and was the largest lender in this space, reflecting continued execution of our full spectrum growth strategy. CAF’s weighted average contract rate was 11.8% in the quarter, up 60 basis points from last year’s second quarter.

. Given our second quarter performance, continued momentum, and improving leverage, we intend to resume share repurchases at a modest level in the third quarter of this fiscal year. During the second quarter of fiscal 2027, we did not repurchase any shares of common stock pursuant to our share repurchase program. As of August 31, 2026, we had $1.31 billion remaining available for repurchase under the outstanding authorization. -more- CarMax, Inc.

The timing and amount of our share repurchases are at the discretion of management and will depend upon market conditions, our leverage, and our capital needs, among other factors. Our share repurchase program may be modified, suspended or terminated at any time at the discretion of our board of directors.

. Other income was $18.6 million in the second quarter of fiscal 2027 compared with $3.6 million in the second quarter of fiscal 2026. The increase was primarily due to unrealized gains on equity investments recorded during the second quarter of fiscal 2027.

. During the second quarter of fiscal 2027, we opened an offsite auction center and store in Conroe, Texas, and a store in Richland, Washington. Subsequent to the end of the quarter, we opened an additional store in Austin, Texas.

(2) An omni retail unit sale is defined as a sale where customers complete at least one, but not all, of the four activities listed in note (3) below online. An omni retail unit sale also includes additional steps that can be completed online, including pre-qualifying for financing, setting appointments and signing up for notifications of cars coming soon.

(3) An online retail sale is defined as a sale where the customer completes all four of these major transactional activities online: reserving the vehicle; financing the vehicle, if needed; trading-in or opting out of a trade in; and creating an online sales order.

(4) Although CAF benefits from certain indirect overhead expenditures, we have not allocated indirect costs to CAF to avoid making subjective allocation decisions. -more- CarMax, Inc.

(1) Stores are added to the comparable store base beginning in their fourteenth full month of operation. Comparable store calculations include results for a set of stores that were included in our comparable store base in both the current and corresponding prior year periods.

Used Vehicle Financing Penetration by Channel (Before the Impact of 3-day Payoffs) (1)

(1) Calculated as used vehicle units financed for respective channel as a percentage of total used units sold.

(2) Includes CAF’s Tier 2 and Tier 3 loan originations, which represent less than 5% of total used units sold.

(3) Third-party finance providers who generally pay us a fee or to whom no fee is paid.

(5) Represents customers arranging their own financing and customers that do not require financing.

(1) Calculated as a percentage of net sales and operating revenues. -more- CarMax, Inc.

(2) Calculated as category gross profit divided by its respective units sold, except the other category, which is divided by total used units sold.

(2) Excludes compensation and benefits related to reconditioning and vehicle repair service, which are included in cost of sales.

(3) Includes IT expenses, non-CAF bad debt, insurance, preopening and relocation costs, travel, charitable contributions and other administrative expenses. -more- CarMax, Inc.

We will host a conference call for investors at 8:00 a.m. ET today, September 29, 2026 . Domestic investors may access the call at 1-800-225-9448 (international callers dial 1-203-518-9708). The conference I.D. for both domestic and international callers is 3171396. A live webcast of the call will be available on our investor information home page at investors.carmax.com. An investor presentation is also available on the website.

A replay of the webcast will be available on the company’s website at investors.carmax.com through December 16, 2026, or via telephone (for approximately one week) by dialing 1-800-839-1222 (or 1-402-220-0459 for international access) and entering the conference ID 3171396.

We currently plan to release results for the quarter ending November 30th, on December 17, 2026, before the opening of trading on the New York Stock Exchange. We plan to host a conference call for investors at 8:00 a.m. ET on that date. Information on this conference call will be available on our investor information home page at investors.carmax.com in early December 2026.

CarMax, the nation’s largest retailer of used autos, has earned customers’ trust for more than 30 years by leading with integrity, transparency and honesty. CarMax continues to redefine car buying and selling for millions of customers, delivering the easy and confident experience they love. CarMax has more than 255 store locations, approximately 28,000 associates, and is proud to have been recognized for 22 consecutive years as one of the Fortune 100 Best Companies to Work For®. During the fiscal year that ended February 28, 2026, CarMax sold approximately 780,000 used vehicles and 540,000 wholesale vehicles at its auctions. In addition, CarMax Auto Finance originated $8 billion in auto loans during fiscal 2026, adding to its $16 billion portfolio. CarMax is committed to helping its communities thrive and reducing the environmental footprint of its operations. Learn more in the 2026 Responsibility Report. For more information, visit www.carmax.com.

We caution readers that the statements contained in this release that are not statements of historical fact, including statements about our future business plans, operations, challenges, opportunities or prospects, including without limitation any statements or factors regarding our recent leadership transition, strategy for growth, operating capacity, sales, inventory, market share, financial and operational targets and goals, revenue, margins, expenses, liquidity, loan originations, capital expenditures, share repurchase plans, debt obligations or earnings, are forward-looking statements made pursuant to the safe harbor provisions of the Private Securities Litigation Reform Act of 1995. You can identify these forward-looking statements by the use of words such as “anticipate,” “believe,” “commit,” “could,” “enable,” “encourage,” “estimate,” “expect,” “focus on,” “intend,” “may,” “on track,” “outlook,” “plan,” “position,” “predict,” “should,” “target,” “will” and other variations of these words or similar expressions, whether in the negative or affirmative. Such forward-looking statements are based upon management’s current knowledge, expectations and assumptions and involve risks and uncertainties that could cause actual results to differ materially from anticipated results. Among the factors that could cause actual results and outcomes to differ materially from those contained in the forward-looking statements are the following: -more- CarMax, Inc.

• Changes in the competitive landscape and/or our failure to successfully adjust to such changes.

• Changes in general or regional U.S. economic conditions, including economic downturns, inflationary pressures, fluctuating interest rates, tariffs, the effect of trade policies or related uncertainties, and the potential impact of international events (including the conflict in the Middle East).

• Changes in the availability or cost of capital and working capital financing, including changes related to the asset-backed securitization market.

• Events that damage our reputation or harm the perception of the quality of our brand.

• A reduction in the availability of or access to sources of inventory or a failure to expeditiously liquidate inventory.

• The failure or inability to realize the expected benefits and objectives associated with our strategy for growth.

• Our inability to realize the benefits associated with our sales platform or initiatives designed to leverage evolving technologies, including AI.

• Factors related to geographic and sales growth, including the inability to effectively manage our growth.

• Our inability to recruit, develop and retain associates and maintain positive associate relations.

• The loss of key associates from our store, regional or corporate management teams, the failure to effectively execute key executive succession plans, disruptions associated with leadership transitions, or a significant increase in labor costs.

• Changes in economic conditions or other factors that result in greater credit losses for CAF’s portfolio of auto loans than anticipated.

• The failure or inability to realize the benefits associated with our strategic investments.

• Changes in consumer credit availability provided by our third-party finance providers.

• Changes in the availability of extended protection plan products from third- party providers.

• The performance of the third-party vendors we rely on for key components of our business.

• The inaccuracy of estimates and assumptions used in the preparation of our financial statements, or the effect of new accounting requirements or changes to U.S. generally accepted accounting principles.

• The failure or inability to meet our environmental goals or satisfy related disclosure requirements.

• Security breaches or other events that result in the misappropriation, loss or other unauthorized disclosure of confidential customer, associate or corporate information.

• Factors related to the regulatory and legislative environment in which we operate.

• The effect of evolving regulations, disclosure requirements, standards and expectations relating to environmental, social and governance matters.

For more details on factors that could affect expectations, see our Annual Report on Form 10-K for the fiscal year ended February 28, 2026, and our quarterly or current reports as filed with or furnished to the U.S. Securities and Exchange Commission. Our filings are publicly available on our investor information home page at investors.carmax.com. Requests for information may also be made to the Investor Relations Department by email to [email protected] or by calling (804) 747-0422 x7865. We undertake no obligation to update or revise any forward-looking statements after the date they are made, whether as a result of new information, future events or otherwise. -more- CarMax, Inc.

(1) Percents are calculated as a percentage of net sales and operating revenues and may not total due to rounding. -more- CarMax, Inc.

(In thousands) Six Months Ended OPERATING August 31 ACTIVITIES: 2026 2025 ────────────────────────────────────────────────────────────────────────────── Net earnings $ 350,914 $ 305,759 Adjustments to reconcile net earnings to net cash provided by operating activities: Depreciation and 188,098 163,715 amortization Share-based compensation 74,304 71,255 expense Provision for loan 208,975 243,904 losses Provision for cancellation 53,315 41,897 reserves Deferred income tax -12,620 42,424 (benefit) provision Proceeds from sale 579,907 — of auto loans Other -39,899 1,393 Net (increase) decrease in: Accounts -19,484 15,177 receivable, net Auto loans held for -106,541 -921,928 sale Inventory 282,224 785,052 Other current 28,762 6,331 assets Auto loans held for -564,434 612,649 investment, net Other assets -17,318 -13,889 Net decrease in: Accounts payable, accrued expenses and other current liabilities and accrued income -51,562 -230,470 taxes Other liabilities -54,118 -38,232 NET CASH PROVIDED BY OPERATING 900,523 1,085,037 ACTIVITIES INVESTING ACTIVITIES: Capital -180,442 -268,204 expenditures Proceeds from disposal of 253 348 property and equipment Purchases of -3,373 -5,765 investments Sales and returns 2,780 1,155 of investments Principal payments received on 10,524 — beneficial interests NET CASH USED IN INVESTING -170,258 -272,466 ACTIVITIES FINANCING ACTIVITIES: Proceeds from issuances of 3,073,100 87,000 long-term debt Payments on -3,621,987 -94,955 long-term debt Cash paid for debt -11,162 -13,279 issuance costs Payments on finance -8,442 -7,105 lease obligations Issuances of non-recourse notes 6,742,859 6,848,169 payable Payments on non-recourse notes -6,849,158 -6,911,012 payable Repurchase and retirement of -2,621 -384,873 common stock Equity issuances 83 8,349 NET CASH USED IN FINANCING -677,328 -467,706 ACTIVITIES Increase in cash, cash equivalents, 52,937 344,865 and restricted cash Cash, cash equivalents, and restricted 862,850 960,310 cash at beginning of year CASH, CASH EQUIVALENTS, AND RESTRICTED $ 915,787 $ 1,305,175 CASH AT END OF PERIOD

Full text with the tables
                                                                                
               CARMAX REPORTS SECOND QUARTER FISCAL 2027 RESULTS                
                                                                                
            Announces plans to resume share repurchases in Q3 FY ‘27            
                                                                                
                Company to host Strategic Update on November 3rd                
                                                                                
Richmond, Va., September 29, 2026 – CarMax, Inc. (NYSE:KMX) today reported
results for the second quarter ended August 31, 2026.
                                                                                
  Second Quarter Highlights: (1)                                                
                                                                                
• Total net revenues rose 19.5% to $7.9 billion.

• Combined retail and wholesale unit sales of 387,735 , an increase of 14.7% .

• Retail used unit sales increased 13.8% and comparable store used unit sales
increased 13.0%; g ross profit per retail used unit of $2,105 declined by $111,
reflecting the continuation of pricing actions implemented to support an
improved sales trend.

• Wholesale units increased 15.9%; gross profit per wholesale unit of $858 , a
decrease of $135.

• Extended Protection Plans (EPP) margin per retail unit of $623, an increase of
$46 per unit.

• Bought 310,107 vehicles from consumers and dealers, an increase of 5.9%.

• SG&A expenses increased 4.6% to $628.6 million, while leveraging robustly by
$157, or 8.8%, per total unit. Ongoing cost reduction efforts were offset as we
annualized over materially reduced incentive-based compensation and by variable
costs tied to strong unit growth.

• CarMax Auto Finance (CAF) income increased 32.1% to $135.6 million. In regard
to the continued execution of our full spectrum growth strategy, CAF financed
22% of Tier 2 volume versus 10% a year ago and was the largest lender in this
space.

• Net earnings per diluted share of $1.16 versus $0.64 a year ago, an increase
of 81.3%.

• Plan to resume share repurchases in the third fiscal quarter of this year.

• CarMax will host a virtual Strategic Update on November 3 rd at 8:00 a.m. ET
where we will provide details on our strategy for growth, key initiatives and
milestones.

(1) Comparisons to the prior year’s second quarter unless otherwise stated.
                                     -more-                                     
CarMax, Inc.

Page 2 of 14
                                                                                
  CEO Commentary                                                                
                                                                                
:

“Our strong second quarter results reflect solid execution and early progress
against Shift into GEAR, our four-pillar strategy to strengthen CarMax’s core
business and return the company to sustained growth,”said Keith Barr, President
and Chief Executive Officer. “We delivered 81% EPS growth as we strengthened our
price competitiveness, increased Extended Protection Plan margins, expanded
CAF’s share of Tier 2 originations, continued to enhance our digital experience,
and drove material SG&A leverage. I am confident in our ability to build on this
early momentum. We have a clear strategy, a solid foundation, and an exceptional
team accelerating our progress to create long-term value for our shareholders.”
                                                                                
  Strategy for Growth                                                           
                                                                                
:

Last quarter, we introduced our strategy for growth, which we have named Shift
into GEAR. The strategy is built around four pillars designed to place the
customer at the center of everything we do with the objective of driving
sustainable growth and strong operating performance over time:

1.
                                                                                
  G                                                                             
                                                                                
                                                                                
  reat Offering                                                                 
                                                                                
- give customers every reason to choose CarMax

• Price competitively across demand cycles while growing saleable inventory and
providing customers faster access to our vehicles

2.
                                                                                
  E                                                                             
                                                                                
                                                                                
  asy Experience                                                                
                                                                                
- make it easy to do business with us, both online and in our stores

• Better connect digital capabilities with in-store experiences to improve
conversion and customer satisfaction

3.
                                                                                
  A                                                                             
                                                                                
                                                                                
  dd Value                                                                      
                                                                                
- grow profitability by maximizing value across all aspects of our business

• Grow long-term profitability across our CAF and EPP businesses

4.
                                                                                
  R                                                                             
                                                                                
                                                                                
  un Lean                                                                       
                                                                                
- unlock efficiencies to enable a great offering

• Lower reconditioning costs through technology and operational efficiency while
continuing to deliver the high-quality vehicles customers expect from CarMax,
enhance our logistics network, and continue to reduce SG&A

CarMax will host a Strategic Update virtually on November 3 rd where details
about our strategy for growth, key initiatives and milestones will be provided.
Registration details will be available in the days ahead.
                                                                                
  Second Quarter Business Performance Review                                    
                                                                                
:
                                                                                
  Sales                                                                         
                                                                                
                                                                                
  .                                                                             
                                                                                
Total net revenues rose 19.5% to $7.9 billion compared to the prior year’s
second quarter.

Combined retail and wholesale used vehicle unit sales were 387,735 , an increase
of 14.7% from the prior year’s second quarter.

Total retail used vehicle unit sales increased 13.8% to 227,391 compared to the
prior year’s second quarter. Comparable store used unit sales increased 13.0%
from the prior second quarter. Total retail used vehicle revenues increased
19.7% compared with the prior year’s second quarter, driven by the increase in
retail used units sold and an increase in average retail selling price of
approximately $1,600 per unit or 6.3%.

Total wholesale vehicle unit sales increased 15.9% to 160,344 versus the prior
year’s second quarter. Total wholesale revenues increased 18.2% compared with
the prior year’s second quarter due to an increase in wholesale units and an
increase in average wholesale selling price of $145 per unit or 1.8%.

We bought 310,107 vehicles from consumers and dealers, up 5.9% compared to last
year’s second quarter. Of these vehicles, 262,570 were bought from consumers,
flat compared to last year’s second quarter, and 47,537 were bought through
dealers, an increase of 53.7%.
                                     -more-                                     
CarMax, Inc.

Page 3 of 14

Other sales and revenues increased by 19.5%, or $34.0 million, compared with the
second quarter of fiscal 2026, primarily reflecting an increase in EPP revenues.

Our digital capabilities supported 81% of retail unit sales. Omni sales (2) were
68% and online retail sales (3) accounted for 13% of retail unit sales.
                                                                                
  Gross Profit                                                                  
                                                                                
. Total gross profit was $799.5 million , up 11.4% versus last year’s second
quarter. Retail used vehicle gross profit increased 8.1% driven by higher volume
and partially offset by lower profit per used unit of $2,105. Retail gross
profit per unit decreased $111 from last year’s second quarter, reflecting the
continuation of pricing actions to support an improved sales trend.

Wholesale vehicle margin of $137.6 million was flat to a year ago with higher
volume offset by lower gross profit per unit of $858, down $135 per unit.

Other gross profit was $183.3 million, an increase of 33.1% from last year’s
second quarter. EPP margin dollars were up $26.5 million driven by growth in
both unit volume and unit margins, up $46 per unit in the second quarter.
Service margin increased by $22.0 million, driven primarily by efficiency gains
in cost of sales and leverage from unit volume growth.
                                                                                
  SG&A                                                                          
                                                                                
. Compared with the second quarter of fiscal 2026, SG&A expenses increased 4.6%
to $628.6 million , while SG&A per total unit improved by $157, or 8.8% , to
$1,621. Ongoing cost reduction efforts were offset as we annualized over
materially reduced incentive-based compensation and by variable costs tied to
strong unit growth. This increase was partially offset by savings from actions
taken to reduce field and corporate payroll as part of our targeted SG&A
reductions. We remain on track to achieve targeted SG&A reductions of $200
million in exit rate savings by the end of fiscal 2027.
                                                                                
  CarMax Auto Finance                                                           
                                                                                
. (4) CAF income was $135.6 million, up 32.1% from the prior year’s second
quarter, driven by a decrease of $28.8 million in the loan loss provision to
$113.4 million. During the second quarter of the prior year, we recorded
additional provision due to the worsening performance of older vintages at that
time, whereas performance this year has been in line with expectations. This was
partially offset by provisioning related to Tier 2 originations in the quarter
from our full credit spectrum expansion. Additionally, CAF income benefited from
a $16.6 million gain on sale of auto loans recorded during the quarter and a
$6.1 million increase in servicing fees year-over-year. This was partially
offset by impacts from a $1.2 billion year-over-year reduction in outstanding
receivables related to the combination of selling the residual interest in two
non-prime securitizations and from lower sales during fiscal 2026.

As of August 31, 2026, the allowance for loan losses of $497.3 million was 3.07%
of auto loans held for investment, up from 2.95% as of May 31, 2026.

CAF’s total interest margin percentage, which represents the spread between
interest and fees charged to consumers and our funding costs, was 6.6% of
average auto loans outstanding, consistent with the prior year’s second quarter.
After the effect of 3-day payoffs, CAF financed 40.9% of units sold in the
current quarter, down from 42.6% in the prior year’s second quarter.
Additionally, CAF financed 22% of Tier 2 volume and was the largest lender in
this space, reflecting continued execution of our full spectrum growth strategy.
CAF’s weighted average contract rate was 11.8% in the quarter, up 60 basis
points from last year’s second quarter.
                                                                                
  Share Repurchase Activity                                                     
                                                                                
. Given our second quarter performance, continued momentum, and improving
leverage, we intend to resume share repurchases at a modest level in the third
quarter of this fiscal year. During the second quarter of fiscal 2027, we did
not repurchase any shares of common stock pursuant to our share repurchase
program. As of August 31, 2026, we had $1.31 billion remaining available for
repurchase under the outstanding authorization.
                                     -more-                                     
CarMax, Inc.

Page 4 of 14

The timing and amount of our share repurchases are at the discretion of
management and will depend upon market conditions, our leverage, and our capital
needs, among other factors. Our share repurchase program may be modified,
suspended or terminated at any time at the discretion of our board of directors.
                                                                                
  Other Income                                                                  
                                                                                
. Other income was $18.6 million in the second quarter of fiscal 2027 compared
with $3.6 million in the second quarter of fiscal 2026. The increase was
primarily due to unrealized gains on equity investments recorded during the
second quarter of fiscal 2027.
                                                                                
  Location Openings                                                             
                                                                                
. During the second quarter of fiscal 2027, we opened an offsite auction center
and store in Conroe, Texas, and a store in Richland, Washington. Subsequent to
the end of the quarter, we opened an additional store in Austin, Texas.

(2) An omni retail unit sale is defined as a sale where customers complete at
least one, but not all, of the four activities listed in note (3) below online.
An omni retail unit sale also includes additional steps that can be completed
online, including pre-qualifying for financing, setting appointments and signing
up for notifications of cars coming soon.

(3) An online retail sale is defined as a sale where the customer completes all
four of these major transactional activities online: reserving the vehicle;
financing the vehicle, if needed; trading-in or opting out of a trade in; and
creating an online sales order.

(4) Although CAF benefits from certain indirect overhead expenditures, we have
not allocated indirect costs to CAF to avoid making subjective allocation
decisions.
                                     -more-                                     
CarMax, Inc.

Page 5 of 14
                                                                                
  Supplemental Financial Information                                            
                                                                                
Amounts and percentage calculations may not total due to rounding.
                                                                                
  Sales Components                                                              
                                                                                
                                                                                
             Th…                                  Six                           
             Mo…                                  Mo…                           
             En…                                  En…                           
  (…         Au…                                  Au…                           
  m…    20…   31    20…         C…            2…   31    2…         C…          
 ────────────────────────────────────────────────────────────────────────────── 
  U…                                                                            
  v…    $    6,…    $    5,…        19…  %    $   12…    $   11…        11…  %  
  s…                                                                            
  W…                                                                            
  v…         1,…         1,…        18…  %        2,…        2,…        16…  %  
  s…                                                                            
  O…                                                                            
  s…                                                                            
  a…                                                                            
  r…                                                                            
  E…                                                                            
  p…         14…         11…        23…  %        27…        24…        11…  %  
  p…                                                                            
  r…                                                                            
  T…                                                                            
  f…         -1…         -0…        -1…  %        -6…        -1…        -3…  %  
  f…                                                                            
  n…                                                                            
  A…                                                                            
  &          36…         37…        -4…  %        72…        74…        -2…  %  
  s…                                                                            
  r…                                                                            
  O…         32…         22…        46…  %        61…        45…        36…  %  
  T…                                                                            
  o…                                                                            
  s…         20…         17…        19…  %        40…        36…        10…  %  
  a…                                                                            
  r…                                                                            
  T…                                                                            
  n…                                                                            
  s…    $    7,…    $    6,…        19…  %    $   15…    $   14…        12…  %  
  a…                                                                            
  o…                                                                            
  r…                                                                            
                                                                                
(1) Excludes intercompany revenues that have been eliminated in consolidation.
                                                                                
  Unit Sales                                                                    
                                                                                
                                                                                
       T…                                   S…                                  
       M…                                   M…                                  
       E…                                   E…                                  
       A…                                   A…                                  
       31                                   31                                  
       2…          2…          C…           2…          2…          C…          
  …          2…          1…        1…  %          4…          4…        6.5  %  
  …                                                                             
  …          1…          1…        1…  %          3…          2…        12…  %  
  …                                                                             
  …          3…          3…        1…  %          7…          7…        8.7  %  
  …                                                                             
                                                                                
                                                                                
  Average Selling Prices                                                        
                                                                                
                                                                                
             Th…                                   S…                           
             Mo…                                   M…                           
             En…                                   E…                           
             Au…                                   A…                           
        20…   31    20…         Ch…           20…  31    20…        Ch…         
 ────────────────────────────────────────────────────────────────────────────── 
  U…    $    27…    $    25…         6…  %    $    2…    $    2…         5…  %  
  v…                                                                            
  W…    $    8,…    $    7,…         1…  %    $    8…    $    7…         3…  %  
  v…                                                                            
                                                                                
                                                                                
  Vehicle Sales Changes                                                         
                                                                                
                                                                                
              Three                                Six                          
             Months                             Months                          
              Ended                              Ended                          
             August                             August                          
                 31                                 31                          
               2026           2025                2026           2025           
  Used                                                                          
  vehic…             13.8  %        -5.4  %              6.5  %         1.8  %  
  units                                                                         
  Used                                                                          
  vehic…             19.7  %        -7.2  %             11.7  %         0.2  %  
  reven…                                                                        
  Whole…                                                                        
  vehic…             15.9  %        -2.2  %             12.0  %        -0.5  %  
  units                                                                         
  Whole…                                                                        
  vehic…             18.2  %        -0.4  %             16.0  %        -0.4  %  
  reven…                                                                        
                                                                                
                                     -more-                                     
CarMax, Inc.

Page 6 of 14
                                                                                
  Comparable Store Used Vehicle Sales Changes                                   
                                                                                
(1)
                                                                                
              Three                                Six                          
             Months                             Months                          
              Ended                              Ended                          
             August                             August                          
                 31                                 31                          
               2026           2025                2026           2025           
  Used                                                                          
  vehic…             13.0  %        -6.3  %              5.6  %         0.9  %  
  units                                                                         
  Used                                                                          
  vehic…             18.9  %        -7.1  %             10.8  %        -0.2  %  
  reven…                                                                        
                                                                                
(1) Stores are added to the comparable store base beginning in their fourteenth
full month of operation. Comparable store calculations include results for a set
of stores that were included in our comparable store base in both the current
and corresponding prior year periods.

Used Vehicle Financing Penetration by Channel (Before the Impact of 3-day
Payoffs) (1)
                                                                                
            Three                                Six                            
           Months                              Mont…                            
            Ended                              Ended                            
           August                              Augu…                            
               31                                 31                            
             2026            2025               2026            2025            
  CAF(…             43.3  %         45.2  %            44.5  %         44.8  %  
  Tier              15.9  %         16.5  %            15.8  %         17.1  %  
  2(3)                                                                          
  Tier               7.6  %          7.3  %             8.3  %          7.7  %  
  3(4)                                                                          
  Othe…             33.2  %         31.0  %            31.4  %         30.4  %  
  Total            100.0  %        100.0  %           100.0  %        100.0  %  
                                                                                
(1) Calculated as used vehicle units financed for respective channel as a
percentage of total used units sold.

(2) Includes CAF’s Tier 2 and Tier 3 loan originations, which represent less
than 5% of total used units sold.

(3) Third-party finance providers who generally pay us a fee or to whom no fee
is paid.

(4) Third-party finance providers to whom we pay a fee.

(5) Represents customers arranging their own financing and customers that do not
require financing.
                                                                                
  Selected Operating Ratios                                                     
                                                                                
                                                                                
           T…                                     …                             
           M…                                     …                             
           E…                                     …                             
  …        A…                                     …                             
  …    2…  31    %…        2…        %…       2…  …    %…       2…       %…     
 ────────────────────────────────────────────────────────────────────────────── 
  …                                                                             
  …                                                                             
  …    $   7…        1…    $   6…        …    $   …        …    $   …        …  
  …                                                                             
  …                                                                             
  …    $   7…        1…    $   7…        …    $   …        …    $   …        …  
  …                                                                             
  …                                                                             
  …    $   1…        1…    $   1…        …    $   …        …    $   …        …  
  …                                                                             
  …                                                                             
  …                                                                             
  …                                                                             
  …    $   6…        8…    $   6…        …    $   …        …    $   …        …  
  …                                                                             
  …                                                                             
  …    $   3…        0…    $   2…        …    $   …        …    $   …        …  
  …                                                                             
  …                                                                             
  …    $   2…        2…    $   1…        …    $   …        …    $   …        …  
  …                                                                             
  …                                                                             
  …    $   1…        2…    $   9…        …    $   …        …    $   …        …  
  …                                                                             
                                                                                
(1) Calculated as a percentage of net sales and operating revenues.
                                     -more-                                     
CarMax, Inc.

Page 7 of 14
                                                                                
  Gross Profit                                                                  
                                                                                
(1)
                                                                                
             Th…                                  Six                           
             Mo…                                  Mo…                           
             En…                                  En…                           
  (…         Au…                                  Au…                           
  m…    20…   31    20…         C…            2…   31    2…         C…          
 ────────────────────────────────────────────────────────────────────────────── 
  U…                                                                            
  v…    $    47…    $    44…        8.1  %    $   98…    $   99…        -1…  %  
  g…                                                                            
  p…                                                                            
  W…                                                                            
  v…         13…         13…        0.2  %        30…        29…        4.5  %  
  g…                                                                            
  p…                                                                            
  O…                                                                            
  g…         18…         13…        33…  %        36…        32…        14…  %  
  p…                                                                            
  T…    $    79…    $    71…        11…  %    $   1,…    $   1,…        2.6  %  
                                                                                
(1) Amounts are net of intercompany eliminations.
                                                                                
  Gross Profit per Unit                                                         
                                                                                
(1)
                                                                                
       T…                                     S…                                
       M…                                     M…                                
       E…                                     E…                                
       A…                                     A…                                
       31                                     31                                
       2…                  2…                 2…                2…              
       $                   $                  $                 $               
       p…                  p…                 p…                p…              
       u…        %…        u…        %…       u…       %…       u…       %…     
 ────────────────────────────────────────────────────────────────────────────── 
  …                                                                             
  …                                                                             
  …    $   2…        7…    $   2…        …    $   …        …    $   …        …  
  …                                                                             
  …                                                                             
  …                                                                             
  …                                                                             
  …                                                                             
  …    $   8…        1…    $   9…        …    $   …        …    $   …        …  
  …                                                                             
  …                                                                             
  …                                                                             
  …                                                                             
  …                                                                             
  …    $   8…        8…    $   6…        …    $   …        …    $   …        …  
  …                                                                             
  …                                                                             
                                                                                
(1) Amounts are net of intercompany eliminations.

(2) Calculated as category gross profit divided by its respective units sold,
except the other category, which is divided by total used units sold.

(3) Calculated as a percentage of its respective sales or revenue.
                                                                                
  SG&A Expenses                                                                 
                                                                                
(1)
                                                                                
  (…                                                                            
  m…                                                                            
  e…                                                                            
  p…    Th…                                   S…                                
  u…    Mo…                                   M…                                
  d…    En…                                   E…                                
  C…    Au…                                   A…                                
  a…    31                                    31                                
  b…    20…         20…         C…            2…         2…         C…          
 ────────────────────────────────────────────────────────────────────────────── 
  C…                                                                            
  a…                                                                            
  b…                                                                            
  e…    $    33…    $    32…        3.4  %    $   66…    $   67…        -1…  %  
  s…                                                                            
  c…                                                                            
  e…                                                                            
  S…                                                                            
  c…         29…         22…        29…  %        68…        68…        1.0  %  
  e…                                                                            
  T…                                                                            
  c…    $    36…    $    34…        5.1  %    $   73…    $   74…        -1…  %  
  a…                                                                            
  b…                                                                            
  O…         72…         74…        -1…  %        13…        14…        -2…  %  
  c…                                                                            
  A…         66…         63…        5.0  %        14…        13…        8.5  %  
  e…                                                                            
  O…                                                                            
  o…         12…         11…        6.9  %        24…        24…        1.2  %  
  c…                                                                            
  T…                                                                            
  S…    $    62…    $    60…        4.6  %    $   1,…    $   1,…        0.2  %  
  e…                                                                            
  S…                                                                            
  p…    $    1,…    $    1,…        -8…  %    $   1,…    $   1,…        -7…  %  
  t…                                                                            
  u…                                                                            
                                                                                
(1) Amounts are net of intercompany eliminations.

(2) Excludes compensation and benefits related to reconditioning and vehicle
repair service, which are included in cost of sales.

(3) Includes IT expenses, non-CAF bad debt, insurance, preopening and relocation
costs, travel, charitable contributions and other administrative expenses.
                                     -more-                                     
CarMax, Inc.

Page 8 of 14

Components of CAF Income and Other CAF Information
                                                                                
          Three                               Six                               
          Mont…                               Mont…                             
  (In     Ended                               Ended                             
  mil…    Augu…                               Augu…                             
  Int…    31                                  31                                
  mar…    2026             2025               2026              2025            
 ────────────────────────────────────────────────────────────────────────────── 
  Int…                                                                          
  and     $      456.2     $      489.8       $       917.1     $     975.2     
  fee                                                                           
  inc…                                                                          
  Int…           -182…           -199.2              -366.5           -396…     
  exp…                                                                          
  Tot…                                                                          
  int…           273.9            290.6               550.6           578.5     
  mar…                                                                          
  Pro…                                                                          
  for            -113…           -142.2              -209.0           -243…     
  loan                                                                          
  los…                                                                          
  Tot…                                                                          
  int…                                                                          
  mar…                                                                          
  aft…           160.5            148.4               341.6           334.6     
  pro…                                                                          
  for                                                                           
  loan                                                                          
  los…                                                                          
  Ser…             6.1                —                10.3               —     
  inc…                                                                          
  Tot…                                                                          
  dir…           -47.6            -45.8               -92.7           -90.3     
  exp…                                                                          
  Gain                                                                          
  on                                                                            
  sale            16.6                —                16.6               —     
  of                                                                            
  auto                                                                          
  loa…                                                                          
  Car…                                                                          
  Auto    $      135.6     $      102.6       $       275.8     $     244.3     
  Fin…                                                                          
  inc…                                                                          
  Ave…                                                                          
  auto    $      16,4…     $     17,73…       $      16,51…     $     17,7…     
  loa…                                                                          
  out…                                                                          
  Tot…                                                                          
  int…                                                                          
  mar…                                                                          
  as a                                                                          
  per…             6.6  %           6.6  %              6.7  %          6.5  %  
  of                                                                            
  ave…                                                                          
  auto                                                                          
  loa…                                                                          
  out…                                                                          
  Net                                                                           
  auto    $      2,26…     $     2,039…       $      4,710…     $     4,35…     
  loa…                                                                          
  ori…                                                                          
  Net                                                                           
  pen…            40.9  %          42.6  %             42.1  %         42.1  %  
  rate                                                                          
  Wei…                                                                          
  ave…            11.8  %          11.2  %             11.6  %         11.3  %  
  con…                                                                          
  rate                                                                          
  End…                                                                          
  all…                                                                          
  for     $      497.3     $      507.3       $       497.3     $     507.3     
  loan                                                                          
  los…                                                                          
                                                                                
(1) Includes auto loans held for investment and auto loans held for sale.
                                                                                
  Earnings Highlights                                                           
                                                                                
                                                                                
  (…                                                                            
  m…         Th…                                  Six                           
  e…         Mo…                                  Mo…                           
  p…         En…                                  En…                           
  s…         Au…                                  Au…                           
  d…    20…   31    20…         C…            2…   31    2…         C…          
 ────────────────────────────────────────────────────────────────────────────── 
  N…    $    16…    $    95…        73…  %    $   35…    $   30…        14…  %  
  e…                                                                            
  D…                                                                            
  w…                                                                            
  a…         14…         14…        -4…  %        14…        15…        -5…  %  
  s…                                                                            
  o…                                                                            
  N…                                                                            
  e…                                                                            
  p…    $    1.…    $    0.…        81…  %    $   2.…    $   2.…        22…  %  
  d…                                                                            
  s…                                                                            
                                                                                
                                     -more-                                     
CarMax, Inc.

Page 9 of 14
                                                                                
  Conference Call Information                                                   
                                                                                
We will host a conference call for investors at 8:00 a.m. ET today, September
29, 2026 . Domestic investors may access the call at 1-800-225-9448
(international callers dial 1-203-518-9708). The conference I.D. for both
domestic and international callers is 3171396. A live webcast of the call will
be available on our investor information home page at investors.carmax.com. An
investor presentation is also available on the website.

A replay of the webcast will be available on the company’s website at
investors.carmax.com through December 16, 2026, or via telephone (for
approximately one week) by dialing 1-800-839-1222 (or 1-402-220-0459 for
international access) and entering the conference ID 3171396.
                                                                                
  Third Quarter Fiscal 2027 Earnings Release Date                               
                                                                                
We currently plan to release results for the quarter ending November 30th, on
December 17, 2026, before the opening of trading on the New York Stock Exchange.
We plan to host a conference call for investors at 8:00 a.m. ET on that date.
Information on this conference call will be available on our investor
information home page at investors.carmax.com in early December 2026.
                                                                                
  About CarMax                                                                  
                                                                                
CarMax, the nation’s largest retailer of used autos, has earned customers’ trust
for more than 30 years by leading with integrity, transparency and honesty.
CarMax continues to redefine car buying and selling for millions of customers,
delivering the easy and confident experience they love. CarMax has more than 255
store locations, approximately 28,000 associates, and is proud to have been
recognized for 22 consecutive years as one of the Fortune 100 Best Companies to
Work For®. During the fiscal year that ended February 28, 2026, CarMax sold
approximately 780,000 used vehicles and 540,000 wholesale vehicles at its
auctions. In addition, CarMax Auto Finance originated $8 billion in auto loans
during fiscal 2026, adding to its $16 billion portfolio. CarMax is committed to
helping its communities thrive and reducing the environmental footprint of its
operations. Learn more in the 2026 Responsibility Report. For more information,
visit www.carmax.com.
                                                                                
  Forward-Looking Statements                                                    
                                                                                
We caution readers that the statements contained in this release that are not
statements of historical fact, including statements about our future business
plans, operations, challenges, opportunities or prospects, including without
limitation any statements or factors regarding our recent leadership transition,
strategy for growth, operating capacity, sales, inventory, market share,
financial and operational targets and goals, revenue, margins, expenses,
liquidity, loan originations, capital expenditures, share repurchase plans, debt
obligations or earnings, are forward-looking statements made pursuant to the
safe harbor provisions of the Private Securities Litigation Reform Act of 1995.
You can identify these forward-looking statements by the use of words such as
“anticipate,” “believe,” “commit,” “could,” “enable,” “encourage,” “estimate,”
“expect,” “focus on,” “intend,” “may,” “on track,” “outlook,” “plan,”
“position,” “predict,” “should,” “target,” “will” and other variations of these
words or similar expressions, whether in the negative or affirmative. Such
forward-looking statements are based upon management’s current knowledge,
expectations and assumptions and involve risks and uncertainties that could
cause actual results to differ materially from anticipated results. Among the
factors that could cause actual results and outcomes to differ materially from
those contained in the forward-looking statements are the following:
                                     -more-                                     
CarMax, Inc.

Page 10 of 14

• Changes in the competitive landscape and/or our failure to successfully adjust
to such changes.

• Changes in general or regional U.S. economic conditions, including economic
downturns, inflationary pressures, fluctuating interest rates, tariffs, the
effect of trade policies or related uncertainties, and the potential impact of
international events (including the conflict in the Middle East).

• Changes in the availability or cost of capital and working capital financing,
including changes related to the asset-backed securitization market.

• Events that damage our reputation or harm the perception of the quality of our
brand.

• Significant changes in prices of new and used vehicles.

• A reduction in the availability of or access to sources of inventory or a
failure to expeditiously liquidate inventory.

• The failure or inability to realize the expected benefits and objectives
associated with our strategy for growth.

• Our inability to realize the benefits associated with our sales platform or
initiatives designed to leverage evolving technologies, including AI.

• Our ability to repurchase shares of common stock at planned levels.

• Factors related to geographic and sales growth, including the inability to
effectively manage our growth.

• Our inability to recruit, develop and retain associates and maintain positive
associate relations.

• The loss of key associates from our store, regional or corporate management
teams, the failure to effectively execute key executive succession plans,
disruptions associated with leadership transitions, or a significant increase in
labor costs.

• Changes in economic conditions or other factors that result in greater credit
losses for CAF’s portfolio of auto loans than anticipated.

• The failure or inability to realize the benefits associated with our strategic
investments.

• Changes in consumer credit availability provided by our third-party finance
providers.

• Changes in the availability of extended protection plan products from third-
party providers.

• The performance of the third-party vendors we rely on for key components of
our business.

• Adverse conditions affecting one or more automotive manufacturers.

• The inaccuracy of estimates and assumptions used in the preparation of our
financial statements, or the effect of new accounting requirements or changes to
U.S. generally accepted accounting principles.

• The failure or inability to adequately protect our intellectual property.

• The occurrence of severe weather events.

• The failure or inability to meet our environmental goals or satisfy related
disclosure requirements.

• Factors related to the geographic concentration of our stores.

• Security breaches or other events that result in the misappropriation, loss or
other unauthorized disclosure of confidential customer, associate or corporate
information.

• The failure of or inability to sufficiently enhance key information systems.

• Factors related to the regulatory and legislative environment in which we
operate.

• The effect of evolving regulations, disclosure requirements, standards and
expectations relating to environmental, social and governance matters.

• The effect of various litigation matters.

• The volatility in the market price for our common stock.

• The impact of shareholder activism.

For more details on factors that could affect expectations, see our Annual
Report on Form 10-K for the fiscal year ended February 28, 2026, and our
quarterly or current reports as filed with or furnished to the U.S. Securities
and Exchange Commission. Our filings are publicly available on our investor
information home page at investors.carmax.com. Requests for information may also
be made to the Investor Relations Department by email to
[email protected] or by calling (804) 747-0422 x7865. We undertake
no obligation to update or revise any forward-looking statements after the date
they are made, whether as a result of new information, future events or
otherwise.
                                     -more-                                     
CarMax, Inc.

Page 11 of 14

Contacts:

Investors:

David Lowenstein, Vice President, Investor Relations

[email protected], (804) 747-0422 x7865

Media:

[email protected], (855) 887-2915
                                     -more-                                     
CarMax, Inc.

Page 12 of 14
                                                                                
                         CARMAX, INC. AND SUBSIDIARIES                          
                                                                                
                                                                                
                      CONSOLIDATED STATEMENTS OF EARNINGS                       
                                                                                
                                  (UNAUDITED)                                   
                                                                                
  …                                                                             
  …                                                                             
  …                                                                             
  …                                                                             
  …    T…                                     S…                                
  …    M…                                     M…                                
  …    E…                                     E…                                
  …    A…                                     A…                                
  …    31                                     31                                
  …    2…        %…        2…        %…       2…       %…       2…       %…     
 ────────────────────────────────────────────────────────────────────────────── 
  …                                                                             
  …    $   6…        8…    $   5…        …    $   …        …    $   …        …  
  …                                                                             
  …                                                                             
  …        1…        1…        1…        …        …        …        …        …  
  …                                                                             
  …                                                                             
  …        2…        2…        1…        …        …        …        …        …  
  …                                                                             
  …                                                                             
  …                                                                             
  …                                                                             
  …        7…        1…        6…        …        …        …        …        …  
  …                                                                             
  …                                                                             
  …                                                                             
  …                                                                             
  …                                                                             
  …                                                                             
  …                                                                             
  …        5…        7…        4…        …        …        …        …        …  
  …                                                                             
  …                                                                             
  …                                                                             
  …                                                                             
  …        1…        1…        1…        …        …        …        …        …  
  …                                                                             
  …                                                                             
  …                                                                             
  …        2…        0…        3…        …        …        …        …        …  
  …                                                                             
  …                                                                             
  …                                                                             
  …        7…        8…        5…        …        …        …        …        …  
  …                                                                             
  …                                                                             
  …        7…        1…        7…        …        …        …        …        …  
  …                                                                             
  …                                                                             
  …        1…        1…        1…        …        …        …        …        …  
  …                                                                             
  …                                                                             
  …                                                                             
  …                                                                             
  …        6…        8…        6…        …        …        …        …        …  
  …                                                                             
  …                                                                             
  …                                                                             
  …        7…        0…        6…        …        …        …        …        …  
  …                                                                             
  …        3…        0…        2…        …        …        …        …        …  
  …                                                                             
  …        -…        -…        -…        …        …        …        …        —  
  …                                                                             
  …                                                                             
  …        2…        2…        1…        …        …        …        …        …  
  …                                                                             
  …                                                                             
  …                                                                             
  …        5…        0…        3…        …        …        …        …        …  
  …                                                                             
  …    $   1…        2…    $   9…        …    $   …        …    $   …        …  
  …                                                                             
  …                                                                             
  …                                                                             
  …                                                                             
  …                                                                             
  …        1…                  1…                 …                 …           
  …        1…                  1…                 …                 …           
  …                                                                             
  …                                                                             
  …                                                                             
  …                                                                             
  …    $   1…              $   0…             $   …             $   …           
  …    $   1…              $   0…             $   …             $   …           
                                                                                
(1) Percents are calculated as a percentage of net sales and operating revenues
and may not total due to rounding.
                                     -more-                                     
CarMax, Inc.

Page 13 of 14
                                                                                
                         CARMAX, INC. AND SUBSIDIARIES                          
                                                                                
                                                                                
                          CONSOLIDATED BALANCE SHEETS                           
                                                                                
                                  (UNAUDITED)                                   
                                                                                
  (In                                                                           
  thous…                                                                        
  except               As of                                                    
  share                August              Februa…             August           
  data)     CURRENT    31                  28                  31               
  ASSETS    ASSETS:    2026                2026                2025             
 ────────────────────────────────────────────────────────────────────────────── 
            Cash                                                                
            and        $        170,525    $        122,826    $        540,3…  
            cash                                                                
            equiva…                                                             
            Restri…                                                             
            cash                                                                
            from                                                                
            collec…                                                             
            on auto             604,917             592,033             618,7…  
            loans                                                               
            held                                                                
            for                                                                 
            invest…                                                             
            Accoun…                                                             
            receiv…             224,627             204,453             173,5…  
            net                                                                 
            Auto                                                                
            loans                                                               
            held                106,541             100,491             921,9…  
            for                                                                 
            sale                                                                
            Invent…             3,854,…             4,137,…             3,149…  
            Other                                                               
            current             146,897             153,594             137,7…  
            assets                                                              
            TOTAL                                                               
            CURRENT             5,108,…             5,310,…             5,542…  
            ASSETS                                                              
            Auto                                                                
            loans                                                               
            held                15,812…             15,952…             16,38…  
            for                                                                 
            invest…                                                             
            net                                                                 
            Proper…                                                             
            and                 4,078,…             4,070,…             3,969…  
            equipm…                                                             
            net                                                                 
            Deferr…                                                             
            income               81,868              78,479             105,7…  
            taxes                                                               
            Operat…                                                             
            lease               440,965             459,514             476,3…  
            assets                                                              
            Goodwi…                   —                   —             141,2…  
            Other               546,606             496,924             459,0…  
            assets                                                              
            TOTAL      $        26,068…    $        26,367…    $        27,07…  
            ASSETS                                                              
  LIABI…                                                                        
  AND                                                                           
  SHARE…                                                                        
  EQUITY                                                                        
            CURRENT                                                             
            LIABIL…                                                             
            Accoun…    $        989,458    $        1,117,…    $        913,3…  
            payable                                                             
            Accrued                                                             
            expens…                                                             
            and                 525,658             475,495             477,9…  
            other                                                               
            current                                                             
            liabil…                                                             
            Accrued                                                             
            income               32,138               2,019              4,871  
            taxes                                                               
            Current                                                             
            portion                                                             
            of                   56,969              57,341             57,948  
            operat…                                                             
            lease                                                               
            liabil…                                                             
            Current                                                             
            portion                                                             
            of                   17,693             217,323             216,8…  
            long-t…                                                             
            debt                                                                
            Current                                                             
            portion                                                             
            of                  571,690             544,651             581,0…  
            non-re…                                                             
            notes                                                               
            payable                                                             
            TOTAL                                                               
            CURRENT             2,193,…             2,414,…             2,252…  
            LIABIL…                                                             
            Long-t…                                                             
            debt,                                                               
            exclud…             1,663,…             2,006,…             1,369…  
            current                                                             
            portion                                                             
            Non-re…                                                             
            notes                                                               
            payabl…             15,122…             15,254…             16,44…  
            exclud…                                                             
            current                                                             
            portion                                                             
            Operat…                                                             
            lease                                                               
            liabil…             439,000             464,696             463,8…  
            exclud…                                                             
            current                                                             
            portion                                                             
            Other               345,330             338,999             345,8…  
            liabil…                                                             
            TOTAL               19,763…             20,479…             20,87…  
            LIABIL…                                                             
            Commit…                                                             
            and                                                                 
            contin…                                                             
            liabil…                                                             
            SHAREH…                                                             
            EQUITY:                                                             
            Common                                                              
            stock,                                                              
            $0.50                                                               
            par                                                                 
            value;                                                              
            350,00…                                                             
            shares                                                              
            author…                                                             
            141,93…                                                             
            and                                                                 
            141,79…                                                             
            shares               70,967              70,900             73,837  
            issued                                                              
            and                                                                 
            outsta…                                                             
            as of                                                               
            August                                                              
            31,                                                                 
            2026                                                                
            and                                                                 
            Februa…                                                             
            28,                                                                 
            2026,                                                               
            respec…                                                             
            Capital                                                             
            in                                                                  
            excess              1,846,…             1,810,…             1,873…  
            of par                                                              
            value                                                               
            Accumu…                                                             
            other                -5,683             -34,126             -21,3…  
            compre…                                                             
            loss                                                                
            Retain…             4,392,…             4,041,…             4,274…  
            earnin…                                                             
            TOTAL                                                               
            SHAREH…             6,304,…             5,888,…             6,200…  
            EQUITY                                                              
            TOTAL                                                               
            LIABIL…                                                             
            AND        $        26,068…    $        26,367…    $        27,07…  
            SHAREH…                                                             
            EQUITY                                                              
                                                                                
                                     -more-                                     
CarMax, Inc.

Page 14 of 14
                                                                                
                         CARMAX, INC. AND SUBSIDIARIES                          
                                                                                
                                                                                
                     CONSOLIDATED STATEMENTS OF CASH FLOWS                      
                                                                                
                                  (UNAUDITED)                                   
                                                                                
  (In thousands)         Six Months Ended                                       
  OPERATING              August 31                                              
  ACTIVITIES:            2026                                 2025              
 ────────────────────────────────────────────────────────────────────────────── 
  Net earnings           $                         350,914    $        305,759  
  Adjustments to                                                                
  reconcile net                                                                 
  earnings to                                                                   
  net cash provided                                                             
  by operating                                                                  
  activities:                                                                   
  Depreciation and                                 188,098             163,715  
  amortization                                                                  
  Share-based                                                                   
  compensation                                      74,304              71,255  
  expense                                                                       
  Provision for loan                               208,975             243,904  
  losses                                                                        
  Provision for                                                                 
  cancellation                                      53,315              41,897  
  reserves                                                                      
  Deferred income tax                              -12,620              42,424  
  (benefit) provision                                                           
  Proceeds from sale                               579,907                   —  
  of auto loans                                                                 
  Other                                            -39,899               1,393  
  Net (increase)                                                                
  decrease in:                                                                  
  Accounts                                         -19,484              15,177  
  receivable, net                                                               
  Auto loans held for                             -106,541            -921,928  
  sale                                                                          
  Inventory                                        282,224             785,052  
  Other current                                     28,762               6,331  
  assets                                                                        
  Auto loans held for                             -564,434             612,649  
  investment, net                                                               
  Other assets                                     -17,318             -13,889  
  Net decrease in:                                                              
  Accounts payable,                                                             
  accrued expenses                                                              
  and                                                                           
  other                                                                         
  current liabilities                                                           
  and accrued income                               -51,562            -230,470  
  taxes                                                                         
  Other liabilities                                -54,118             -38,232  
  NET CASH PROVIDED                                                             
  BY OPERATING                                     900,523           1,085,037  
  ACTIVITIES                                                                    
  INVESTING                                                                     
  ACTIVITIES:                                                                   
  Capital                                         -180,442            -268,204  
  expenditures                                                                  
  Proceeds from                                                                 
  disposal of                                          253                 348  
  property and                                                                  
  equipment                                                                     
  Purchases of                                      -3,373              -5,765  
  investments                                                                   
  Sales and returns                                  2,780               1,155  
  of investments                                                                
  Principal payments                                                            
  received on                                       10,524                   —  
  beneficial                                                                    
  interests                                                                     
  NET CASH USED IN                                                              
  INVESTING                                       -170,258            -272,466  
  ACTIVITIES                                                                    
  FINANCING                                                                     
  ACTIVITIES:                                                                   
  Proceeds from                                                                 
  issuances of                                   3,073,100              87,000  
  long-term                                                                     
  debt                                                                          
  Payments on                                   -3,621,987             -94,955  
  long-term debt                                                                
  Cash paid for debt                               -11,162             -13,279  
  issuance costs                                                                
  Payments on finance                               -8,442              -7,105  
  lease obligations                                                             
  Issuances of                                                                  
  non-recourse notes                             6,742,859           6,848,169  
  payable                                                                       
  Payments on                                                                   
  non-recourse notes                            -6,849,158          -6,911,012  
  payable                                                                       
  Repurchase and                                                                
  retirement of                                     -2,621            -384,873  
  common                                                                        
  stock                                                                         
  Equity issuances                                      83               8,349  
  NET CASH USED IN                                                              
  FINANCING                                       -677,328            -467,706  
  ACTIVITIES                                                                    
  Increase in cash,                                                             
  cash equivalents,                                 52,937             344,865  
  and                                                                           
  restricted cash                                                               
  Cash, cash                                                                    
  equivalents, and                                                              
  restricted                                       862,850             960,310  
  cash at beginning                                                             
  of year                                                                       
  CASH, CASH                                                                    
  EQUIVALENTS, AND                                                              
  RESTRICTED             $                         915,787    $      1,305,175  
  CASH AT END OF                                                                
  PERIOD                                                                        
                                                                                
                                     # # #                                      

Sources

The 8-K item 2.02 filings (SEC EDGAR) and their EX-99 exhibits: the results release and, when filed, prepared remarks or the call transcript.

Also

Said vs did: the targets in these releases against what was then reported. Filings: every filing.

Work with it

Excel workbook · CSV. Google Sheet that stays up to date: paste =IMPORTDATA("https://tickdelta.com/company/KMX/export.csv") into a cell.

Next:Presentations
Esc

Type a ticker such as AAPL, a name, an investor such as Buffett, or a topic such as tariffs. ↑ ↓ to move, Enter to open.