KVUEKenvue
At Kenvue, our purpose is to realize the extraordinary power of everyday care. 10-K, Item 1
- Employees
- 22,000
- Headquarters
- Summit, NJ
- CEO
- Kirk Perry
- Next results
- around Feb 16, 2027
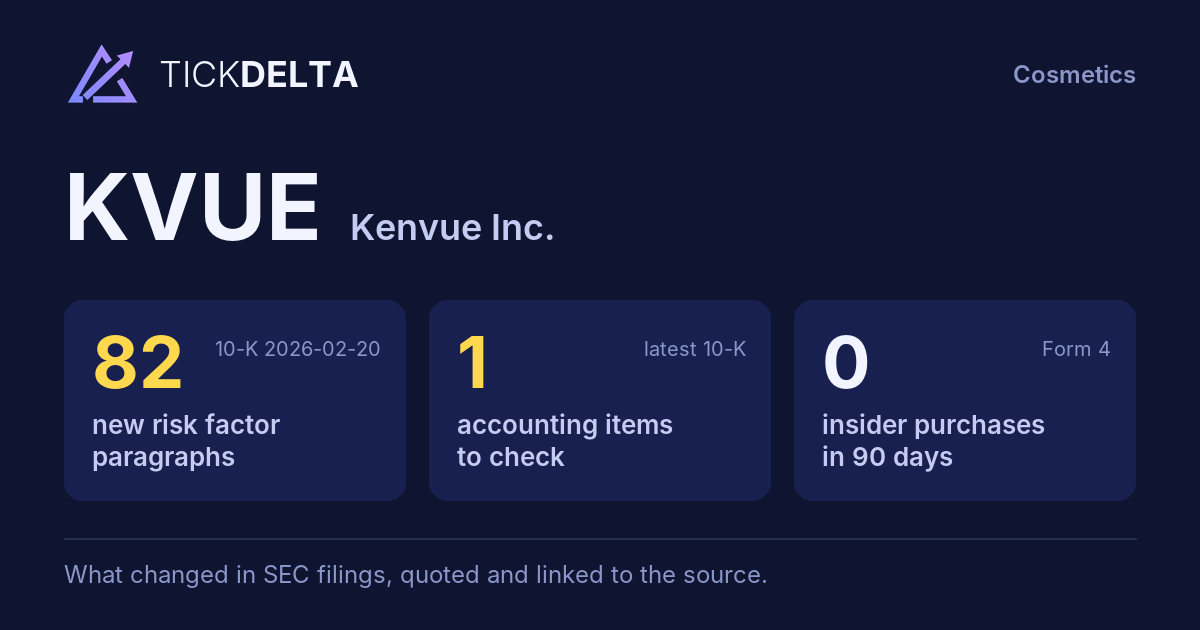
The biggest changes in the 10-K filed 2026-02-20, this fiscal year against the last, and the sentences in the MD&A (Item 7) where management explains them, quoted word for word. Tickdelta picks sentences that name the line, a direction and a cause. It does not write explanations of its own.
Net income
+42.7% Big change FY to 2025-12-28 vs 2024-12-29The MD&A has no sentence that names a cause for this change. That can be worth a question: ask about the filing.
Operating margin
11.9% → 16.0% (+4.0 pts) Big change FY to 2025-12-28 vs 2024-12-29The MD&A has no sentence that names a cause for this change. That can be worth a question: ask about the filing.
Cash from operations
+24.2% Big change FY to 2025-12-28 vs 2024-12-29The MD&A has no sentence that names a cause for this change. That can be worth a question: ask about the filing.
Revenue
-2.1% FY to 2025-12-28 vs 2024-12-29“Excluding the impact of favorable changes in foreign currency exchange rates of 0.2% and the reduction in Net sales related to divestitures of 0.1%, Organic sales (a non-GAAP financial measure as defined in “Segment Results—Organic Sales Change” below) decreased 2.2% driven by volume-related decreases of 2.3% partially offset by favorable value realization (defined as price, including mix) of 0.1%.”
Read it in the 10-K ↗
“Excluding the impact of the reduction in Net sales related to divestitures of 0.3%, Organic sales decreased 2.7% driven by both volume-related decreases of 1.8% and unfavorable value realization of 0.9% attributable to strategic price investments.”
Read it in the 10-K ↗
Gross margin
58.0% → 58.1% (+0.2 pts) FY to 2025-12-28 vs 2024-12-29“Changes in Cost of sales were primarily due to volume-related Net sales decreases.”
Read it in the 10-K ↗
Changes are computed from the XBRL figures in the same 10-K. Hover a number to see the line item. Open the 10-K ↗
Work on KVUE in a spreadsheet:
Excel workbook (a sheet per section, ten years by column, charts, links to the filings) ·
CSV.
For a Google Sheet that stays up to date, paste =IMPORTDATA("https://tickdelta.com/company/KVUE/export.csv") into a cell.