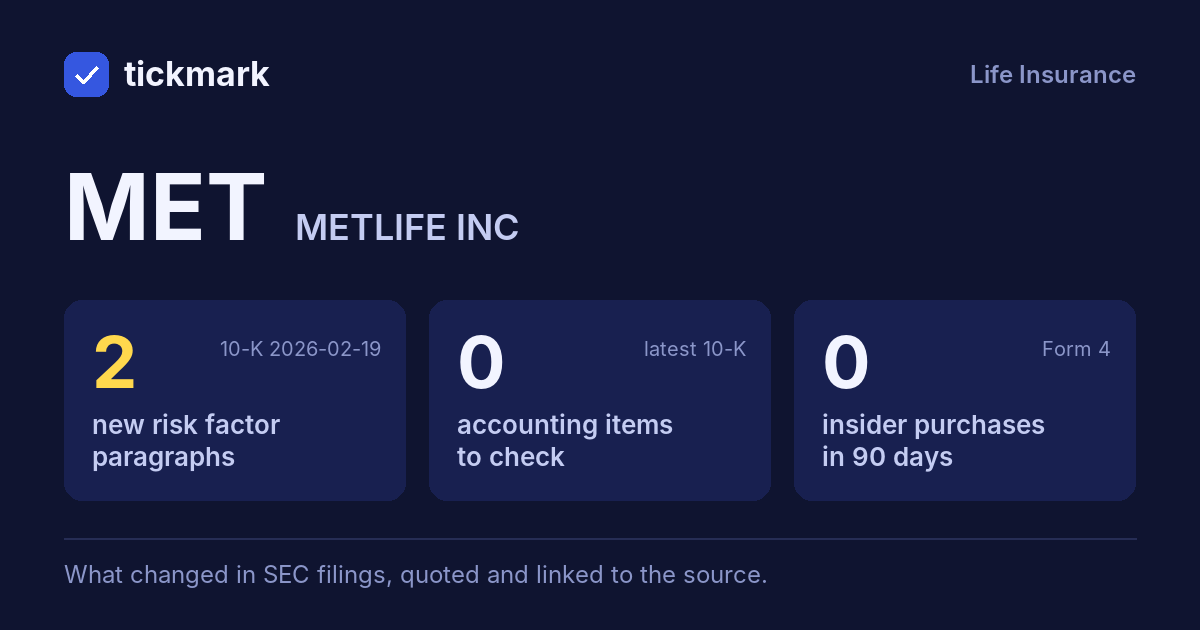
10-K 0001099219-26-000013 (2026-02-19) vs 10-K 0001099219-25-000044 (2025-02-21)
| Section | Compared text | Words now | Changed |
|---|
| Risk Factors | Item 1A | 10,914 |
5.0% |
| MD&A | Item 7 | 31,746 |
15.5% |
| Legal Proceedings | Item 3, via Note 24 – Contingencies, Commitments and Guarantees | 2,348 |
33.3% |
| Accounting Policies | Item 8, Note 1 – Business, Basis of Presentation and Summary of Significant Accounting Policies | 13,725 |
13.8% |
The redline: what was cut and what was added
In each section, the paragraph that changed most, marked against last year's 10-K:
cut words struck through, new words highlighted and underlined.
Risk Factors 238 words changed in this paragraph; it is 58% similar to last year's version.
Our investors or others may evaluate our practices by ESG against sustainability criteria that continue to evolve and may be unclear, inconsistent or based on methodologies that are continually evolving and not always clear or readily measurable. These standards and expectations may also, as a whole, reflect contrasting differing or conflicting values or agendas and are not always susceptible to consensus. priorities. Our decisions and priorities must also necessarily, balance multiple objectives simultaneously, and simultaneously, take account of multiple business goals and interests. Our our practices may not change in the particulars manner or at the rate time frame some stakeholders expect. As a result, our efforts to conduct our business operate in accordance alignment with some or all of these expectations may involve trade-offs. In June 2022, we announced our commitment to achieve net zero greenhouse gas (“GHG”) emissions by 2050 or sooner. This commitment applies to GHG emissions from our global owned and leased offices and vehicle fleets, employee business travel, supply chain and general account investment portfolio, including the general accounts of MetLife, Inc.’s wholly-owned subsidiaries, where reliable data and methodologies are available. We have oriented our climate objectives Our sustainability aspirations and interim targets to advance this commitment, which involves rely on assumptions and expectations that involve risks and uncertainties. Data and measurement techniques continue to evolve. Further, because of the financed emissions included in our investment portfolio, our ability to meet our commitments is dependent achieve these aspirations depends in part on those counterparties meeting their own carbon emissions reduction objectives. Standards, data sources, analytical tools and regulatory requirements related to sustainability practices continue to evolve, and the availability, quality, and comparability of data varies across our operations, supply chain, and investment activities. We also rely on data provided by third parties, which may be incomplete, inaccurate, delayed, or unavailable. As techniques, industry standards, and regulatory expectations continue to develop, our assessments, reporting, and targets may change. We may fail to meet our commitments or interim targets, and our policies and processes to evaluate and manage ESG sustainability standards in coordination with other business priorities may not prove completely effective or fully satisfy expectations of some stakeholders. For example, some current customers and potential customers may decline to do business with us based on our sustainability practices and related policies and actions. We may also face adverse regulatory, investor, media, or public scrutiny leading to business, reputational, or legal challenges.
Source: Item 1A, 10-K 0001099219-26-000013 vs Item 1A, 10-K 0001099219-25-000044
Accounting Policies 176 words changed in this paragraph; it is 44% similar to last year's version.
“MetLife” and the “Company” refer to MetLife, Inc., a Delaware corporation incorporated in 1999, its subsidiaries and affiliates. MetLife is one of the world’s leading financial services companies, providing insurance, annuities, employee benefits and asset management. In the fourth quarter of 2025, MetLife executed a reorganization to align with its strategic initiative to accelerate growth in asset management. As part of this reorganization, the Company adjusted its segment structure. MetLife Investment Management, the Company’s institutional asset management business (“MIM”), which was previously reported in Corporate & Other, became a reportable segment. MetLife Holdings was removed as a reportable segment, and its business is now primarily reported in Corporate & Other. These changes were applied retrospectively for all years presented. Additionally, certain products formerly reported in MetLife Holdings have been moved to Group Benefits and Retirement and Income Solutions (“RIS”). This change was applied only for the year ended December 31, 2025. The foregoing changes did not impact prior period consolidated net income (loss) or consolidated adjusted earnings, and are collectively referred to as the “Strategic Reorganization.” As a result of the Strategic Reorganization, MetLife is organized into the following six segments: Group Benefits; Retirement and Income Solutions (“RIS”); RIS; Asia; Latin America; Europe, the Middle East and Africa (“EMEA”); and MetLife Holdings. MIM. In addition, the Company reports continues to report certain of its results of operations in Corporate & Other. See Note 2 for further information on the Company’s segments and Corporate & Other.
Source: Item 8, Note 1 – Business, Basis of Presentation and Summary of Significant Accounting Policies, 10-K 0001099219-26-000013 vs Item 8, Note 1 – Business, Basis of Presentation and Summary of Significant Accounting Policies, 10-K 0001099219-25-000044
MD&A 161 words changed in this paragraph; it is 32% similar to last year's version.
Years Ended December 31, 2025 2024 2023 Asset Type Carrying Value % of Total Carrying Value % of Total Class Yield% (1) Amount Yield% (1) Amount (Dollars in millions) Freestanding derivatives with positive estimated fair values Fixed maturity securities (2), (3) 4.54% $ 8,212 44.4% 13,765 4.44% $ 8,737 48.0% Operating joint ventures 2,006 10.8 1,142 6.3 Company-owned life insurance policies 1,738 9.4 1,036 5.7 Annuities funding structured settlement claims 1,248 6.7 1,256 6.9 Direct financing leases 1,228 6.6 1,304 7.2 Tax credit 13,089 Mortgage loans (3) 5.20 4,096 5.29 4,378 Real estate and renewable energy partnerships 714 3.9 1,034 5.7 FHLBNY common stock 699 3.8 714 3.9 Leveraged leases 623 3.4 689 3.8 Funds withheld 433 2.3 436 2.4 REJVs 3.48 475 (0.12) (15) Policy loans 5.63 449 5.60 453 Equity securities 4.26 23 4.38 23 Other 1,603 8.7 1,854 10.1 Total $ 18,504 100.0% $ 18,202 100.0% Percentage of cash limited partnership interests 8.28 1,194 6.73 965 Cash and short-term investments 4.26 903 5.04 961 Other invested assets 4.0 % 3.9 % 1,142 1,414 Investment income 4.91% $ 22,047 4.80% $ 21,268 Investment fees and expenses (0.14) (614) (0.13) (595) Net investment income including divested businesses (4) 4.77% $ 21,433 4.67% $ 20,673 Less: net investment income from divested businesses (4) 1 1 Adjusted net investment income $ 21,432 $ 20,672
Source: Item 7, 10-K 0001099219-26-000013 vs Item 7, 10-K 0001099219-25-000044
Legal Proceedings 15 words changed in this paragraph; it is 84% similar to last year's version.
The Company commits to fund partnership investments and to lend funds under bank credit facilities, bridge loans facilities and private corporate bond investments. The amounts of these unfunded commitments were $8.1 $11.1 billion and $9.2 $8.1 billion at December 31, 2024 2025 and 2023, 2024, respectively. See Note 25 for additional information on commitments to related parties.
Source: Item 3, via Note 24 – Contingencies, Commitments and Guarantees, 10-K 0001099219-26-000013 vs Item 3, via Note 24 – Contingencies, Commitments and Guarantees, 10-K 0001099219-25-000044
Every change, by type
Sentences and paragraphs of MET's Risk Factors and MD&A, 10-K 2026-02-19 against 10-K 2025-02-21.
Each links to the text at sec.gov.
Quiet changes are sentences kept from last year with one to four words changed, at least one of them a hedge, a modal or a qualifier
(may, could, will, not, significant, material…). A year or date rolling forward is not counted.
The full word list
adverse, adversely, all, although, anticipate, anticipates, any, approximately, believe, believes, can, cannot, certain, could, expect, expects, generally, however, if, intend, intends, largely, likely, many, material, materially, may, might, most, must, never, no, not, possible, primarily, probable, should, significant, significantly, some, substantial, substantially, unlikely, will, would
AddedRisk Factors
Market conditions resulting in reductions in the value of assets we manage or lower transaction volume may have an adverse effect on the revenues and profitability of our institutional asset management services, which depend on fees related primarily to the value of assets under management (“AUM”).
Read it in 10-K 2026-02-19 at sec.gov ↗
AddedRisk Factors
We May Have to Pledge Collateral or Make Payments in Derivatives and Reinsurance Transactions
Read it in 10-K 2026-02-19 at sec.gov ↗
RewordedRisk Factors
(ii) our dependence on a joint venture counterparty given limits on our ownership or levels and/or certain distribution requirements, as well as including for resources, including such as capital and product distribution, may reduce our control over, financial returns from, or the value of a joint venture; distribution; and (iii) the risk of our counterparties' cooperation failure to cooperate or meet their obligations, or their ability to meet obligations, or election to alter, modify or terminate a relationship.
Read it in 10-K 2026-02-19 at sec.gov ↗
RewordedRisk Factors
Competitive pressures, based on a number of factors including service, product features, scale, price, commission structure, financial strength, investment performance, the level of fees charged, our ability to develop new investment strategies and products, institutional client relationships, talent, claims-paying ratings, credit ratings, e-business capabilities, name recognition, performance against ESG metrics, sustainability-related expectations, technology, AI, adaptation in light of pandemics and other public health issues, changes in regulation and taxes, and other factors, may adversely affect the persistency of our products and our ability to sell products in the future.
Read it in 10-K 2026-02-19 at sec.gov ↗
RewordedRisk Factors
Our investors or others may evaluate our practices by ESG against sustainability criteria that continue to evolve and may be unclear, inconsistent or based on methodologies that are continually evolving and not always clear or readily measurable.
Read it in 10-K 2026-02-19 at sec.gov ↗
RewordedRisk Factors
Such technological developments may introduce or uncover information security vulnerabilities, which may result in breaches or breaches, increased costs associated with maintaining appropriate data privacy, data protection, and cybersecurity measures or measures, enforcement actions against us by regulators. regulators or other outcomes that may adversely impact our operations or business.
Read it in 10-K 2026-02-19 at sec.gov ↗
RewordedRisk Factors
The severity of claims from catastrophic events may be higher if property values increase due to inflation or other factors or our those who are insured lives or property by us are geographically concentrated.
Read it in 10-K 2026-02-19 at sec.gov ↗
RewordedRisk Factors
Additionally, attrition and the loss of key personnel could cause a lapse in implementation of policies and procedures. procedures, adversely affect investment performance, and impair our ability to remain competitive.
Read it in 10-K 2026-02-19 at sec.gov ↗
RewordedRisk Factors
We may fail to adopt new technologies as effectively or efficiently as others, leading to competitive harm, or we may fail to adjust our investments accordingly or suffer stranded assets.
Read it in 10-K 2026-02-19 at sec.gov ↗
RewordedRisk Factors
We, our employees, and our vendors, like other commercial entities, continue to be targeted by or subject to malicious actors attempting to install computer viruses or other malicious code, to gain unauthorized or fraudulent access, human errors, or to carry out ransomware or cyber-attacks, as well as human errors and other breaches or incidents affecting our cybersecurity and information security systems.
Read it in 10-K 2026-02-19 at sec.gov ↗
RewordedRisk Factors
Our decisions and priorities must balance multiple objectives simultaneously, and our practices may not change in the particulars manner or at the rate time frame some stakeholders expect.
Read it in 10-K 2026-02-19 at sec.gov ↗
RewordedRisk Factors
We have oriented our climate objectives Our sustainability aspirations and interim targets to advance this commitment, which involves rely on assumptions and expectations that involve risks and uncertainties.
Read it in 10-K 2026-02-19 at sec.gov ↗
RewordedRisk Factors
Downturns and Downturns, volatility in or other negative equity markets market conditions may harm our savings savings, asset management, and investment products’ and services’ revenues and investment returns, where fee income is earned based upon the fair value of our managed assets.
Read it in 10-K 2026-02-19 at sec.gov ↗
RewordedRisk Factors
Further, because of the financed emissions included in our investment portfolio, our ability to meet our commitments is dependent achieve these aspirations depends in part on those counterparties meeting their own carbon emissions reduction objectives.
Read it in 10-K 2026-02-19 at sec.gov ↗
Quiet changesRisk Factors
If regulators disallow certain assets to back statutory reserves, we would not be able to take some or all related statutory reserve credit, which may harm the statutory capitalization of certain of our insurance subsidiaries.
Read it in 10-K 2026-02-19 at sec.gov ↗
Quiet changesRisk Factors
Any In addition, any such vulnerability that results in a security breach or failure of our information systems, or those of third parties on which we rely, may result in litigation, regulatory action, negative impacts to our business operations, and reputational harm.
Read it in 10-K 2026-02-19 at sec.gov ↗
Quiet changesRisk Factors
Globally, the frequency, severity and sophistication of cybersecurity incidents have increased, and these trends may are likely to continue.
Read it in 10-K 2026-02-19 at sec.gov ↗
AddedMD&A
Furthermore, we also remain fully committed to our New Frontier strategy, which was introduced at our December 2024 Investor Day.
Read it in 10-K 2026-02-19 at sec.gov ↗
AddedMD&A
As part of the Company’s annual actuarial assumption review process (see “— Future Policy Benefit Liabilities” section above), we also reassess the long-term policyholder behavior and mortality assumptions used in determining the fair value of our net MRB liabilities. Changes in these underlying actuarial assumptions (e.g., updates to lapse rates, benefit utilization rates, mortality levels and long-term market expectations based on emerging experience) are incorporated into the MRB valuation model. Accordingly, our annual assumption updates can result in remeasurement of MRB fair values, leading to gains or losses recognized in net income.
Read it in 10-K 2026-02-19 at sec.gov ↗
AddedMD&A
(1)For direct and assumed MRBs, nonperformance risk relates to the Company’s claims paying ability, and for ceded MRBs, it relates to the claims paying ability of the reinsurer.
Read it in 10-K 2026-02-19 at sec.gov ↗
AddedMD&A
•Higher increases to the ACLs on mortgage loans and higher impairments on real estate investments
Read it in 10-K 2026-02-19 at sec.gov ↗
AddedMD&A
•Changes in the estimated fair value of the underlying assets - unfavorable impact to the estimated fair value of embedded derivatives related to funds withheld on reinsurance agreements
Read it in 10-K 2026-02-19 at sec.gov ↗
AddedMD&A
•Higher interest credited expenses - higher average interest crediting rates on long-duration products in the Asia segment and growth in long-duration products in the RIS segment, largely offset by lower average interest credited expenses in the Group Benefits and Latin America segments and Corporate & Other
Read it in 10-K 2026-02-19 at sec.gov ↗
AddedMD&A
•Interest credited expenses decreased - lower average interest crediting rates on retained asset accounts
Read it in 10-K 2026-02-19 at sec.gov ↗
AddedMD&A
•Variable investment income increased - higher returns on private equity funds, real estate funds, and mortgage loan funds
Read it in 10-K 2026-02-19 at sec.gov ↗
AddedMD&A
•Recurring investment income increased - positive flows from pension risk transfer transactions and funding agreement issuances, largely offset by the impact from a reinsurance transaction coupled with lower income on derivatives and an increase in fees paid to MIM due to the transition to current market rate fees in 2025
Read it in 10-K 2026-02-19 at sec.gov ↗
AddedMD&A
•Higher interest credited expenses - growth in investment-type and certain insurance products, partially offset by the impact from a reinsurance transaction
Read it in 10-K 2026-02-19 at sec.gov ↗
AddedMD&A
•Impact of certain product movements as a result of the Strategic Reorganization
Read it in 10-K 2026-02-19 at sec.gov ↗
AddedMD&A
•Business growth across the region, mainly driven by higher positive net flows, which resulted in higher average invested assets
Read it in 10-K 2026-02-19 at sec.gov ↗
RemovedMD&A
For information relating to the Company’s financial condition and results of operations as of and for the year ended December 31, 2022, as well as for the year ended December 31, 2023 compared with the year ended December 31, 2022, see “Management’s Discussion and Analysis of Financial Condition and Results of Operations” in MetLife, Inc.’s Annual Report on Form 10-K for the year ended December 31, 2023.
Read it in 10-K 2025-02-21 at sec.gov ↗
RemovedMD&A
At the December 2024 Investor Day, we introduced our New Frontier five-year strategy which is designed to accelerate growth across our global platform while delivering attractive returns and all-weather performance. Our New Frontier strategy builds upon the success of our five-year Next Horizon strategy, which we announced in 2019, with an aim to focus, simplify and differentiate the Company.
Read it in 10-K 2025-02-21 at sec.gov ↗
RemovedMD&A
1Beginning with fourth quarter and full year 2024 results and going forward, “adjusted return on equity” refers to return on equity, excluding accumulated other comprehensive income (“AOCI”) other than foreign currency translation adjustments (“FCTA”) and certain ceded reinsurance-related embedded derivatives.
Read it in 10-K 2025-02-21 at sec.gov ↗
RemovedMD&A
Governments and central banks around the world use fiscal and monetary policies to address uncertain economic conditions. In the U.S., the Federal Open Market Committee took various actions in 2024 to promote economic stability, including lowering interest rates during the second half of the year. Labor market conditions, inflation and financial and international developments, as well as other factors, could affect the continuation of such actions in 2025. The European Central Bank and Bank of England have also recently lowered interest rates, but forecasts for 2025 are uncertain due to risks to economic growth and global trade. The Bank of Japan raised interest rates in January 2025 taking the policy rate to its highest level since 2008.
Read it in 10-K 2025-02-21 at sec.gov ↗
RemovedMD&A
The life insurance industry remains highly competitive. See “Business — Competition.” Product development is focused on differentiation leading to more intense competition with respect to product features and services. Certain of the industry’s products can be quite homogeneous and subject to intense price competition. Cost reduction efforts are a priority for industry players, with benefits resulting in price adjustments to favor customers and reinvestment capacity. Larger companies have the ability to invest in brand equity, product development, technology optimization, risk management, and innovation, which are among the fundamentals for sustained profitable growth in the life insurance industry. Insurers are focused on their core businesses, specifically in markets where they can achieve scale. Insurers are increasingly seeking alternative sources of revenue; there is a focus on monetization of assets, fee-based services, and opportunities to offer comprehensive solutions, which include providing value-added services along with traditional products. Financial strength and flexibility and technology modernization are prerequisites for sustainable growth in the life insurance industry. Larger market participants tend to have the capacity to invest in analytics, distribution, and information technology and have the ability to leverage the capabilities of new digital entrants. There is a shift in distribution from proprietary to third-party models in mature markets, due to the lower cost structure. Evolving customer expectations are having a significant impact on the competitive environment as insurers strive to offer the superior customer service demanded by an increasingly sophisticated industry client base. Rising demands from stakeholders to address ESG issues have resulted in insurers expanding their sustainability efforts. Legislative and other changes affecting the regulatory environment can also affect the competitive environment within the life insurance industry and within the broader financial services industry. See “Business — Regulation.” In addition to financial strength, technological efficiency and organizational agility, we believe that the ability to adapt to changes in the competitive environment as a result of global market volatility, changing interest rates and uncertain economic conditions is a significant differentiator to success in the life insurance industry and the broader financial services industry, and we are well positioned to compete in this environment.
Read it in 10-K 2025-02-21 at sec.gov ↗
RemovedMD&A
In 2024 and 2022, the Company acquired approximately 2.0% and 15.0% ownership in PNB MetLife India Insurance Company Limited (“PNB MetLife”), respectively. As a result, the Company’s ownership in PNB MetLife, an operating joint venture accounted for under the equity method, increased to approximately 49.0%.
Read it in 10-K 2025-02-21 at sec.gov ↗
RemovedMD&A
Business Overview. The MetLife Holdings segment consists of operations relating to products and businesses, previously included in our former retail business, that we no longer actively market in the U.S. As anticipated, adjusted premiums, fees and other revenues continue to decline from expected business run-off. In addition, see Note 9 of the Notes to the Consolidated Financial Statements for information on a transaction to reinsure an in-force block of this business.
Read it in 10-K 2025-02-21 at sec.gov ↗
RemovedMD&A
•Lower corporate and employee-related expenses, including from initiatives and projects
Read it in 10-K 2025-02-21 at sec.gov ↗
RemovedMD&A
•Litigation reserves increased less in 2024 compared to 2023 (includes notable items in both years)
Read it in 10-K 2025-02-21 at sec.gov ↗
RemovedMD&A
(4)Investment income from net mortgage loans excludes investment income from mortgage loans originated for third parties, respectively. See “— Net Mortgage Loans.”
Read it in 10-K 2025-02-21 at sec.gov ↗
RemovedMD&A
Total CMBS excluding invested assets subject to ceded reinsurance $ 9,182 100.0% $ (497) $ 9,949 100.0% $ (888)
Read it in 10-K 2025-02-21 at sec.gov ↗
RemovedMD&A
(1)Does not include mortgage loans originated for third parties of $7.5 billion at amortized cost ($7.2 billion commercial and $283 million agricultural) or the related ACL of $77 million at December 31, 2024 and $8.5 billion at amortized cost ($8.2 billion commercial and $246 million agricultural) or the related ACL of $73 million at December 31, 2023.
Read it in 10-K 2025-02-21 at sec.gov ↗
RewordedMD&A
December 31, 2025 2024 2023 Asset Type Carrying Value % of Total Carrying Value % of Total (Dollars in millions) Freestanding derivatives with positive estimated fair values $ 7,020 43.4% $ 8,212 44.4% $ 8,737 48.0% Operating joint ventures 2,006 10.8 1,142 6.3 Company-owned life insurance policies 1,832 11.3 1,738 9.4 1,036 5.7 Direct financing leases 1,333 8.2 1,228 6.6 Annuities funding structured settlement claims 1,244 7.7 1,248 6.7 1,256 6.9 Direct financing leases 1,228 6.6 1,304 7.2 Operating joint ventures 1,235 7.6 2,006 10.8 FHLBNY common stock 700 4.3 699 3.8 Tax credit and renewable energy partnerships 676 4.2 714 3.9 1,034 5.7 FHLBNY common stock 699 3.8 714 3.9 Funds withheld 478 3.0 433 2.3 Leveraged leases 365 2.3 623 3.4 689 3.8 Funds withheld 433 2.3 436 2.4 Other 1,310 8.0 1,603 8.7 1,854 10.1 Total other invested assets, excluding Reinsurance activity $ 16,193 100.0% $ 18,504 100.0% Reinsurance activity 139 — Total other invested assets $ 18,202 100.0% 16,332 $ 18,504 Percentage of cash and invested assets assets, excluding Reinsurance activity 3.4 % 4.0 % 3.9 %
Read it in 10-K 2026-02-19 at sec.gov ↗
RewordedMD&A
December 31, 2024 2025 Level Fixed Maturity Equity Securities AFS Securities (Dollars in millions) Level 1 Quoted prices in active markets for identical assets $ 16,597 6.0% 15,738 5.3% $ 415 58.4% 464 61.7% Level 2 Independent pricing sources 227,495 81.6 58 8.1 250,726 84.2 74 9.8 Internal matrix pricing or discounted cash flow techniques — — 3 0.4 Significant other observable inputs $ 227,495 81.6% 250,726 84.2% $ 61 8.5% 77 10.2% Level 3 Independent pricing sources 26,773 9.6 30 4.2 29,737 10.0 96 12.7 Internal matrix pricing or discounted cash flow techniques 7,179 2.6 200 28.1 1,091 0.4 110 14.6 Independent broker quotations 608 0.2 439 0.1 6 0.8 Significant unobservable inputs $ 34,560 12.4% 31,267 10.5% $ 236 33.1% 212 28.1% Total fixed maturity securities AFS and equity securities at estimated fair value value, excluding invested assets subject to ceded reinsurance Reinsurance activity $ 278,652 297,731 100.0% $ 712 753 100.0% Reinsurance adjustments 2,391 — activity 18,200 105 Total fixed maturity securities AFS and equity securities at estimated fair value $ 281,043 315,931 $ 712 858
Read it in 10-K 2026-02-19 at sec.gov ↗
RewordedMD&A
December 31, 2025 2024 2023 Securities by Type Estimated Fair % of Estimated Fair % of Value Total Value Total (Dollars in millions) Fixed maturity securities AFS Publicly traded $ 213,182 71.6% $ 201,259 72.2% $ 209,616 74.5% Privately placed 84,549 28.4 77,393 27.8 71,796 25.5 Total fixed maturity securities AFS AFS, excluding invested assets subject to ceded reinsurance Reinsurance activity $ 297,731 100.0% $ 278,652 100.0% $ 281,412 100.0% Reinsurance adjustments activity 18,200 2,391 — Total fixed maturity securities AFS $ 315,931 $ 281,043 $ 281,412 Percentage of cash and invested assets assets, excluding invested assets subject to ceded reinsurance Reinsurance activity 63.1 % 60.7 % 60.3 % Equity securities Publicly traded $ 543 72.1% $ 474 66.6% $ 506 66.8% Privately held 210 27.9 238 33.4 251 33.2 Total equity securities, excluding Reinsurance activity $ 753 100.0% $ 712 100.0% Reinsurance activity 105 — Total equity securities $ 858 $ 712 100.0% $ 757 100.0% Percentage of cash and invested assets assets, excluding Reinsurance activity 0.2 % 0.2 %
Read it in 10-K 2026-02-19 at sec.gov ↗
RewordedMD&A
Years Ended December 31, 2025 2026 2027 2028 (In millions, net of income tax) Revenues Net Derivative Gains (Losses) derivative gains (losses) $ (200) (253) $ 2 (35) $ 13 (29) Expenses Market Risk Benefit Remeasurement (Gains) Losses risk benefit remeasurement (gains) losses $ 332 (206) $ 23 8 $ (7) 7 Adjusted Earnings earnings Group Benefits $ 6 (7) $ 19 (19) $ 33 (23) RIS 7 25 31 (9) (16) Asia (Japan only) 11 25 36 MetLife Holdings 14 28 39 (17) (27) (34) Corporate & Other 2 13 31 (21) (42) (65) Total Adjusted Earnings Impact adjusted earnings impact $ 40 (38) $ 110 (97) $ 170 (138)
Read it in 10-K 2026-02-19 at sec.gov ↗
RewordedMD&A
Years Ended December 31, 2025 2024 2023 Asset Class Yield% (1) Amount Yield% (1) Amount (Dollars in millions) Fixed maturity securities (2), (3) 4.54% $ 13,765 4.44% $ 13,089 4.20% $ 12,499 Net mortgage Mortgage loans (3), (4) (3) 5.20 4,096 5.29 4,378 5.15 4,353 Real estate and real estate joint ventures REJVs 3.48 475 (0.12) (15) 0.12 16 Policy loans 5.63 449 5.60 453 5.41 471 Equity securities 4.26 23 4.38 23 3.61 31 Other limited partnership interests 8.28 1,194 6.73 965 3.10 455 Cash and short-term investments 4.26 903 5.04 961 5.73 811 Other invested assets 1,142 1,414 1,666 Investment income 4.91% $ 22,047 4.80% $ 21,268 4.58% $ 20,302 Investment fees and expenses (0.14) (614) (0.13) (595) (0.13) (553) Net investment income including divested businesses (5) (4) 4.77% $ 21,433 4.67% $ 20,673 4.45% $ 19,749 Less: net investment income from divested businesses (5) (4) 1 — 1 Adjusted net investment income $ 21,432 $ 20,672 $ 19,749
Read it in 10-K 2026-02-19 at sec.gov ↗
RewordedMD&A
Years Ended December 31, 2025 2026 2027 2028 (In millions, net of income tax) Revenues Net Derivative Gains (Losses) derivative gains (losses) $ (200) 255 $ 2 57 $ 13 40 Expenses Market Risk Benefit Remeasurement (Gains) Losses risk benefit remeasurement (gains) losses $ 332 181 $ 23 (8) $ (7) Adjusted Earnings earnings Group Benefits $ 6 8 $ 19 21 $ 33 25 RIS 7 25 31 (3) 15 20 Asia (Japan only) 11 25 36 MetLife Holdings 14 17 28 39 35 Corporate & Other 2 13 31 22 44 66 Total Adjusted Earnings Impact adjusted earnings impact $ 40 44 $ 110 108 $ 170 146
Read it in 10-K 2026-02-19 at sec.gov ↗
RewordedMD&A
Capital contributions to subsidiaries 379 — 237 237 450 450 Long-term debt repaid — unaffiliated 1,000 — 1,438 — 1,000 — Interest paid on debt and financing arrangements — unaffiliated 903 903 870 870 807 807 Dividends on common stock 1,509 — 1,527 — 1,566 — Treasury stock acquired in connection with share repurchases 2,853 — 3,177 — 3,103 — Dividends on preferred stock 194 194 200 200 198 198 Issuances Redemption of preferred stock and (repayments on) loans to subsidiaries and related interest, net (3) preferred stock redemption premium 1,000 — — 233 233 — Other, net (4) 20 (255) — — Total uses 7,858 842 7,449 1,307 7,357 1,688 Net increase (decrease) in liquid assets, MetLife, Inc.
Read it in 10-K 2026-02-19 at sec.gov ↗
RewordedMD&A
Capital contributions to subsidiaries 600 60 34 34 9 9 Repayments on and (issuance of) (issuances) of loans to subsidiaries and affiliates and related interest, net 23 23 21 21 107 107 Dividends and returns of capital to MetLife, Inc. 458 458 1,583 1,583 2,032 2,032 Other, net 518 505 562 502 483 487 Total uses 1,599 1,046 2,200 2,140 2,631 2,635 Net increase (decrease) in liquid assets, Other MetLife Holding Companies 620 (83) 117 Liquid assets, beginning of year 944 1,027 910 Liquid assets, end of year $ 1,564 $ 944 $ 1,027 Free Cash Flow, cash flow, Other MetLife Holding Companies 1,173 (23) 113 Net increase (decrease) in liquid assets, All Holding Companies $ (1,504) $ (134) $ (148) Free Cash Flow, cash flow, All Holding Companies (5) $ 4,890 $ 4,559 $ 3,632
Read it in 10-K 2026-02-19 at sec.gov ↗
RewordedMD&A
Adjusted premiums, fees and other revenues, net of foreign currency fluctuations, increased $1.2 $5.2 billion, or 2%, 10%, compared to 2023, 2024, primarily due to growth in both core the pension risk transfer and voluntary products U.K. longevity reinsurance businesses in the Group Benefits segment and RIS segment, strong sales and solid persistency across the region in the Latin America segment, partially offset by the expected decline and growth in both core and voluntary products in the MetLife Holdings segment from business run-off. Group Benefits segment.
Read it in 10-K 2026-02-19 at sec.gov ↗
RewordedMD&A
Mortality Effect of an increase by 1% $ 2 1 $ — $ (2) (1) $ — Effect of a decrease by 1% $ (2) — $ — $ 2 — $ — Lapse Effect of an increase by 10% $ (21) (11) $ 23 (1) $ 12 $ (2) Effect of a decrease by 10% $ 20 10 $ (22) 1 $ (11) $ 2 Nonperformance risk (1) Effect of an increase by 50 bps $ (173) N/A (160) $ 173 (21) $ (21) $ 160 Effect of a decrease by 50 bps $ 190 N/A 177 $ (190) 24 $ 24 $ (177)
Read it in 10-K 2026-02-19 at sec.gov ↗
RewordedMD&A
U.S. corporate $ 4,911 $ 790 Foreign corporate 405 Foreign U.S. government 355 and agency 3,816 78 Residential mortgage-backed securities (“RMBS”) 2,987 286 Foreign corporate 2,329 405 Asset-backed securities and collateralized loan obligations (collectively, “ABS & CLO”) 2,139 201 CMBS Commercial mortgage-backed securities (“CMBS”) 812 165 Foreign government 720 355 Municipals 486 111 U.S. government and agency 78 Total fixed maturity securities AFS 18,200 2,391 Net mortgage Equity securities 105 — Mortgage loans:
Read it in 10-K 2026-02-19 at sec.gov ↗
RewordedMD&A
Investing activities, net 15,607 11,493 10,246 Net change in payables for collateral under securities loaned and other transactions 25 244 3,283 Long-term debt repaid 1,383 1,792 1,035 Collateral financing arrangement repaid 124 161 79 Derivatives with certain financing elements and other derivative-related transaction, transactions, net 247 157 74 Net change in mortgage loan secured financing 802 597 163 Treasury stock acquired in connection with share repurchases 2,883 3,207 3,103 Redemption of preferred stock 988 — Preferred stock redemption premium 12 — Dividends on preferred stock 194 200 198 Dividends on common stock 1,509 1,527 1,566 Other, net 261 — 139 Effect of change in foreign currency exchange rates on cash and cash equivalents — 545 91 Total uses 24,035 19,923 19,977 Net increase (decrease) in cash and cash equivalents $ 1,964 $ (571) $ 444
Read it in 10-K 2026-02-19 at sec.gov ↗
Quiet changesMD&A
However, For example, during inflationary periods with rising interest rates, the value of fixed income investments falls which could increase realized and unrealized losses, resulting in additional deferred tax assets that may not be realizable.
Read it in 10-K 2026-02-19 at sec.gov ↗
Quiet changesMD&A
For the vast majority most of our investments, sensitivity analysis regarding unobservable inputs is not necessary or appropriate, as they are valued using quoted prices, as described above.
Read it in 10-K 2026-02-19 at sec.gov ↗
Quiet changesMD&A
Our investment portfolio is heavily weighted toward fixed income investments, with the vast majority most of our portfolio invested in fixed maturity securities AFS and mortgage loans.
Read it in 10-K 2026-02-19 at sec.gov ↗
Quiet changesMD&A
Our sub-prime RMBS portfolio consists predominantly of securities that were purchased at significant discounts to par value and discounts to the expected principal recovery value of these securities, and the vast majority most are investment grade under NAIC designations.
Read it in 10-K 2026-02-19 at sec.gov ↗