MIDDLEBY Corp MIDD
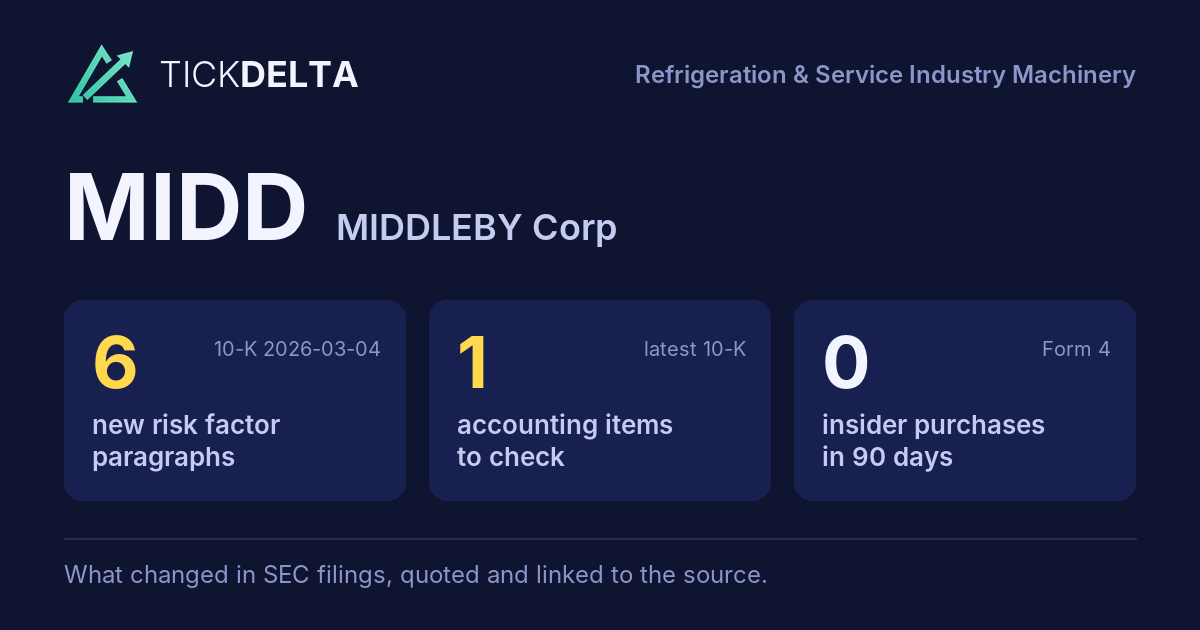
The biggest changes in the 10-K filed Mar 4, 2026, in management's words
10-K, Item 7This fiscal year against the last, and the sentences in the MD&A where management explains each change. Tickdelta picks sentences that name the line, a direction and a cause. It does not write explanations of its own.
Net income
Big change, FY to Jan 3, 2026 vs Dec 28, 2024
The MD&A has no sentence that names a cause for this change.
Operating margin
Big change, FY to Jan 3, 2026 vs Dec 28, 2024
“Selling, general and administrative expenses reflect increased costs of $24.0 million associated with acquisitions, including $4.9 million of intangible amortization expense.”
Read it in the 10-K
“Selling, general and administrative expenses reflect increases in strategic transaction costs of $19.8 million, combined compensation costs and share-based compensation of $12.5 million, advertising and trade show expenses of $9.2 million, commissions of $5.9 million, travel expenses of $3.2 million and professional fees of $2.1 million.”
Read it in the 10-K
Cash from operations
Change, FY to Jan 3, 2026 vs Dec 28, 2024
The MD&A has no sentence that names a cause for this change.
Gross margin
Change, FY to Jan 3, 2026 vs Dec 28, 2024
“Excluding acquisitions, gross profit decreased by $26.9 million due to lower sales volume and product mix.”
Read it in the 10-K
Revenue
Change, FY to Jan 3, 2026 vs Dec 28, 2024
“The decrease in international sales is related to slow market conditions, primarily in the Latin American markets.”
Read it in the 10-K
“The decrease in domestic sales is driven by decreased sales volumes of protein and bakery products.”
Read it in the 10-K
What management said, year by year
The cause given in each 10-K, 2 fiscal years, newest first · MD&A (Item 7)
Each bar is how the line changed that year (from the same 10-K's XBRL). Under it, the sentence in that year's MD&A that names the line, a direction and a cause, word for word. A year with no sentence says so.
Revenue
2 of 2 years explained-
FY 2026 +1.6%
“The decrease in international sales is related to slow market conditions, primarily in the Latin American markets.”
Read it in the FY 2026 10-K“The decrease in domestic sales is driven by decreased sales volumes of protein and bakery products.”
Read it in the FY 2026 10-K -
FY 2024 -4.0%
“The increase in international revenues is related to improvements in market conditions, primarily in the European and Latin American markets.”
Read it in the FY 2024 10-K“The decrease in domestic sales is driven primarily by lower sales volumes of protein products.”
Read it in the FY 2024 10-K
Gross margin
2 of 2 years explained-
FY 2026 -0.6 pts
“Excluding acquisitions, gross profit decreased by $26.9 million due to lower sales volume and product mix.”
Read it in the FY 2026 10-K -
FY 2024 -0.1 pts
“Gross profit decreased to $1,470.4 million in fiscal 2024 as compared to $1,534.1 million in fiscal 2023, primarily driven by lower sales volumes at the Commercial Foodservice Equipment Group and Residential Kitchen Equipment Group.”
Read it in the FY 2024 10-K
Operating margin
2 of 2 years explained-
FY 2026 -2.5 pts
“Selling, general and administrative expenses reflect increased costs of $24.0 million associated with acquisitions, including $4.9 million of intangible amortization expense.”
Read it in the FY 2026 10-K“Selling, general and administrative expenses reflect increases in strategic transaction costs of $19.8 million, combined compensation costs and share-based compensation of $12.5 million, advertising and trade show expenses of $9.2 million, commissions of $5.9 million, travel expenses of $3.2 million and professional fees of $2.1 million.”
Read it in the FY 2026 10-K -
FY 2024 +1.2 pts
“Selling, general and administrative expenses reflect increased costs of $8.9 million associated with acquisitions, including $1.6 million of intangible amortization expense.”
Read it in the FY 2024 10-K“Selling, general and administrative expenses reflect increased costs of $33.6 million associated with acquisitions, including $5.6 million of non-cash intangible amortization expense.”
Read it in the FY 2024 10-K
Net income
1 of 2 years explained-
FY 2026 -164.8%
The FY 2026 MD&A has no sentence that names a cause for this change.
-
FY 2024 +6.9%
“The effective tax rates in 2024 and 2023 were higher than the federal tax rate of 21% primarily due to state taxes and foreign tax rate differentials.”
Read it in the FY 2024 10-K
Cash from operations
1 of 2 years explained-
FY 2026 -8.2%
The FY 2026 MD&A has no sentence that names a cause for this change.
-
FY 2024 +9.2%
“During fiscal 2024, working capital changes contributed to operating cash flows primarily driven by decreased inventory levels of $95.4 million, offset by an increase in prepaid expenses and other assets of $45.5 million, including impacts from the timing of payments and status of over-time revenue contracts, and a decrease in accounts payable of $21.9 million.”
Read it in the FY 2024 10-K
Changes are computed from the XBRL figures in the same 10-K. Hover a number to see the line item. Open the 10-K
Sources
The Management's Discussion and Analysis (Item 7) of the latest 10-K, quoted word for word; the changes are computed from the same 10-K's XBRL.
Also
Financials: the numbers year by year.
Work with it
Excel workbook · CSV. Google Sheet that stays up to date: paste =IMPORTDATA("https://tickdelta.com/company/MIDD/export.csv") into a cell.