MKS Inc MKSI
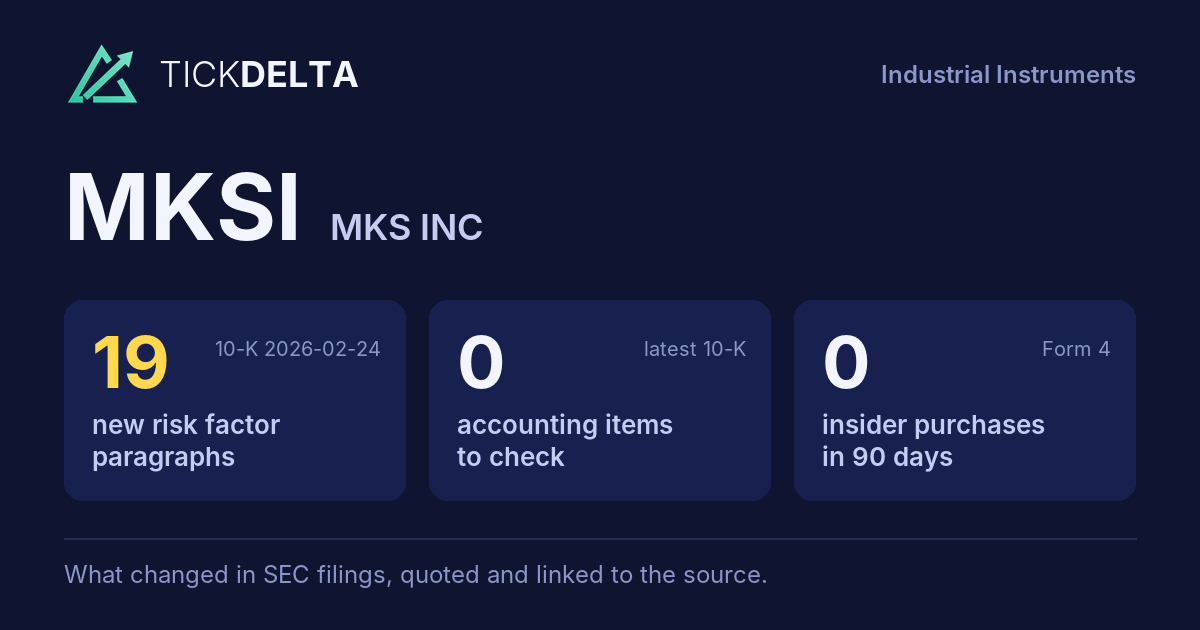
The biggest changes in the 10-K filed Feb 24, 2026, in management's words
10-K, Item 7This fiscal year against the last, and the sentences in the MD&A where management explains each change. Tickdelta picks sentences that name the line, a direction and a cause. It does not write explanations of its own.
Net income
Big change, FY to Dec 31, 2025 vs Dec 31, 2024
“Our effective tax rate for 2025 was lower than the U.S. statutory tax rate, mainly due to the U.S. deduction for foreign derived intangible income (“FDII”), research and development tax credits and valuation allowance release partially offset by foreign withholding taxes and a waiver of deductions related to the U.S. base erosion payments.”
Read it in the 10-K
Cash from operations
Big change, FY to Dec 31, 2025 vs Dec 31, 2024
“Net cash provided by operating activities was $645 million for 2025 and resulted from net income of $295 million, which included non-cash charges of $275 million, mainly the result of $344 million in depreciation and amortization, partially offset by $196 million in deferred income taxes and a net decrease in working capital of $75 million.”
Read it in the 10-K
Revenue
Change, FY to Dec 31, 2025 vs Dec 31, 2024
“Net product revenues increased $312 million in 2025, compared to 2024, primarily driven by an increase of $206 million in net product revenues from our electronics and packaging market and an increase of $146 million in our semiconductor market, offset by a decrease of $41 million in our specialty industrial market.”
Read it in the 10-K
“Net service revenues increased $33 million in 2025, compared to 2024, primarily due to an increase in net service revenues in our semiconductor market, mainly at VSD, offset by a decrease of net service revenues in our electronics and packaging market, mainly at PSD and MSD.”
Read it in the 10-K
Gross margin
Change, FY to Dec 31, 2025 vs Dec 31, 2024
“Gross profit as a percentage of net product revenues decreased by 0.9 percentage points in 2025, compared to 2024, primarily due to higher duty and tariff costs and unfavorable product mix, partially offset by higher revenue volumes.”
Read it in the 10-K
“Gross profit as a percentage of net service revenues decreased by 0.8 percentage points in 2025, compared to 2024, primarily due to higher duty and tariff costs and variable compensation, partially offset by lower scrap and rework.”
Read it in the 10-K
Operating margin
Change, FY to Dec 31, 2025 vs Dec 31, 2024
“Research and development expenses increased $28 million in 2025, compared to 2024, mainly due to an increase of $21 million in compensation-related costs, including salaries, fringe and variable compensation expenses and a decrease of $2 million in research and development credits and government assistance received.”
Read it in the 10-K
“Selling, general and administrative expenses increased $50 million during 2025, compared to 2024, primarily due to a $53 million increase in compensation-related costs, mainly related to salaries, fringe and variable compensation, partially offset by a $5 million reduction in consulting and professional fees.”
Read it in the 10-K
What management said, year by year
The cause given in each 10-K, 2 fiscal years, newest first · MD&A (Item 7)
Each bar is how the line changed that year (from the same 10-K's XBRL). Under it, the sentence in that year's MD&A that names the line, a direction and a cause, word for word. A year with no sentence says so.
Revenue
2 of 2 years explained-
FY 2025 +9.6%
“Net product revenues increased $312 million in 2025, compared to 2024, primarily driven by an increase of $206 million in net product revenues from our electronics and packaging market and an increase of $146 million in our semiconductor market, offset by a decrease of $41 million in our specialty industrial market.”
Read it in the FY 2025 10-K“Net service revenues increased $33 million in 2025, compared to 2024, primarily due to an increase in net service revenues in our semiconductor market, mainly at VSD, offset by a decrease of net service revenues in our electronics and packaging market, mainly at PSD and MSD.”
Read it in the FY 2025 10-K -
FY 2024 -1.0%
“Net revenues from customers in our semiconductor market increased by $19 million, or 1%, in 2024, compared to 2023, due primarily to an increase in sales of our lithography, metrology and inspection products, which we refer to as our World Class Optics portfolio, partially offset by decreased industry spending on deposition and etch equipment for memory applications, particularly NAND, where MKS is a critical solutions provider.”
Read it in the FY 2024 10-K“Net service revenues increased $40 million in 2024, compared to 2023, primarily due to an increase in net service revenues in our semiconductor market, mainly at VSD, and an increase of net service revenues in our electronics and packaging market, mainly at PSD and MSD.”
Read it in the FY 2024 10-K
Gross margin
2 of 2 years explained-
FY 2025 -0.9 pts
“Gross profit as a percentage of net product revenues decreased by 0.9 percentage points in 2025, compared to 2024, primarily due to higher duty and tariff costs and unfavorable product mix, partially offset by higher revenue volumes.”
Read it in the FY 2025 10-K“Gross profit as a percentage of net service revenues decreased by 0.8 percentage points in 2025, compared to 2024, primarily due to higher duty and tariff costs and variable compensation, partially offset by lower scrap and rework.”
Read it in the FY 2025 10-K -
FY 2024 +2.3 pts
“Gross profit as a percentage of net product revenues increased by 1.4 percentage points in 2024, compared to 2023, primarily due to favorable product mix, higher factory utilization and lower excess and obsolete inventory charges, partially offset by higher warranty costs.”
Read it in the FY 2024 10-K“Gross profit as a percentage of net service revenues increased by 8.3 percentage points in 2024, compared to 2023, primarily due to favorable product mix and lower direct labor and overhead cost on repairs.”
Read it in the FY 2024 10-K
Operating margin
2 of 2 years explained-
FY 2025 -0.5 pts
“Research and development expenses increased $28 million in 2025, compared to 2024, mainly due to an increase of $21 million in compensation-related costs, including salaries, fringe and variable compensation expenses and a decrease of $2 million in research and development credits and government assistance received.”
Read it in the FY 2025 10-K“Selling, general and administrative expenses increased $50 million during 2025, compared to 2024, primarily due to a $53 million increase in compensation-related costs, mainly related to salaries, fringe and variable compensation, partially offset by a $5 million reduction in consulting and professional fees.”
Read it in the FY 2025 10-K -
FY 2024 +56.8 pts
“Research and development expenses decreased $17 million in 2024, compared to 2023, mainly due to decreases of $8 million in compensation-related costs, including salaries, fringe and variable compensation expenses, a decrease of $2 million in engineering consulting fees, and a decrease of $5 million of research and development credits and government assistance received in 2024.”
Read it in the FY 2024 10-K“Selling, general and administrative expenses decreased $1 million during 2024, compared to 2023, primarily due to a $20 million decrease in compensation-related costs, mainly related to salaries, fringe and variable compensation and a $14 million reduction in net costs mostly incurred in 2023 due to the ransomware event in February 2023.”
Read it in the FY 2024 10-K
Cash from operations
2 of 2 years explained-
FY 2025 +22.2%
“Net cash provided by operating activities was $645 million for 2025 and resulted from net income of $295 million, which included non-cash charges of $275 million, mainly the result of $344 million in depreciation and amortization, partially offset by $196 million in deferred income taxes and a net decrease in working capital of $75 million.”
Read it in the FY 2025 10-K -
FY 2024 +65.5%
“Net cash provided by operating activities was $528 million for 2024 and resulted from net income of $190 million, which included non-cash charges of $334 million, offset by a net decrease in working capital of $4 million.”
Read it in the FY 2024 10-K
Changes are computed from the XBRL figures in the same 10-K. Hover a number to see the line item. Open the 10-K
Sources
The Management's Discussion and Analysis (Item 7) of the latest 10-K, quoted word for word; the changes are computed from the same 10-K's XBRL.
Also
Financials: the numbers year by year.
Work with it
Excel workbook · CSV. Google Sheet that stays up to date: paste =IMPORTDATA("https://tickdelta.com/company/MKSI/export.csv") into a cell.