Form 10-K for the Fiscal Year Ended December 31, 2021
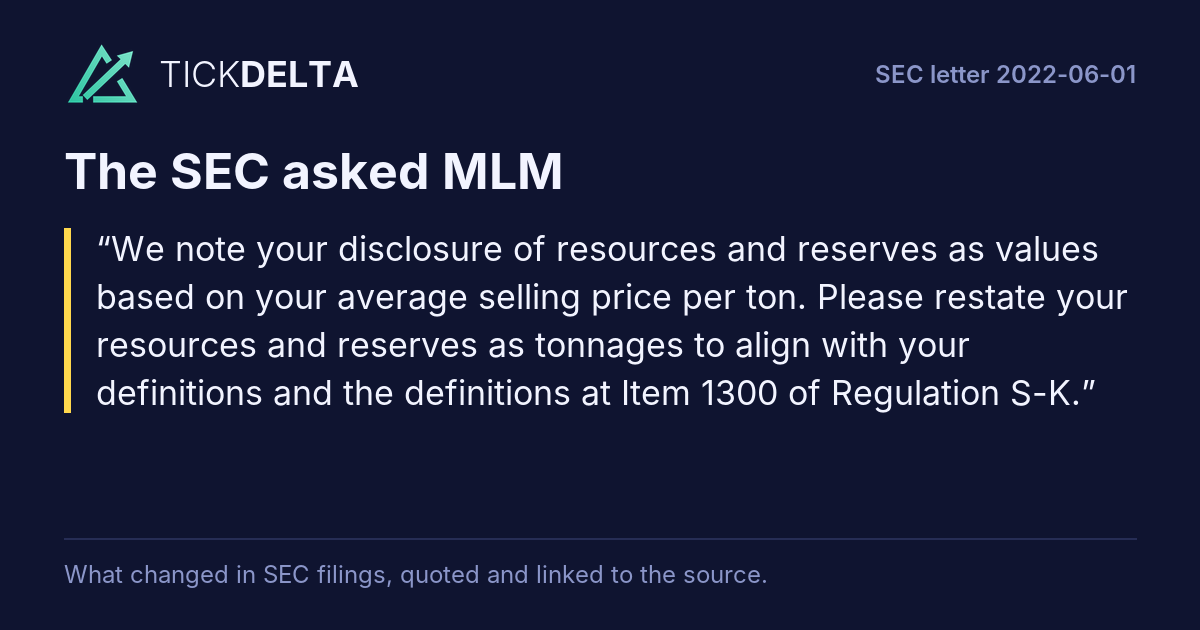
We note your disclosure of resources and reserves as values based on your average selling price per ton. Please restate your resources and reserves as tonnages to align with your definitions and the definitions at Item 1300 of Regulation S-K.
The new tables relating to mineral resources and mineral reserves contain a column entitled “Amount.” Based on our review of the new rules, guidance, and conversations with our counsel and the Staff, we believed that the rules required a reasonable and justifiable price for each commodity, and not the tonnage. Accordingly, the Company presented the mineral resources and mineral reserves tables in
4123 Parklake Avenue, Raleigh, North Carolina 27612-2309 t. (919) 783-4660 e.Read in the reply ↗Rest of the answer
jim.nickolas@martinmarietta.com www.martinmarietta.com dollars based on the average selling prices disclosed in footnote 1 to the tables. The amount disclosed represents the mineral reserves and mineral resources multiplied by a reasonable and justifiable price selected by the Company, together with the time frame and point of reference used to estimate the amount of mineral resources and mineral reserves. In future filings, the Company will present the data in the tables in tonnages and continue to disclose the reasonable and justifiable prices in footnotes to the tables. The following presents the information in tonnage as of December 31, 2021:
Summary Mineral Resources 1,2
At End of Fiscal Year Ended December 31, 2021 Based on Average Selling Price
Measured Mineral
Resources
Indicated Mineral
Measured + Indicated
Mineral Resources
Inferred Mineral Resources
Tons (in 000s)
Grades/Qualities
Crushed Stone
East Division
144,299
30,584
174,883
-
Central Division
22,730
Southwest Division
West Division
85,240
233,708
318,948
Total Crushed Stone
229,539
287,022
516,561
Sand & Gravel
1,102
35,496
36,598
59,839
143,191
203,030
Total Sand & Gravel
60,941
178,687
239,628
Summary Mineral Reserves 1,2
Proven Mineral Reserves
Probable Mineral Reserves
Total Mineral Reserves
4,668,816
3,676,719
8,345,535
1,510,294
1,420,788
2,931,082
2,297,842
1,724,114
4,021,956
372,711
600,000
972,711
8,849,663
7,421,621
16,271,284
65,461
110,783
176,244
236,794
70,436
307,230
56,687
86,125
142,812
179,120
44,444
223,564
538,062
311,788
849,850
There is a range of selling prices for each product category and each geography that depend on the type of product, whether it is washed or not, and its end use. The average selling price per ton used for crushed stone for the East Division, Central Division, Southwest Division and West Division was $15.65, $14.08, $10.46 and $11.53, respectively. The average selling price per ton used for sand and gravel for the East Division, Central Division, Southwest Division and West Division was $10.66, $10.73, $13.28 and $13.52, respectively. These prices exclude any portion of revenues allocated to freight, including internal freight to ship products from a producing quarry to a distribution terminal and third-party freight to deliver product to a customer.
First report after the company's reply of 2022-06-14: 10-Q filed 2022-07-28 ↗, against the 10-Q filed 2022-05-03 ↗.
Tickdelta does not hold the text of both reports, so they are not compared here.
We note your resource and reserve disclosure does not include the price used to determine your economic resources and reserves. See footnote to Table 1 & 2 to Item 1303(b)(3) of Regulation S-K.
The Company disclosed the price used to determine the economic resources and reserves for each product category and geographic division. The amounts represent reasonable and justifiable prices for the aggregates commodity. Additionally, the time frame and point of reference used by a qualified person are also disclosed as the Company’s average selling prices for 2021.
The Company included the following footnote 1 to the summary mineral resources and summary mineral reserves tables in the Form 10-K for the year ended December 31, 2021:
The amounts, presented in millions, were determinedRead in the reply ↗Rest of the answer
using the 2021 average selling price per ton for that product category in that geographic division. There is a range of selling prices for each product category and each geography that depend on the type of product, whether it is washed or not, and its end use. The average selling price per ton used for crushed stone for the East Division, Central Division, Southwest Division and West Division was $15.65, $14.08, $10.46 and $11.53, respectively. The average selling price per ton used for sand and gravel for the East Division, Central Division, Southwest Division and West Division was $10.66, $10.73, $13.28 and $13.52, respectively. These prices exclude any portion of revenues allocated to freight, including internal freight to ship products from a producing quarry to a distribution terminal and third-party freight to deliver product to a customer.
First report after the company's reply of 2022-06-14: 10-Q filed 2022-07-28 ↗, against the 10-Q filed 2022-05-03 ↗.
Tickdelta does not hold the text of both reports, so they are not compared here.
We note your response to comment 2 indicating your original filing disclosed the reserve prices and that no change was necessary. Your original filing used the average selling price to estimate a value for your resources and reserves by region and material classification.Rest of the question
Your proposed revision to the resource and reserve tables only discloses your regional average selling prices by region and material classification. Please disclose the resource/reserve prices used to estimate your resources and reserves, which are separate from your average selling price. See Items 1302(e)(4) and1303(b)(3)(iv) of Regulation S-K.
Based on our review of the new rules, guidance, and conversations with the Staff, including the Office Chief for Energy and Transportation, management concluded that 2021 average selling prices represent a proxy for reasonable and justifiable prices for the Company’s mineral reserves and mineral resources.
4123 Parklake Avenue, Raleigh, North Carolina 27612-2309 t.Read in the reply ↗Rest of the answer
(919) 783-4660 e.jim.nickolas@martinmarietta.com www.martinmarietta.com
The distinction between mineral reserves and mineral resources is based on the proximity and extent of drilling, which in part is determined based on the anticipated heterogeneity of the deposit. In addition to determining quantity, the Company’s drilling and testing evaluates the quality of the deposit to ensure it is economically viable. In subsequent periods, more extensive drilling and testing can support reclassifying mineral resources to mineral reserves.
There are no public indices or other spot prices for our minerals, nor does the Company have national contracts that set prices or values of minerals. As such, and in accordance with Regulation S-K section 1302(e)(4), the Company believes average selling prices represent the most appropriate metric to disclose as a reasonable and justifiable price. Further, the Company, as well as its domestic competitors in the aggregates industry, has a history of increasing selling prices annually. As disclosed in the 2021 Form 10-K, the Company’s mineral reserves average 78 years at the 2021 production level. In consideration of Regulation S-K section 1303(b)(3)(iv), there will be a large range of prices when these mineral reserves and mineral resources are sold over that time period. However, future selling prices are expected to (i) exceed the 2021 prices disclosed in the 2021 Form 10-K; and (ii) exceed increases in future production costs, including extraction. As such, expected future prices will not impact the tons of mineral reserves or mineral resources disclosed by the Company, as they are all deemed economically mineable.
As disclosed in the Company’s 2021 Form 10-K, selling prices are determined locally and vary depending on several factors, including whether products are washed after extracted and by end use. The Company believes that market-based pricing of reserves reflects a reasonable estimate of their value, and mineral resources that are eventually sold generally realize similar pricing to deposits currently classified as mineral reserves. Therefore, the Company believes that average selling prices represent a reasonable and justifiable price to estimate the amount of mineral reserves and mineral resources. Note that the average selling prices disclosed by the Company in the 2021 mineral reserves and mineral resources tables exclude any component allocated to freight costs incurred to either transport products internally or when delivery is arranged with a third party to deliver products to customers.
We note your response to comment 1 that the 2021 January through December regional average selling price is a reasonable and justifiable price to estimate your Company’s mineral reserves and mineral resources. Your resource/reserve estimates may not be compliant as the qualified persons estimating your resources and reserve must disclose the prices used to prepare their estimates establishing economic viabilityRest of the question
within the prescribed accuracy limits for each of your properties. This may require your 267 technical report summaries to have a cash flow analysis prepared for each of your properties after the fiscal year end, which may not be possible or allow for timely periodic filings. For your information, many other companies use a historic average based on the previous year or multiple years. Please revise your disclosure to disclose how you determined your reasonable and justifiable prices and specify the timeframe of your reserve/resource prices. See Item 1302(e)(3) and Item 1302(e)(4) of Regulation S-K.
We have received your letter dated August 3, 2022 on the above-referenced matter. In light of the staff’s offer to schedule a conference on August 17, 2022 to discuss matters relevant to the comments raised in that letter, we would intend to provide Martin Marietta’s response to those comments within ten business days after August 17, 2022. Read in the reply ↗
Also in this review: company letter, 2022-08-24, closing letter, 2022-09-12