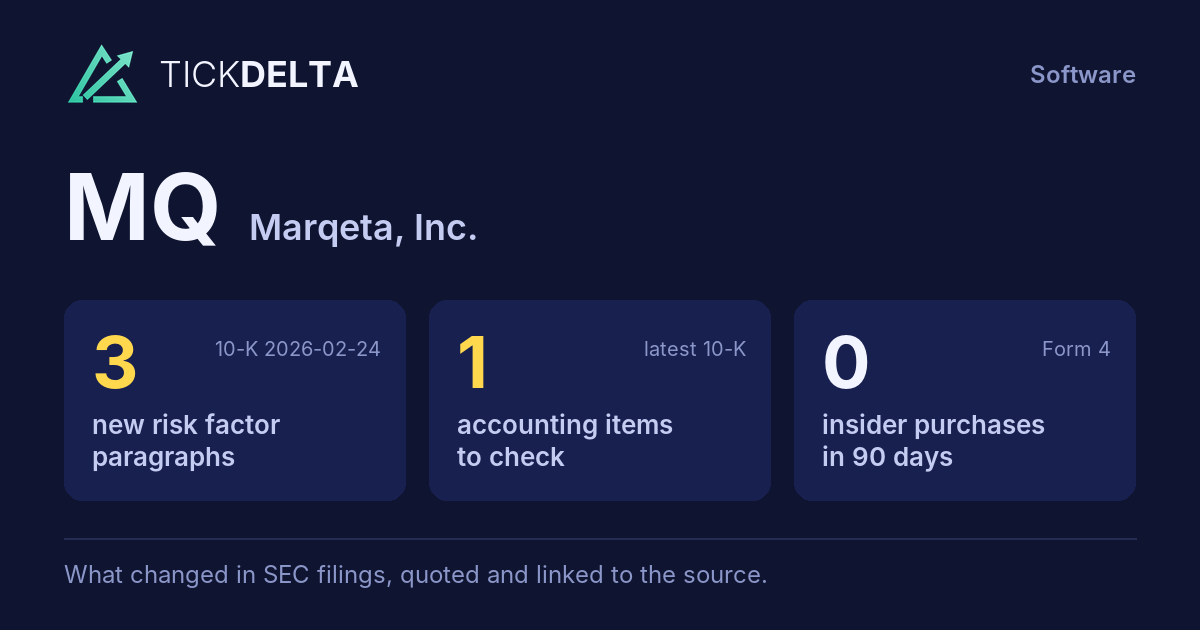
Screener / SEC EDGAR /CIK 0001522540 /10-K filed Feb 24, 2026, compared with Feb 26, 2025 /Numbers from the XBRL of the 10-Ks
Nasdaq Technology · Software

Marqeta, Inc. MQ

Compare with peers Embed
Earnings releases

Latest results release: Nov 3, 2026

8-K item 2.02, exhibit 99

What MQ's management wrote with each quarter's results: the press release and, when the company files them, its prepared remarks or the call transcript. The call itself is not filed with SEC, so most quarters have the release only.

Adjusted vs GAAP earnings per share

In the company's own words · read from each release, never computed

What the company says its adjusted numbers leave out:

We define Adjusted EBITDA as net income (loss) adjusted, as applicable, to exclude depreciation and amortization; share-based compensation expense; payroll tax related to share-based compensation; restructuring and other one-time costs; non-recurring litigation expense; acquisition-related expenses which consist of due diligence costs, transaction costs and integration costs related to potential or successful acquisitions, and cash and non-cash postcombination compensation expenses; income tax expense (benefit); and other income (expense), net, which primarily consists of interest income from our short-term investments and cash deposits, and realized foreign currency gains and losses. release Nov 3, 2026

Both numbers are read from the words of each release (usually the highlights), never computed by us; hover a number for its sentence. Quarters where the release gives them only in a table are not shown. The company decides what "adjusted" leaves out; the full reconciliation is in the release.

Read and search

Every release, in full · linked to sec.gov

Press release Nov 3, 2026 · EX-99.1

MARQETA REPORTS THIRD QUARTER 2026 FINANCIAL RESULTS

Open on SEC

, the global modern card issuing platform, today reported financial results for the third quarter ended September 30, 2026.

The Company reported Total Processing Volume (TPV) of $126 billion, representing a year-over-year increase of 29%. Marqeta reported Net Revenue of $176 million and Gross Profit of $122 million, growing 8% and 7% year-over-year, respectively. GAAP Net Income for the quarter was $115 million, which includes a $107 million discrete non-cash income tax benefit from the release of valuation allowances on certain deferred tax assets. Adjusted EBITDA was $39 million, growing 28% year-over-year.

“Our third quarter results demonstrate the durable, differentiated business Marqeta is building, as well as our focus on enhancing the platform that customers trust to build and scale their payment programs,” said Mike Milotich, CEO of Marqeta. “TPV surpassed a $500 billion annualized run rate for the first time, Adjusted EBITDA margin set a new high-water mark, and we delivered our third consecutive quarter of GAAP profitability. From Square's credit card on the American Express Network to Google Wallet for kids, the programs we are launching show how the range, flexibility, and scale of our platform are helping leading companies deliver innovative payment experiences.”

Marqeta has been at the forefront of modern issuer processing for over a decade, enabling growth and innovation for customers across diverse use cases and geographies. Marqeta highlighted several recent updates that demonstrate its current business momentum, including:

• Marqeta now enables the Square Credit Card on the American Express Network, extending a relationship that already includes Square's debit card program. Marqeta's portfolio migration capabilities allowed Square to move existing accounts and card credentials onto Marqeta's platform without disruption to the cardholder experience, giving Square a single platform on which to build and iterate card products for sellers. This program is Marqeta's first on the American Express Network.

• Marqeta expanded its longstanding collaboration with Google to provide a new offering in Google Wallet for kids. Marqeta's tokenization and spend control capabilities enable a safer, digital-first way for kids and teens to receive and spend money without a traditional bank account, with parents able to set daily spending limits, monitor activity, and lock or unlock the balance.

• Marqeta enabled Satispay, a leading payments company in Italy with more than 6.5 million users and 450,000 merchants, to launch its consumer debit card program, allowing users to pay with Satispay anywhere in the world, in-store and online.

• Marqeta is partnering with Coinbase to give its enterprise customers a single platform for payment offerings across fiat and digital asset markets, expanding a relationship in which Marqeta already issues Coinbase’s crypto-backed cards. Coinbase’s infrastructure and global reach strengthen Marqeta’s ecosystem of stablecoin infrastructure partners, which also includes zerohash and BVNK. These partnerships give customers a comprehensive solution for launching multinational, stablecoin-backed cards that connect directly to existing card rails, so stablecoins can be used anywhere a card is accepted.

1 TPV represents the total dollar amount of payments processed through our platform, net of returns and chargebacks. We believe that TPV is a key indicator of the market adoption of our platform, growth of our brand, growth of our customers' businesses and scale of our business.

2 See "Information Regarding Non-GAAP Measures" for definitions of Adjusted EBITDA, Adjusted EBITDA margin, and Adjusted operating expenses and the reconciliations of the net income (loss) to Adjusted EBITDA, and of the total operating expenses to Adjusted operating expenses.

3 Reflects the one-for-four reverse stock split that became effective on June 30, 2026. All historical share and per-share amounts have been retroactively adjusted to reflect the reverse stock split. As a result, weighted-average shares outstanding decreased by a factor of four, and net income (loss) per share increased by a factor of four for all prior periods presented. nm - Not meaningful

increased by 29% year-over-year, from $98 billion in the third quarter of 2025 to $126 billion for the quarter ended September 30, 2026.

of $176 million increased by $13 million, or 8%, year-over-year, primarily driven by higher volumes, partially offset by unfavorable mix due to faster growth of card programs where we provide processing services with minimal or no program management.

increased by 7% year-over-year to $122 million from $115 million in the third quarter of 2025. The increase in Gross Profit was largely driven by our TPV growth. Gross Margin was 69% in the third quarter of 2026.

of $115 million in the quarter, compared to a Net Loss of $4 million in the same period in the prior year, a year-over-year improvement of $119 million. This includes a $107 million discrete non-cash income tax benefit from the release of valuation allowances on certain deferred tax assets. Net income margin in the quarter was 66%, an increase of 68 percentage points versus last year, which includes the impact of the discrete income tax benefit.

was $39 million in the third quarter of 2026, an increase of $8 million year- over-year, or 28%. Adjusted EBITDA margin was 22% in the third quarter of 2026, an increase of 3 percentage points versus last year.

The following summarizes Marqeta's guidance for the fourth quarter of 2026 and full year of 2026:

Fourth Quarter 2026 Fiscal Year 2026 Net Revenue Growth 3 - 5% 11 - 12% Gross Profit Growth 5 - 7% 11 - 12% Adjusted EBITDA Growth(1) Mid 20s Low-to-Mid 30s (1)Adjusted EBITDA Growth represents the year-over-year percentage change in Adjusted EBITDA. See "Information Regarding Non-GAAP Measures" for the definition of Adjusted EBITDA Margin and for information regarding non-availability of a forward reconciliation.

Marqeta will host a live conference call today at 1:30 p.m. Pacific time (4:30 p.m. Eastern time). To join the call, please dial-in 10 minutes in advance: toll-free at 1-877-407-4018 or direct at 1-201-689-8471. The conference call will also be available live via webcast online at http://investors.marqeta.com.

The telephone replay dial-in numbers are 1-844-512-2921 and 1-412-317-6671 and will be available until November 17, 2026, 8:59 p.m. Pacific time (11:59 p.m. Eastern time). The confirmation code for the replay is 13762621.

This press release contains "forward-looking statements" within the meaning of the "safe harbor" provisions of the Private Securities Litigation Reform Act of 1995. Forward-looking statements expressed or implied in this press release include, but are not limited to, statements relating to Marqeta’s quarterly and annual guidance; statements regarding Marqeta’s profitability; statements regarding Marqeta’s customers, their growth, and their plans to onboard Marqeta's offerings; statements regarding Marqeta's new collaborations, product introductions, and product capabilities, and the benefits those collaborations, products, or capabilities may have for customers; statements regarding Marqeta's ability to enable growth for its customers; statements regarding the impact of income tax benefits or liabilities; and statements made by Marqeta’s Chief Executive Officer. Actual results may differ materially from the expectations contained in these statements due to risks and uncertainties, including, but not limited to, the following: the risk that Marqeta is unable to maintain profitability; the risk that Marqeta is unable to further attract, retain, diversify, and expand its customer base; the risk that Marqeta is unable to drive increased profitable transactions on its platform; the risk that consumers and customers will not perceive the benefits of Marqeta’s products, including credit card issuing; the risk that Marqeta's platform does not operate as intended resulting in system outages; the risk that Marqeta will not be able to achieve the cost structure that Marqeta currently expects; the risk that Marqeta’s solutions will not achieve the expected market acceptance; the risk that competition could reduce expected demand for Marqeta’s services, including credit card issuing; the risk that changes in the regulatory landscape could adversely affect Marqeta's operations and revenues; the risk that Marqeta may be unable to maintain relationships with Issuing Banks and Card Networks; the risk that Marqeta is not able to identify, close and recognize the anticipated benefits of any acquisition; the risk that Marqeta is unable to successfully integrate any acquisition, to businesses and related operations; the risk of general economic conditions in either domestic or international markets, including inflation and recessionary fears, conditions resulting from geopolitical uncertainty and instability or war; the risk of changes to Marqeta's expectations regarding income tax liabilities, including any changes regarding foreign taxes, realizability of deferred tax assets, valuation allowances, and the adequacy of reserves; and the risk that Marqeta may be subject to additional risks due to its international business activities. Detailed information about these risks and other factors that could potentially affect Marqeta’s business, financial condition, and results of operations are included in the “Risk Factors” disclosed in Marqeta's Annual Report on Form 10-K for the year ended December 31, 2025 and subsequent Quarterly Reports, as such risk factors may be updated from time to time in Marqeta’s periodic filings with the SEC, available at www.sec.gov and Marqeta’s website at http://investors.marqeta.com .

The forward-looking statements in this press release are based on information available to Marqeta as of the date hereof. Marqeta disclaims any obligation to update any forward-looking statements, except as required by law .

Investors and others should note that Marqeta announces material financial information to its investors using its investor relations website, SEC filings, press releases, public conference calls and webcasts. Marqeta also uses social media to communicate with its customers and the public about Marqeta, its products and services, and other matters relating to its business and market. It is possible that the information Marqeta posts on social media could be deemed to be material information. Therefore, Marqeta encourages investors, the media, and others interested in Marqeta to review the information we post on social media channels including the Marqeta X feed (@Marqeta), the Marqeta Instagram page (@lifeatmarqeta), the Marqeta Facebook page, and the Marqeta LinkedIn page. These social media channels may be updated from time to time.

Reconciliations of non-GAAP financial measures to the most directly comparable financial results as determined in accordance with GAAP are included at the end of this press release following the accompanying financial data. For a description of these non-GAAP financial measures, including the reasons management uses each measure, please see the section of the tables titled "Information Regarding Non-GAAP Financial Measures".

Marqeta (NASDAQ: MQ) enables payments innovation through its enterprise-grade modern card issuing platform. Spanning debit and credit offerings for both consumer and commercial, it provides card issuing and processing, credit services, accounts and money movement, risk and fraud, and user experience capabilities. The Company’s solutions and expertise provide customers with greater control and agility in issuing payment credentials and allow them to build and embed financial services into their branded experience. With compliance and security built-in, Marqeta’s end-to-end configurable platform is proven at scale, processing nearly $400 billion in annual payments volume in 2025 and certified to operate in more than 40 countries. To learn more, visit www.marqeta.com.

(1) Reflects the one-for-four reverse stock split that became effective on June 30, 2026. All historical share and per-share amounts have been retroactively adjusted to reflect the reverse stock split. As a result, weighted-average shares outstanding decreased by a factor of four, and net income (loss) per share increased by a factor of four for all prior periods presented.

September 30, December 31, 2026 2025 ────────────────────────────────────────────────────────────────────────────── -unaudited Assets Current assets: Cash and cash $ 697,464 $ 709,443 equivalents Restricted cash 265,445 307,593 Short-term 711 62,483 investments Accounts receivable, 40,432 41,422 net Network incentives 49,947 61,059 receivable Settlements 23,526 18,037 receivable, net Prepaid expenses and other current 30,664 35,278 assets Total current assets 1,108,189 1,235,315 Property and 69,616 59,910 equipment, net Operating lease right-of-use assets, 6,116 8,275 net Intangible assets, 43,468 51,388 net Goodwill 153,602 154,706 Other assets 120,851 15,439 Total assets $ 1,501,842 $ 1,525,033 Liabilities and stockholders' equity Current liabilities: Accounts payable $ 1,233 $ 1,847 Revenue share payable 217,038 224,526 Funds payable and amounts due to 265,344 306,891 customers Accrued expenses and other current 167,669 215,793 liabilities Total current 651,284 749,057 liabilities Operating lease liabilities, net of 3,478 5,535 current portion Other liabilities 10,411 8,484 Total liabilities 665,173 763,076 Stockholders' equity:(1) Common stock 10 11 Additional paid-in 1,518,704 1,572,270 capital Accumulated other comprehensive (loss) -1,055 1,509 income Accumulated deficit -680,990 -811,833 Total stockholders’ 836,669 761,957 equity Total liabilities and stockholders' $ 1,501,842 $ 1,525,033 equity

(1) Reflects the one-for-four reverse stock split that became effective on June 30, 2026, which has been applied retrospectively to all prior periods presented. The reverse stock split did not change the par value per share of the Company’s common stock. As a result, the aggregate par value of outstanding common stock was reduced proportionately, with a corresponding increase to additional paid-in capital. Total stockholders’ equity remained unchanged.

Nine Months Ended Cash flows from September 30, operating activities: 2026 2025 ────────────────────────────────────────────────────────────────────────────── Net income (loss) $ 130,843 $ -12,531 Adjustments to reconcile net income (loss) to net cash provided by operating activities: Benefit of deferred -104,289 — income taxes, net Share-based 63,839 78,689 compensation expense Depreciation and 28,797 19,003 amortization Non-cash operating 2,159 1,727 leases expense Accretion of discount on short-term -46 -691 investments Other 1,530 5,365 Changes in operating assets and liabilities: Accounts receivable -342 -3,834 Network incentives 11,112 18,011 receivable Settlements -5,489 587 receivable Prepaid expenses and 5,155 -2,743 other assets Accounts payable 65 -125 Revenue share payable -7,488 11,575 Accrued expenses and -37,254 -2,358 other liabilities Operating lease -2,436 -3,374 liabilities Net cash provided by operating 86,156 109,301 activities Cash flows from investing activities: Maturities of short-term 61,656 100,160 investments Capitalization of -24,586 -21,470 internal-use software Purchases of property -1,812 -1,992 and equipment Cash paid for business combination, — -44,608 net of cash acquired Restricted cash acquired in business — 229,650 combination Purchases of short-term — -3,501 investments Net cash provided by investing 35,258 258,239 activities Cash flows from financing activities: Repurchase of common -105,123 -294,788 stock Change in funds payable and amounts -41,547 4,263 due to customers Taxes paid related to net share settlement of -23,605 -28,493 restricted stock units Payment of acquisition-related contingent and -4,972 — holdback considerations Proceeds from shares issued in connection with 855 994 employee stock purchase plan Proceeds from exercise of stock options, including early exercised stock 51 1,630 options, net of repurchase of early exercised unvested options Net cash used in -174,341 -316,394 financing activities Net (decrease) increase in cash, cash -52,927 51,146 equivalents, and restricted cash Cash, cash equivalents, and restricted 1,017,931 931,516 cash- Beginning of period Cash, cash equivalents, and $ 965,004 $ 982,662 restricted cash - End of period

(1) Restricted cash consists primarily of customer funds held by TransactPay in segregated accounts in connection with its program management activities for card and e-money wallet programs.

(2) Reflects the one-for-four reverse stock split that was effective June 30, 2026, which has been applied retrospectively to all prior periods presented.

In addition to the financial measures prepared in accordance with generally accepted accounting principles in the United States (“GAAP”), this press release contains certain non-GAAP financial measures. Marqeta considers Adjusted EBITDA, Adjusted EBITDA Growth, Adjusted EBITDA Margin, Adjusted EBITDA Margin based on Gross Profit, Net Income (Loss) Margin based on Gross Profit, and Adjusted operating expenses as supplemental measures of the Company’s performance that are not required by, nor presented in accordance with GAAP.

We define Adjusted EBITDA as net income (loss) adjusted, as applicable, to exclude depreciation and amortization; share-based compensation expense; payroll tax related to share-based compensation; restructuring and other one-time costs; non-recurring litigation expense; acquisition-related expenses which consist of due diligence costs, transaction costs and integration costs related to potential or successful acquisitions, and cash and non-cash postcombination compensation expenses; income tax expense (benefit); and other income (expense), net, which primarily consists of interest income from our short-term investments and cash deposits, and realized foreign currency gains and losses. We believe that Adjusted EBITDA is an important measure of operating performance because it allows management and our board of directors to evaluate and compare our core operating results, including our operating efficiencies, from period to period. Additionally, we utilize Adjusted EBITDA as an input into our calculation of our annual employee bonus plans and performance-based restricted stock units.

Adjusted EBITDA Margin is calculated as Adjusted EBITDA divided by net revenue. Adjusted EBITDA Margin based on Gross Profit is calculated as Adjusted EBITDA divided by Gross Profit, and Net Income (Loss) Margin based on Gross Profit is calculated as Net Income (Loss) divided by Gross Profit. Adjusted EBITDA growth represents the year-over-year percentage change in Adjusted EBITDA. These measures are used by management and our board of directors to evaluate our operating efficiency.

We define Adjusted operating expenses as total operating expenses adjusted, as applicable, to exclude depreciation and amortization; share-based compensation expense; payroll tax related to share-based compensation; restructuring and other one-time costs; non-recurring litigation expense; and acquisition-related expenses which consist of due diligence costs, transaction costs and integration costs related to potential or successful acquisitions, and cash and non-cash postcombination compensation expenses. We believe that Adjusted operating expenses is an important measure of operating performance because it allows management and our board of directors to evaluate and compare our core operating results, including our operating efficiencies, from period to period.

Adjusted EBITDA, Adjusted EBITDA Growth, Adjusted EBITDA Margin, Adjusted EBITDA Margin based on Gross Profit, Net Income (Loss) Margin based on Gross Profit, and Adjusted operating expenses should not be considered in isolation, or construed as an alternative to net loss, or any other performance measures derived in accordance with GAAP, or as an alternative to cash flow from operating activities or as a measure of the Company's liquidity. In addition, other companies may calculate Adjusted EBITDA differently than Marqeta does, which limits its usefulness in comparing Marqeta’s financial results with those of other companies.

The following table shows Marqeta's GAAP results reconciled to non-GAAP results included in this release:

(1) Acquisition-related expenses, including transaction costs, integration costs, and cash and non-cash postcombination compensation expenses, are excluded from Adjusted EBITDA. These expenses are specific to a discrete transaction and do not reflect our ongoing core operations or the recurring expenses required to sustain and operate our business.

(2) Restructuring and other one-time costs include the costs related to the CEO transition and one-time retention bonuses provided to other key employees. These bonuses have service requirements and are expensed over the requisite service period.

(3) Non-recurring litigation expense includes a legal contingency expense related to the Securities Actions recorded during the three and nine months ended September 30, 2025.

(4) The income tax benefit recorded during the three and nine months ended September 30, 2026 was primarily due to the release of valuation allowances related to U.S. federal and certain states' deferred tax assets, partially offset by the income tax expense from current period activity.

A reconciliation of Adjusted EBITDA Growth to the comparable GAAP measure for the fourth quarter and full year of 2026 is not available due to the challenges and impracticability with estimating some of the items as such items cannot be reasonably predicted and could be significant. Because of those challenges, reconciliations of such forward-looking non-GAAP financial measures are not available without unreasonable effort.

Full text with the tables
                                                                                
              MARQETA REPORTS THIRD QUARTER 2026 FINANCIAL RESULTS              
                                                                                
  The global modern card issuer reported Total Processing Volume growth of 29%  
                                                                                
          and Gross Profit growth of 7% in the third quarter of 2026.           
                                                                                
  OAKLAND, Calif. – November 3, 2026                                            
                                                                                
-
                                                                                
  Marqeta, Inc. (NASDAQ: MQ)                                                    
                                                                                
, the global modern card issuing platform, today reported financial results for
the third quarter ended September 30, 2026.

The Company reported Total Processing Volume (TPV) of $126 billion, representing
a year-over-year increase of 29%. Marqeta reported Net Revenue of $176 million
and Gross Profit of $122 million, growing 8% and 7% year-over-year,
respectively. GAAP Net Income for the quarter was $115 million, which includes a
$107 million discrete non-cash income tax benefit from the release of valuation
allowances on certain deferred tax assets. Adjusted EBITDA was $39 million,
growing 28% year-over-year.

“Our third quarter results demonstrate the durable, differentiated business
Marqeta is building, as well as our focus on enhancing the platform that
customers trust to build and scale their payment programs,” said Mike Milotich,
CEO of Marqeta. “TPV surpassed a $500 billion annualized run rate for the first
time, Adjusted EBITDA margin set a new high-water mark, and we delivered our
third consecutive quarter of GAAP profitability. From Square's credit card on
the American Express Network to Google Wallet for kids, the programs we are
launching show how the range, flexibility, and scale of our platform are helping
leading companies deliver innovative payment experiences.”

Marqeta has been at the forefront of modern issuer processing for over a decade,
enabling growth and innovation for customers across diverse use cases and
geographies. Marqeta highlighted several recent updates that demonstrate its
current business momentum, including:

• Marqeta now enables the Square Credit Card on the American Express Network,
extending a relationship that already includes Square's debit card program.
Marqeta's portfolio migration capabilities allowed Square to move existing
accounts and card credentials onto Marqeta's platform without disruption to the
cardholder experience, giving Square a single platform on which to build and
iterate card products for sellers. This program is Marqeta's first on the
American Express Network.

• Marqeta expanded its longstanding collaboration with Google to provide a new
offering in Google Wallet for kids. Marqeta's tokenization and spend control
capabilities enable a safer, digital-first way for kids and teens to receive and
spend money without a traditional bank account, with parents able to set daily
spending limits, monitor activity, and lock or unlock the balance.

• Marqeta enabled Satispay, a leading payments company in Italy with more than
6.5 million users and 450,000 merchants, to launch its consumer debit card
program, allowing users to pay with Satispay anywhere in the world, in-store and
online.

• Marqeta is partnering with Coinbase to give its enterprise customers a single
platform for payment offerings across fiat and digital asset markets, expanding
a relationship in which Marqeta already issues Coinbase’s crypto-backed cards.
Coinbase’s infrastructure and global reach strengthen Marqeta’s ecosystem of
stablecoin infrastructure partners, which also includes zerohash and BVNK. These
partnerships give customers a comprehensive solution for launching
multinational, stablecoin-backed cards that connect directly to existing card
rails, so stablecoins can be used anywhere a card is accepted.
                                                                                
                                       1                                        
                                                                                
                                                                                
  Operating Highlights                                                          
                                                                                
                                                                                
  In                                                                            
  t…                                                                            
  e…                                                                            
  p…                                                                            
  a…                                                                            
  p…                                                                            
  s…                                                                            
  d…                                                                            
  u…                                                                            
  o…                                                                            
  n…                                                                            
  %                                                                             
  c…                                                                            
  is                                                                            
  c…                                                                            
  o…                                                                            
  t…                                            N…                              
  c…    Th…                                     M…                              
  p…    Mo…                                     E…                              
  p…    En…                              %      S…                              
  (…    Se…                              Ch…    3…                         %    
  2…    30,          20…                 20…    2…                         Ch…  
 ────────────────────────────────────────────────────────────────────────────── 
  F…                                                                            
  m…                                                                            
  N…    $    17…            $  1…        8%     $   51…       $  4…        14%  
  R…                                                                            
  G…    $    12…            $  1…        7%     $   36…       $  3…        14%  
  P…                                                                            
  G…          69  %            70  %     (1)         70  %       70  %     —    
  M…                                     ppt                                    
  T…                                                                            
  O…    $    11…            $  1…        -7%    $   34…       $  3…        -2%  
  E…                                                                            
  N…                                                                            
  I…    $    11…            $  -…        nm     $   13…       $  -…        nm   
  (…                                                                            
  N…                                                                            
  I…          66  %            (2  %)    68          25  %       (3  %)    28   
  (…                                     pp…                               pp…  
  M…                                                                            
  N…                                                                            
  I…                                                                            
  (…                                                                            
  P…    $    1.…            $  -…        nm     $   1.…       $  -…        nm   
  S…                                                                            
  -                                                                             
  B…                                                                            
  N…                                                                            
  I…                                                                            
  (…                                                                            
  P…    $    1.…            $  -…        nm     $   1.…       $  -…        nm   
  S…                                                                            
  -                                                                             
  D…                                                                            
  K…                                                                            
  o…                                                                            
  m…                                                                            
  a…                                                                            
  N…                                                                            
  f…                                                                            
  m…                                                                            
  T…                                                                            
  P…                                                                            
  V…    $    12…            $  9…        29%    $   35…       $  2…        31%  
  (…                                                                            
  (…                                                                            
  m…                                                                            
  A…    $    38…            $  3…        28%    $   10…       $  7…        39%  
  E…                                                                            
  A…                                     3                                 4    
  E…          22  %            19  %     pp…         21  %       17  %     pp…  
  M…                                                                            
  A…                                                                            
  O…    $    83…            $  8…        -1%    $   25…       $  2…        6%   
  E…                                                                            
                                                                                
1 TPV represents the total dollar amount of payments processed through our
platform, net of returns and chargebacks. We believe that TPV is a key indicator
of the market adoption of our platform, growth of our brand, growth of our
customers' businesses and scale of our business.

2 See "Information Regarding Non-GAAP Measures" for definitions of Adjusted
EBITDA, Adjusted EBITDA margin, and Adjusted operating expenses and the
reconciliations of the net income (loss) to Adjusted EBITDA, and of the total
operating expenses to Adjusted operating expenses.

3 Reflects the one-for-four reverse stock split that became effective on June
30, 2026. All historical share and per-share amounts have been retroactively
adjusted to reflect the reverse stock split. As a result, weighted-average
shares outstanding decreased by a factor of four, and net income (loss) per
share increased by a factor of four for all prior periods presented.
nm - Not meaningful

ppt(s) = percentage point(s)
                                                                                
   Third Quarter 2026 Financial Results:                                        
                                                                                
                                                                                
  Total Processing Volume                                                       
                                                                                
increased by 29% year-over-year, from $98 billion in the third quarter of 2025
to $126 billion for the quarter ended September 30, 2026.
                                                                                
  Net Revenue                                                                   
                                                                                
of $176 million increased by $13 million, or 8%, year-over-year, primarily
driven by higher volumes, partially offset by unfavorable mix due to faster
growth of card programs where we provide processing services with minimal or no
program management.
                                                                                
  Gross Profit                                                                  
                                                                                
increased by 7% year-over-year to $122 million from $115 million in the third
quarter of 2025. The increase in Gross Profit was largely driven by our TPV
growth. Gross Margin was 69% in the third quarter of 2026.
                                                                                
  Net Income                                                                    
                                                                                
of $115 million in the quarter, compared to a Net Loss of $4 million in the same
period in the prior year, a year-over-year improvement of $119 million. This
includes a $107 million discrete non-cash income tax benefit from the release of
valuation allowances on certain deferred tax assets. Net income margin in the
quarter was 66%, an increase of 68 percentage points versus last year, which
includes the impact of the discrete income tax benefit.
                                                                                
                                       2                                        
                                                                                
                                                                                
  Adjusted EBITDA                                                               
                                                                                
was $39 million in the third quarter of 2026, an increase of $8 million year-
over-year, or 28%. Adjusted EBITDA margin was 22% in the third quarter of 2026,
an increase of 3 percentage points versus last year.
                                                                                
   Financial Guidance                                                           
                                                                                
The following summarizes Marqeta's guidance for the fourth quarter of 2026 and
full year of 2026:
                                                                                
                                       Fourth Quarter 2026    Fiscal Year 2026  
  Net Revenue Growth                   3 - 5%                 11 - 12%          
  Gross Profit Growth                  5 - 7%                 11 - 12%          
  Adjusted EBITDA Growth(1)            Mid 20s                Low-to-Mid 30s    
  (1)Adjusted EBITDA Growth                                                     
  represents the                                                                
  year-over-year percentage change                                              
  in                                                                            
  Adjusted EBITDA. See "Information                                             
  Regarding Non-GAAP Measures" for                                              
  the                                                                           
  definition of Adjusted EBITDA                                                 
  Margin and                                                                    
  for information regarding                                                     
  non-availability of a forward                                                 
  reconciliation.                                                               
                                                                                
                                                                                
  Conference Call                                                               
                                                                                
Marqeta will host a live conference call today at 1:30 p.m. Pacific time (4:30
p.m. Eastern time). To join the call, please dial-in 10 minutes in advance:
toll-free at 1-877-407-4018 or direct at 1-201-689-8471. The conference call
will also be available live via webcast online at http://investors.marqeta.com.

The telephone replay dial-in numbers are 1-844-512-2921 and 1-412-317-6671 and
will be available until November 17, 2026, 8:59 p.m. Pacific time (11:59 p.m.
Eastern time). The confirmation code for the replay is 13762621.
                                                                                
  Forward-Looking Statements                                                    
                                                                                
This press release contains "forward-looking statements" within the meaning of
the "safe harbor" provisions of the Private Securities Litigation Reform Act of
1995. Forward-looking statements expressed or implied in this press release
include, but are not limited to, statements relating to Marqeta’s quarterly and
annual guidance; statements regarding Marqeta’s profitability; statements
regarding Marqeta’s customers, their growth, and their plans to onboard
Marqeta's offerings; statements regarding Marqeta's new collaborations, product
introductions, and product capabilities, and the benefits those collaborations,
products, or capabilities may have for customers; statements regarding Marqeta's
ability to enable growth for its customers; statements regarding the impact of
income tax benefits or liabilities; and statements made by Marqeta’s Chief
Executive Officer. Actual results may differ materially from the expectations
contained in these statements due to risks and uncertainties, including, but not
limited to, the following: the risk that Marqeta is unable to maintain
profitability; the risk that Marqeta is unable to further attract, retain,
diversify, and expand its customer base; the risk that Marqeta is unable to
drive increased profitable transactions on its platform; the risk that consumers
and customers will not perceive the benefits of Marqeta’s products, including
credit card issuing; the risk that Marqeta's platform does not operate as
intended resulting in system outages; the risk that Marqeta will not be able to
achieve the cost structure that Marqeta currently expects; the risk that
Marqeta’s solutions will not achieve the expected market acceptance; the risk
that competition could reduce expected demand for Marqeta’s services, including
credit card issuing; the risk that changes in the regulatory landscape could
adversely affect Marqeta's operations and revenues; the risk that Marqeta may be
unable to maintain relationships with Issuing Banks and Card Networks; the risk
that Marqeta is not able to identify, close and recognize the anticipated
benefits of any acquisition; the risk that Marqeta is unable to successfully
integrate any acquisition, to businesses and related operations; the risk of
general economic conditions in either domestic or international markets,
including inflation and recessionary fears, conditions resulting from
geopolitical uncertainty and instability or war; the risk of changes to
Marqeta's expectations regarding income tax liabilities, including any changes
regarding foreign taxes, realizability of deferred tax assets, valuation
allowances, and the adequacy of reserves; and the risk that Marqeta may be
subject to additional risks due to its international business activities.
Detailed information about these risks and other factors that could potentially
affect Marqeta’s business, financial condition, and results of operations are
included in the “Risk Factors” disclosed in Marqeta's Annual Report on Form 10-K
for the year ended December 31, 2025 and subsequent Quarterly Reports, as such
risk factors may be updated from time to time in Marqeta’s periodic filings with
the SEC, available at www.sec.gov and Marqeta’s website at
http://investors.marqeta.com .
                                                                                
                                       3                                        
                                                                                
The forward-looking statements in this press release are based on information
available to Marqeta as of the date hereof. Marqeta disclaims any obligation to
update any forward-looking statements, except as required by law .
                                                                                
  Disclosure Information                                                        
                                                                                
Investors and others should note that Marqeta announces material financial
information to its investors using its investor relations website, SEC filings,
press releases, public conference calls and webcasts. Marqeta also uses social
media to communicate with its customers and the public about Marqeta, its
products and services, and other matters relating to its business and market. It
is possible that the information Marqeta posts on social media could be deemed
to be material information. Therefore, Marqeta encourages investors, the media,
and others interested in Marqeta to review the information we post on social
media channels including the Marqeta X feed (@Marqeta), the Marqeta Instagram
page (@lifeatmarqeta), the Marqeta Facebook page, and the Marqeta LinkedIn page.
These social media channels may be updated from time to time.
                                                                                
   Use of Non-GAAP Financial Measures                                           
                                                                                
Reconciliations of non-GAAP financial measures to the most directly comparable
financial results as determined in accordance with GAAP are included at the end
of this press release following the accompanying financial data. For a
description of these non-GAAP financial measures, including the reasons
management uses each measure, please see the section of the tables titled
"Information Regarding Non-GAAP Financial Measures".
                                                                                
  About Marqeta, Inc.                                                           
                                                                                
Marqeta (NASDAQ: MQ) enables payments innovation through its enterprise-grade
modern card issuing platform. Spanning debit and credit offerings for both
consumer and commercial, it provides card issuing and processing, credit
services, accounts and money movement, risk and fraud, and user experience
capabilities. The Company’s solutions and expertise provide customers with
greater control and agility in issuing payment credentials and allow them to
build and embed financial services into their branded experience. With
compliance and security built-in, Marqeta’s end-to-end configurable platform is
proven at scale, processing nearly $400 billion in annual payments volume in
2025 and certified to operate in more than 40 countries. To learn more, visit
www.marqeta.com.

Marqeta® is a registered trademark of Marqeta, Inc.

IR Contact: Marqeta Investor Relations, [email protected]
                                                                                
                                       4                                        
                                                                                
                                                                                
                                 Marqeta, Inc.                                  
                                                                                
                                                                                
                Condensed Consolidated Statements of Operations                 
                                                                                
                    (in thousands, except per share amounts)                    
                                                                                
                                  (unaudited)                                   
                                                                                
                     Three                               Nine                   
                    Months                             Months                   
                     Ended                              Ended                   
                   Septem…                           Septemb…                   
             2026      30,    2025             2026       30,    2025           
 ────────────────────────────────────────────────────────────────────────────── 
  Net        $     176,179    $     163,306    $      517,972    $     452,771  
  revenue                                                                       
  Costs                                                                         
  of                54,079           48,749           156,407          135,474  
  revenue                                                                       
  Gross            122,100          114,557           361,565          317,297  
  profit                                                                        
  Operat…                                                                       
  expens…                                                                       
  Compen…                                                                       
  and               77,316           84,871           233,596          252,330  
  benefi…                                                                       
  Techno…           18,028           16,942            54,511           47,855  
  Deprec…                                                                       
  and               10,247            7,019            28,797           19,003  
  amorti…                                                                       
  Profes…            4,124            5,518            14,375           15,432  
  servic…                                                                       
  Occupa…            1,096            1,058             2,815            2,818  
  Market…                                                                       
  and                  972              895             3,364            2,075  
  advert…                                                                       
  Other                                                                         
  operat…            4,042            8,624            12,102           15,920  
  expens…                                                                       
  Total                                                                         
  operat…          115,825          124,927           349,560          355,433  
  expens…                                                                       
  Income                                                                        
  (loss)             6,275          -10,370            12,005          -38,136  
  from                                                                          
  operat…                                                                       
  Other                                                                         
  income,            4,774            7,244            15,143           26,544  
  net                                                                           
  Income                                                                        
  (loss)                                                                        
  before                                                                        
  income            11,049           -3,126            27,148          -11,592  
  tax                                                                           
  (benef…                                                                       
  expense                                                                       
  Income                                                                        
  tax              -104,3…              498          -103,695              939  
  (benef…                                                                       
  expense                                                                       
  Net                                                                           
  income     $     115,442    $      -3,624    $      130,843    $     -12,531  
  (loss)                                                                        
  Net                                                                           
  income                                                                        
  (loss)                                                                        
  per                                                                           
  share                                                                         
  attrib…                                                                       
  to                                                                            
  Class A                                                                       
  and                                                                           
  Class B                                                                       
  common                                                                        
  stockh…                                                                       
  Basic      $        1.11    $       -0.03    $         1.24    $       -0.11  
  Diluted    $        1.09    $       -0.03    $         1.22    $       -0.11  
  Weight…                                                                       
  shares                                                                        
  used in                                                                       
  comput…                                                                       
  net                                                                           
  income                                                                        
  (loss)                                                                        
  per                                                                           
  share                                                                         
  attrib…                                                                       
  to                                                                            
  Class A                                                                       
  and                                                                           
  Class B                                                                       
  common                                                                        
  stockh…                                                                       
  Basic            104,240          112,179           105,608          117,573  
  Diluted          105,777          112,179           106,978          117,573  
                                                                                
(1) Reflects the one-for-four reverse stock split that became effective on June
30, 2026. All historical share and per-share amounts have been retroactively
adjusted to reflect the reverse stock split. As a result, weighted-average
shares outstanding decreased by a factor of four, and net income (loss) per
share increased by a factor of four for all prior periods presented.
                                                                                
                                       5                                        
                                                                                
                                                                                
                                 Marqeta, Inc.                                  
                                                                                
                                                                                
                     Condensed Consolidated Balance Sheets                      
                                                                                
                                 (in thousands)                                 
                                                                                
                           September 30,               December 31,             
                           2026                        2025                     
 ────────────────────────────────────────────────────────────────────────────── 
                           -unaudited                                           
  Assets                                                                        
  Current assets:                                                               
  Cash and cash            $                697,464    $               709,443  
  equivalents                                                                   
  Restricted cash                           265,445                    307,593  
  Short-term                                    711                     62,483  
  investments                                                                   
  Accounts receivable,                       40,432                     41,422  
  net                                                                           
  Network incentives                         49,947                     61,059  
  receivable                                                                    
  Settlements                                23,526                     18,037  
  receivable, net                                                               
  Prepaid expenses and                                                          
  other current                              30,664                     35,278  
  assets                                                                        
  Total current assets                    1,108,189                  1,235,315  
  Property and                               69,616                     59,910  
  equipment, net                                                                
  Operating lease                                                               
  right-of-use assets,                        6,116                      8,275  
  net                                                                           
  Intangible assets,                         43,468                     51,388  
  net                                                                           
  Goodwill                                  153,602                    154,706  
  Other assets                              120,851                     15,439  
  Total assets             $              1,501,842    $             1,525,033  
  Liabilities and                                                               
  stockholders' equity                                                          
  Current liabilities:                                                          
  Accounts payable         $                  1,233    $                 1,847  
  Revenue share payable                     217,038                    224,526  
  Funds payable and                                                             
  amounts due to                            265,344                    306,891  
  customers                                                                     
  Accrued expenses and                                                          
  other current                             167,669                    215,793  
  liabilities                                                                   
  Total current                             651,284                    749,057  
  liabilities                                                                   
  Operating lease                                                               
  liabilities, net of                         3,478                      5,535  
  current portion                                                               
  Other liabilities                          10,411                      8,484  
  Total liabilities                         665,173                    763,076  
  Stockholders'                                                                 
  equity:(1)                                                                    
  Common stock                                   10                         11  
  Additional paid-in                      1,518,704                  1,572,270  
  capital                                                                       
  Accumulated other                                                             
  comprehensive (loss)                       -1,055                      1,509  
  income                                                                        
  Accumulated deficit                      -680,990                   -811,833  
  Total stockholders’                       836,669                    761,957  
  equity                                                                        
  Total liabilities and                                                         
  stockholders'            $              1,501,842    $             1,525,033  
  equity                                                                        
                                                                                
(1) Reflects the one-for-four reverse stock split that became effective on June
30, 2026, which has been applied retrospectively to all prior periods presented.
The reverse stock split did not change the par value per share of the Company’s
common stock. As a result, the aggregate par value of outstanding common stock
was reduced proportionately, with a corresponding increase to additional paid-in
capital. Total stockholders’ equity remained unchanged.
                                                                                
                                       6                                        
                                                                                
                                                                                
                                 Marqeta, Inc.                                  
                                                                                
                                                                                
                Condensed Consolidated Statements of Cash Flows                 
                                                                                
                                 (in thousands)                                 
                                                                                
                                  (unaudited)                                   
                                                                                
                           Nine Months Ended                                    
  Cash flows from          September 30,                                        
  operating activities:    2026                                 2025            
 ────────────────────────────────────────────────────────────────────────────── 
  Net income (loss)        $                         130,843    $      -12,531  
  Adjustments to                                                                
  reconcile net income                                                          
  (loss) to net cash                                                            
  provided by operating                                                         
  activities:                                                                   
  Benefit of deferred                               -104,289                 —  
  income taxes, net                                                             
  Share-based                                         63,839            78,689  
  compensation expense                                                          
  Depreciation and                                    28,797            19,003  
  amortization                                                                  
  Non-cash operating                                   2,159             1,727  
  leases expense                                                                
  Accretion of discount                                                         
  on short-term                                          -46              -691  
  investments                                                                   
  Other                                                1,530             5,365  
  Changes in operating                                                          
  assets and                                                                    
  liabilities:                                                                  
  Accounts receivable                                   -342            -3,834  
  Network incentives                                  11,112            18,011  
  receivable                                                                    
  Settlements                                         -5,489               587  
  receivable                                                                    
  Prepaid expenses and                                 5,155            -2,743  
  other assets                                                                  
  Accounts payable                                        65              -125  
  Revenue share payable                               -7,488            11,575  
  Accrued expenses and                               -37,254            -2,358  
  other liabilities                                                             
  Operating lease                                     -2,436            -3,374  
  liabilities                                                                   
  Net cash provided by                                                          
  operating                                           86,156           109,301  
  activities                                                                    
  Cash flows from                                                               
  investing activities:                                                         
  Maturities of                                                                 
  short-term                                          61,656           100,160  
  investments                                                                   
  Capitalization of                                  -24,586           -21,470  
  internal-use software                                                         
  Purchases of property                               -1,812            -1,992  
  and equipment                                                                 
  Cash paid for                                                                 
  business combination,                                    —           -44,608  
  net                                                                           
  of cash acquired                                                              
  Restricted cash                                                               
  acquired in business                                     —           229,650  
  combination                                                                   
  Purchases of                                                                  
  short-term                                               —            -3,501  
  investments                                                                   
  Net cash provided by                                                          
  investing                                           35,258           258,239  
  activities                                                                    
  Cash flows from                                                               
  financing activities:                                                         
  Repurchase of common                              -105,123          -294,788  
  stock                                                                         
  Change in funds                                                               
  payable and amounts                                -41,547             4,263  
  due                                                                           
  to customers                                                                  
  Taxes paid related to                                                         
  net share                                                                     
  settlement of                                      -23,605           -28,493  
  restricted stock                                                              
  units                                                                         
  Payment of                                                                    
  acquisition-related                                                           
  contingent and                                      -4,972                 —  
  holdback                                                                      
  considerations                                                                
  Proceeds from shares                                                          
  issued in                                                                     
  connection with                                        855               994  
  employee stock                                                                
  purchase                                                                      
  plan                                                                          
  Proceeds from                                                                 
  exercise of stock                                                             
  options,                                                                      
  including early                                                               
  exercised stock                                         51             1,630  
  options,                                                                      
  net of repurchase of                                                          
  early exercised                                                               
  unvested options                                                              
  Net cash used in                                  -174,341          -316,394  
  financing activities                                                          
  Net (decrease)                                                                
  increase in cash,                                                             
  cash                                               -52,927            51,146  
  equivalents, and                                                              
  restricted cash                                                               
  Cash, cash                                                                    
  equivalents, and                                                              
  restricted                                       1,017,931           931,516  
  cash- Beginning of                                                            
  period                                                                        
  Cash, cash                                                                    
  equivalents, and         $                         965,004    $      982,662  
  restricted                                                                    
  cash - End of period                                                          
                                                                                
                                                                                
                                       7                                        
                                                                                
                                                                                
                                 Marqeta, Inc.                                  
                                                                                
                                                                                
                       Financial and Operating Highlights                       
                                                                                
               (in thousands, except per share data or as noted)                
                                                                                
                                  (unaudited)                                   
                                                                                
                                                                            Y…  
                                                                            o…  
                                                                            Y…  
                                                                            C…  
       T…           S…            F…            F…            T…            Q…  
  …    Q…           Q…            Q…            Q…            Q…            vs  
  …    2…           2…            2…            2…            2…            Q…  
 ────────────────────────────────────────────────────────────────────────────── 
  …    $   1…       $   17…       $   16…       $   17…       $   16…       8%  
  …                                                                             
  …                                                                             
  …        5…           54…           48…           52…           48…       1…  
  …                                                                             
  …        1…           12…           11…           11…           11…       7%  
  …                                                                             
  …        69  %         69  %         71  %         70  %         70  %    (…  
  …                                                                         p…  
  …                                                                             
  …                                                                             
  …                                                                             
  …        7…           78…           78…           88…           84…       -…  
  …                                                                             
  …        1…           18…           18…           17…           16…       6%  
  …                                                                             
  …        1…           9,…           8,…           8,…           7,…       4…  
  …                                                                             
  …        4…           5,…           4,…           6,…           5,…       -…  
  …                                                                             
  …                                                                             
  …        9…           1,…           1,…           2,…           895       9%  
  …                                                                             
  …        1…           540           1,…           948           1,…       4%  
  …                                                                             
  …        4…           4,…           3,…           4,…           8,…       -…  
  …                                                                             
  …                                                                             
  …        1…           11…           11…           12…           12…       -…  
  …                                                                             
  …                                                                             
  …        6…           3,…           2,…           -8…           -1…       nm  
  …                                                                             
  …                                                                             
  …                                                                             
  …        4…           4,…           5,…           6,…           7,…       -…  
  …                                                                             
  …                                                                             
  …                                                                             
  …                                                                             
  …        1…           8,…           8,…           -1…           -3…       nm  
  …                                                                             
  …                                                                             
  …                                                                             
  …                                                                             
  …        -…           505           193           -3…           498       nm  
  …                                                                             
  …                                                                             
  …                                                                             
  …    $   1…       $   7,…       $   7,…       $   -1…       $   -3…       nm  
  …                                                                             
  …                                                                             
  …                                                                             
  …    $   1…       $   0.…       $   0.…       $   -0…       $   -0…       nm  
  …                                                                             
  -                                                                             
  …                                                                             
  …                                                                             
  …                                                                             
  …    $   1…       $   0.…       $   0.…       $   -0…       $   -0…       nm  
  …                                                                             
  -                                                                             
  …                                                                             
  …                                                                             
  …    $   1…       $   12…       $   11…       $   10…       $   97…       2…  
  …                                                                             
  …    $   3…       $   37…       $   33…       $   30…       $   30…       2…  
  …                                                                             
  …                                                                         3   
  …        22  %         21  %         20  %         18  %         19  %    p…  
  …                                                                             
  …                                                                             
  …                                                                             
  …                                                                             
  …    $   6…       $   69…       $   67…       $   70…       $   74…       -…  
  …                                                                             
  …                                                                             
  …    $   2…       $   26…       $   28…       $   30…       $   23…       1…  
  …                                                                             
  …    $   7…       $   9,…       $   37…       $   62…       $   83…       nm  
  …                                                                             
  …    $   1…       $   1,…       $   1,…       $   1,…       $   1,…       1%  
  …                                                                             
  …    $   6…       $   67…       $   73…       $   76…       $   64…       2%  
  …                                                                             
  …    $   8…       $   71…       $   74…       $   76…       $   83…       —%  
  …                                                                             
                                                                                
(1) Restricted cash consists primarily of customer funds held by TransactPay in
segregated accounts in connection with its program management activities for
card and e-money wallet programs.

(2) Reflects the one-for-four reverse stock split that was effective June 30,
2026, which has been applied retrospectively to all prior periods presented.

ppt(s) = percentage point(s)

nm - not meaningful
                                                                                
                                       8                                        
                                                                                
                                                                                
                                 Marqeta, Inc.                                  
                                                                                
                                                                                
                  Reconciliation of GAAP to NON-GAAP Measures                   
                                                                                
                                 (in thousands)                                 
                                                                                
                                  (unaudited)                                   
                                                                                
  Information Regarding Non-GAAP Measures                                       
                                                                                
In addition to the financial measures prepared in accordance with generally
accepted accounting principles in the United States (“GAAP”), this press release
contains certain non-GAAP financial measures. Marqeta considers Adjusted EBITDA,
Adjusted EBITDA Growth, Adjusted EBITDA Margin, Adjusted EBITDA Margin based on
Gross Profit, Net Income (Loss) Margin based on Gross Profit, and Adjusted
operating expenses as supplemental measures of the Company’s performance that
are not required by, nor presented in accordance with GAAP.

We define Adjusted EBITDA as net income (loss) adjusted, as applicable, to
exclude depreciation and amortization; share-based compensation expense; payroll
tax related to share-based compensation; restructuring and other one-time costs;
non-recurring litigation expense; acquisition-related expenses which consist of
due diligence costs, transaction costs and integration costs related to
potential or successful acquisitions, and cash and non-cash postcombination
compensation expenses; income tax expense (benefit); and other income (expense),
net, which primarily consists of interest income from our short-term investments
and cash deposits, and realized foreign currency gains and losses. We believe
that Adjusted EBITDA is an important measure of operating performance because it
allows management and our board of directors to evaluate and compare our core
operating results, including our operating efficiencies, from period to period.
Additionally, we utilize Adjusted EBITDA as an input into our calculation of our
annual employee bonus plans and performance-based restricted stock units.

Adjusted EBITDA Margin is calculated as Adjusted EBITDA divided by net revenue.
Adjusted EBITDA Margin based on Gross Profit is calculated as Adjusted EBITDA
divided by Gross Profit, and Net Income (Loss) Margin based on Gross Profit is
calculated as Net Income (Loss) divided by Gross Profit. Adjusted EBITDA growth
represents the year-over-year percentage change in Adjusted EBITDA. These
measures are used by management and our board of directors to evaluate our
operating efficiency.

We define Adjusted operating expenses as total operating expenses adjusted, as
applicable, to exclude depreciation and amortization; share-based compensation
expense; payroll tax related to share-based compensation; restructuring and
other one-time costs; non-recurring litigation expense; and acquisition-related
expenses which consist of due diligence costs, transaction costs and integration
costs related to potential or successful acquisitions, and cash and non-cash
postcombination compensation expenses. We believe that Adjusted operating
expenses is an important measure of operating performance because it allows
management and our board of directors to evaluate and compare our core operating
results, including our operating efficiencies, from period to period.

Adjusted EBITDA, Adjusted EBITDA Growth, Adjusted EBITDA Margin, Adjusted EBITDA
Margin based on Gross Profit, Net Income (Loss) Margin based on Gross Profit,
and Adjusted operating expenses should not be considered in isolation, or
construed as an alternative to net loss, or any other performance measures
derived in accordance with GAAP, or as an alternative to cash flow from
operating activities or as a measure of the Company's liquidity. In addition,
other companies may calculate Adjusted EBITDA differently than Marqeta does,
which limits its usefulness in comparing Marqeta’s financial results with those
of other companies.
                                                                                
                                       9                                        
                                                                                
The following table shows Marqeta's GAAP results reconciled to non-GAAP results
included in this release:
                                                                                
                Three                                Nine                       
                Mont…                               Mont…                       
                Ended                               Ended                       
                Sept…                               Sept…                       
          2026    30,       2025              2026    30,       2025            
 ────────────────────────────────────────────────────────────────────────────── 
  Net     $     176,…       $     163…        $     517,…       $     452…      
  Rev…                                                                          
  Gro…    $     122,…       $     114…        $     361,…       $     317…      
  Pro…                                                                          
  Net                                                                           
  Inc…    $     115,…       $     -3,…        $     130,…       $     -12…      
  (Lo…                                                                          
  Net                                                                           
  Inc…                                                                          
  (Lo…                                                                          
  Mar…             66  %            (2  %)             25  %            (3  %)  
  - %                                                                           
  of                                                                            
  Net                                                                           
  Rev…                                                                          
  Net                                                                           
  Inc…                                                                          
  (Lo…                                                                          
  Mar…             95  %            (3  %)             36  %            (4  %)  
  - %                                                                           
  of                                                                            
  Gro…                                                                          
  Pro…                                                                          
  Tot…                                                                          
  Ope…    $     115,…       $     124…        $     349,…       $     355…      
  Exp…                                                                          
  Net                                                                           
  Inc…    $     115,…       $     -3,…        $     130,…       $     -12…      
  (Lo…                                                                          
  Sha…                                                                          
  com…          21,4…             25,…              63,8…             78,…      
  exp…                                                                          
  Dep…                                                                          
  and           10,2…             7,0…              28,7…             19,…      
  amo…                                                                          
  exp…                                                                          
  Pay…                                                                          
  tax                                                                           
  exp…                                                                          
  rel…            389              583              1,853             2,1…      
  to                                                                            
  sha…                                                                          
  com…                                                                          
  Acq…            317             1,8…              1,409             7,3…      
  exp…                                                                          
  Res…                                                                          
  and                                                                           
  oth…             79             1,2…              1,628             5,5…      
  one…                                                                          
  cos…                                                                          
  Non…                                                                          
  lit…              —             4,2…                  —             4,2…      
  exp…                                                                          
  Oth…                                                                          
  inc…          -4,7…             -7,…              -15,…             -26…      
  net                                                                           
  Inc…                                                                          
  tax           -104…              498              -103…              939      
  (be…                                                                          
  exp…                                                                          
  Adj…    $     38,7…       $     30,…        $     109,…       $     78,…      
  EBI…                                                                          
  Adj…                                                                          
  EBI…                                                                          
  Mar…                                                                          
  - %              22  %            19  %              21  %            17  %   
  of                                                                            
  Net                                                                           
  Rev…                                                                          
  Adj…                                                                          
  EBI…                                                                          
  Mar…                                                                          
  - %              32  %            26  %              30  %            25  %   
  of                                                                            
  Gro…                                                                          
  Pro…                                                                          
  Tot…                                                                          
  Ope…    $     115,…       $     124…        $     349,…       $     355…      
  Exp…                                                                          
  Sha…                                                                          
  com…          -21,…             -25…              -63,…             -78…      
  exp…                                                                          
  Dep…                                                                          
  and           -10,…             -7,…              -28,…             -19…      
  amo…                                                                          
  exp…                                                                          
  Pay…                                                                          
  tax                                                                           
  exp…                                                                          
  rel…           -389             -583              -1,8…             -2,…      
  to                                                                            
  sha…                                                                          
  com…                                                                          
  Acq…           -317             -1,…              -1,4…             -7,…      
  exp…                                                                          
  Res…                                                                          
  and                                                                           
  oth…            -79             -1,…              -1,6…             -5,…      
  one…                                                                          
  cos…                                                                          
  Non…                                                                          
  lit…              —             -4,…                  —             -4,…      
  exp…                                                                          
  Adj…                                                                          
  Ope…    $     83,3…       $     84,…        $     252,…       $     238…      
  Exp…                                                                          
                                                                                
(1) Acquisition-related expenses, including transaction costs, integration
costs, and cash and non-cash postcombination compensation expenses, are excluded
from Adjusted EBITDA. These expenses are specific to a discrete transaction and
do not reflect our ongoing core operations or the recurring expenses required to
sustain and operate our business.

(2) Restructuring and other one-time costs include the costs related to the CEO
transition and one-time retention bonuses provided to other key employees. These
bonuses have service requirements and are expensed over the requisite service
period.

(3) Non-recurring litigation expense includes a legal contingency expense
related to the Securities Actions recorded during the three and nine months
ended September 30, 2025.

(4) The income tax benefit recorded during the three and nine months ended
September 30, 2026 was primarily due to the release of valuation allowances
related to U.S. federal and certain states' deferred tax assets, partially
offset by the income tax expense from current period activity.

A reconciliation of Adjusted EBITDA Growth to the comparable GAAP measure for
the fourth quarter and full year of 2026 is not available due to the challenges
and impracticability with estimating some of the items as such items cannot be
reasonably predicted and could be significant. Because of those challenges,
reconciliations of such forward-looking non-GAAP financial measures are not
available without unreasonable effort.
                                                                                
                                       10                                       
                                                                                

Sources

The 8-K item 2.02 filings (SEC EDGAR) and their EX-99 exhibits: the results release and, when filed, prepared remarks or the call transcript.

Also

Said vs did: the targets in these releases against what was then reported. Filings: every filing.

Work with it

Excel workbook · CSV. Google Sheet that stays up to date: paste =IMPORTDATA("https://tickdelta.com/company/MQ/export.csv") into a cell.

Next:Presentations
Esc

Type a ticker such as AAPL, a name, an investor such as Buffett, or a topic such as tariffs. ↑ ↓ to move, Enter to open.