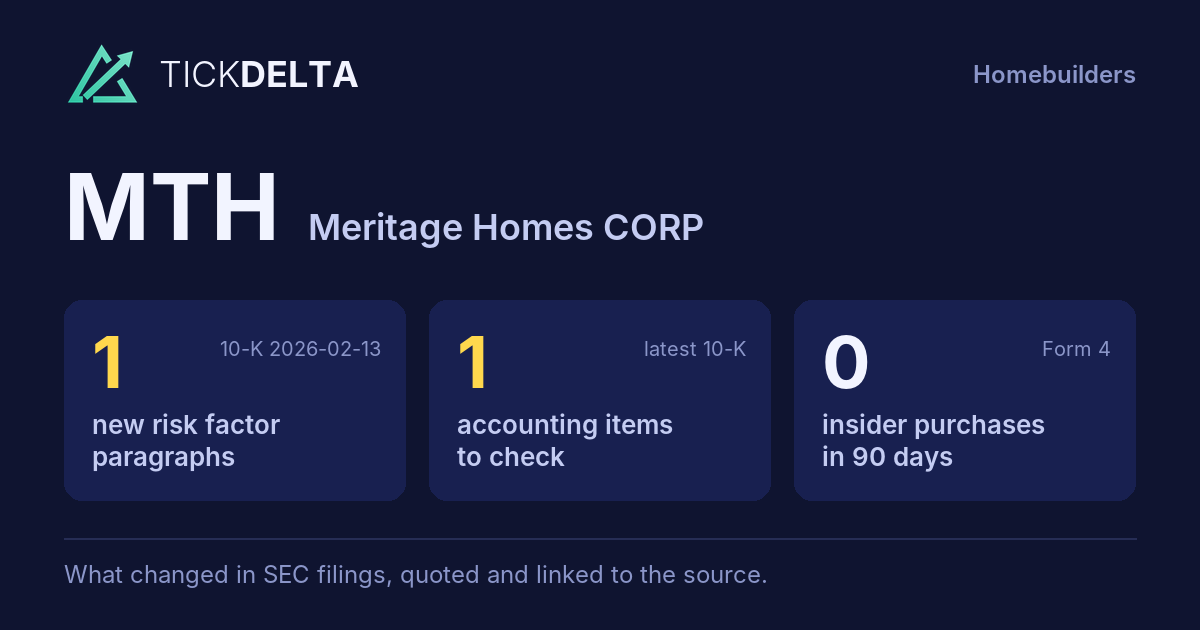
Screener / SEC EDGAR /CIK 0000833079 /10-K filed Feb 13, 2026, compared with Feb 20, 2025 /Numbers from the XBRL of the 10-Ks
NYSE Consumer discretionary · Homebuilders

Meritage Homes CORP MTH

Compare with peers Embed
Earnings releases

Latest results release: Oct 28, 2026

8-K item 2.02, exhibit 99

What MTH's management wrote with each quarter's results: the press release and, when the company files them, its prepared remarks or the call transcript. The call itself is not filed with SEC, so most quarters have the release only.

Read and search

Every release, in full · linked to sec.gov

Press release Oct 28, 2026 · EX-99.1

Contacts: Emily Tadano, VP Investor Relations and External Communications

Open on SEC

Contacts: Emily Tadano, VP Investor Relations and External Communications -480) 515-8979 (office [email protected]

SCOTTSDALE, Ariz., October 28, 2026 - Meritage Homes Corporation (NYSE: MTH), the fifth-largest U.S. homebuilder, reported third quarter results for the period ended September 30, 2026.

"In the third quarter of 2026, we navigated an increasingly challenging homebuying environment marked by rising mortgage interest rates and persistent geopolitical and macroeconomic uncertainty. Constrained affordability weighed on consumer sentiment, which was reflected in our 15% year-over-year decline in third quarter orders despite achieving an average absorption pace of 3.0 net sales per month per store," said Steven J. Hilton, executive chairman of Meritage Homes. "In light of current market conditions, we intentionally focused on preserving margins rather than pursuing a higher sales pace."

"We were able to convert nearly 190% of our backlog this quarter, delivering 3,187 homes across our larger footprint of 348 communities," added Phillippe Lord, chief executive officer of Meritage Homes. "Third quarter 2026 home closing revenue of $1.2 billion generated adjusted home closing gross margin of 17.9%, excluding $6.0 million of real estate inventory impairments and terminated land deal walk-away charges, and SG&A as a percentage of home closing revenue of 11.0%, nearly in line with the prior year period as we were able to leverage our larger size and cost control initiatives to maximize profitability."

"In today's volatile market, prudently managing capital is a key priority, as we continue to focus on maintaining sufficient liquidity. During the quarter, we pulled back our land investments by almost 40% year-over-year to $329 million and returned $86 million to shareholders via share repurchases and dividends. We are confident that the strength of our balance sheet and prudence around cash preservation will be a differentiator, as we expect market conditions to continue to be unpredictable over the next several quarters. In the first nine months of 2026, we have returned nearly $380 million of capital to shareholders, representing 177% of total earnings so far this year," concluded Mr. Lord. "We ended the third quarter of 2026 with cash of $677 million, no borrowings under our revolving credit facility, and a net debt-to-capital ratio of 18.9%. As of September 30, 2026, our book value per share increased 4% year-over-year." 2

• Orders of 3,083 homes for the third quarter of 2026 decreased 15% year-over- year as a result of 21% lower average absorption pace, which was partially offset by a 7% increase in average community count. Third quarter 2026 average sales price ("ASP") on orders of $383,000 was down 2% from the third quarter of 2025, primarily due to higher utilization of incentives and related costs including rate buy-downs, as well as geographic mix.

• The 17% year-over-year decrease in home closing revenue in the third quarter of 2026 to $1.2 billion was due to 14% lower closing volume of 3,187 homes combined with a 4% decrease in ASP on closings to $365,000. The year-over-year decline in ASP on closings was primarily due to higher utilization of incentives and related costs including rate buy-downs, as well as geographic mix.

• Home closing gross margin of 17.4% in the third quarter of 2026 was 170 bps lower than 19.1% in the prior year as a result of higher lot and incentive costs coupled with lost leverage on lower home closing revenue, which were partially offset by direct cost savings and lower performance-based compensation expense. Excluding $6.6 million of real estate inventory impairments and a $0.6 million net credit related to terminated land deal walk-away charges in the third quarter of 2026, and $8.7 million of real estate inventory impairments and $5.8 million in terminated land deal walk-away charges in the prior year, adjusted home closing gross margin was 17.9% and 20.1% for the third quarters of 2026 and 2025, respectively. In the third quarter of 2026, we incurred $0.9 million of terminated land deal walk-away charges, which were more than offset by $1.5 million of recoveries related to previously incurred walk-away charges.

• Selling, general and administrative expenses ("SG&A") as a percentage of third quarter 2026 home closing revenue were 11.0% compared to 10.8% in the third quarter of 2025, as a result of lost leverage on lower home closing revenue and higher technology costs, which were partially offset by an intentional pull back in discretionary expenses and decreased performance-based compensation expense.

• The third quarter effective income tax rate was 20.1% in 2026 compared to 22.6% in 2025. The 2026 tax rate reflected acquired below-market transferable clean fuel production tax credits.

• Net earnings were $68 million ($1.04 per diluted share) for the third quarter of 2026, a 32% decrease from $99 million ($1.39 per diluted share) for the third quarter of 2025, mainly resulting from lower home closing revenue and gross profit. Excluding quarterly impairments and walk-away charges for each period, adjusted diluted EPS was $1.11 and $1.55 for the third quarters of 2026 and 2025, respectively.

Total sales orders for the first nine months of 2026 decreased 10% year-over- year, reflecting a 20% decrease in average absorption pace partially offset by a 12% increase in average communities compared to the first nine months of 2025. The 3% lower ASP on orders for the first nine months of 2026 compared to prior year was 3 primarily due to higher utilization of incentives and related costs including rate buy-downs, as well as geographic mix.

• Home closing revenue decreased 16% year-over-year in the first nine months of 2026 to $3.7 billion, driven by 12% lower home closing volume and a 4% decrease in ASP on closings compared to the first nine months of 2025. The year-over-year decline in ASP on closings reflected higher utilization of incentives and related costs including rate buy-downs, as well as geographic mix.

• Home closing gross margin of 17.8% decreased 290 bps in the first nine months of 2026 from 20.7% in the prior year due to higher lot and incentive costs coupled with lost leverage on lower home closing revenue, which were partially offset by direct cost savings and lower performance-based compensation expense. Excluding $12.6 million of real estate inventory impairments and $1.0 million in terminated land deal walk-away charges in the first nine months of 2026 and $8.7 million of real estate inventory impairments and $11.4 million in terminated land deal walk-away charges in the prior year, adjusted home closing gross margin was 18.1% and 21.2% for the first nine months of 2026 and 2025, respectively.

• SG&A as a percentage of home closing revenue was 11.0% in the first nine months of 2026 compared to 10.7% in the prior year, as a result of lost leverage on lower home closing revenue and higher technology costs, which were partially offset by an intentional pull back in discretionary expenses and decreased performance-based compensation expense.

• The effective income tax rate in the first nine months of 2026 was 23.1% compared to 23.4% in 2025.

• Net earnings were $214 million ($3.22 per diluted share) for the first nine months of 2026, a 42% decrease from $369 million ($5.13 per diluted share) for the first nine months of 2025, primarily reflecting lower home closing revenue and gross margins. Excluding year-to-date impairments and walk-away charges for each period, adjusted diluted EPS was $3.38 and $5.35 for the first nine months of 2026 and 2025, respectively.

• Cash and cash equivalents at September 30, 2026 totaled $677 million. This compared to cash and cash equivalents of $775 million at December 31, 2025.

• Land acquisition and development spend, net of land development reimbursements, totaled $329 million and $528 million for the third quarter of 2026 and 2025, respectively.

• Approximately 71,800 lots were owned or controlled as of September 30, 2026, compared to approximately 80,800 lots as of September 30, 2025. Nearly 2,000 net new lots were added in the third quarter of 2026, representing an estimated 21 future communities.

• Third quarter 2026 ending community count of 348 was up 4% compared to prior year and up 2% sequentially from the second quarter of 2026. 4 • Debt-to-capital and net debt-to-capital ratios were 26.9% and 18.9%, respectively, at September 30, 2026, which compared to 26.0% and 16.9%, respectively, at December 31, 2025.

• The Company declared and paid quarterly cash dividends of $0.48 per share totaling $31 million in the third quarter of 2026. This compared to $0.43 per share totaling $30 million in the third quarter of 2025. Year-to-date dividends paid were $94 million and $92 million in 2026 and 2025, respectively.

• During the third quarter of 2026, the Company repurchased 757,128 shares of stock, or 1.2% of shares outstanding at the beginning of the quarter, for $55 million, consistent with the third quarter of 2025. For the first nine months of 2026, the Company repurchased 4,101,288 shares of stock, or 6.0% of shares outstanding at the beginning of the year, for $285 million, up 97% compared to prior year of $145 million. As of September 30, 2026, $229 million remained available to repurchase.

Management will host a conference call to discuss its third quarter 2026 results at 8:00 a.m. Pacific Time (11:00 a.m. Eastern Time) on Thursday, October 29, 2026. To listen, please go to Meritage's Investor Relations page for the live webcast or dial in to 1-800-445-7795 US toll free or 1-785-424-1699. A replay will be available on the Investor Relations page. 5

September 30, 2026 December 31, 2025 ────────────────────────────────────────────────────────────────────────────── Assets: Cash and cash equivalents $ 677,498 $ 775,157 Other receivables 345,535 306,956 Real estate(1) 6,014,511 5,987,120 Deposits on real estate under option or 170,777 174,170 contract Investments in 64,225 57,268 unconsolidated entities Property and equipment, net 45,057 46,647 Deferred tax asset, net 44,427 53,293 Prepaids, other assets and 227,614 221,676 goodwill Total assets $ 7,589,644 $ 7,622,287 Liabilities: Accounts payable $ 209,249 $ 200,679 Accrued and other 476,658 387,698 liabilities Home sale deposits 7,627 9,213 Loans payable and other 42,351 24,328 borrowings Senior and convertible 1,809,401 1,804,726 senior notes, net Total liabilities 2,545,286 2,426,644 Stockholders' Equity: Preferred stock — — Common stock, par value $0.01. Authorized 125,000,000 shares; 64,423,225 and 68,168,923 644 682 shares issued and outstanding at September 30, 2026 and December 31, 2025, respectively Additional paid-in capital — — Retained earnings 5,043,714 5,194,961 Total stockholders’ equity 5,044,358 5,195,643 Total liabilities and stockholders’ $ 7,589,644 $ 7,622,287 equity (1)Real estate – Allocated costs: Homes completed and under $ 2,045,060 $ 2,069,548 construction Finished home sites and home sites under 3,842,767 3,917,572 development Consolidated real estate 126,684 — not owned Total real estate $ 6,014,511 $ 5,987,120

Nine Months Ended Cash flows from September 30, operating activities: 2026 2025 ────────────────────────────────────────────────────────────────────────────── Net earnings $ 213,723 $ 368,982 Adjustments to reconcile net earnings to net cash provided by/(used in) operating activities: Depreciation and 16,973 18,603 amortization Real estate and land 12,648 9,292 impairments Write-off of 1,006 11,437 terminated land deals Stock-based 16,788 14,780 compensation Equity in earnings from unconsolidated -2,941 -3,133 entities Distribution of earnings from 3,325 3,732 unconsolidated entities Other 8,972 7,415 Changes in assets and liabilities: Decrease/(increase) in 58,676 -413,224 real estate Increase in deposits on real estate -1,431 -9,010 under option or contract Increase in other receivables, prepaids -42,770 -77,840 and other assets Decrease in accounts payable and accrued -23,860 -45,326 and other liabilities Decrease in home sale -1,586 -11,093 deposits Net cash provided by/(used in) operating 259,523 -125,385 activities Cash flows from investing activities: Investments in unconsolidated -21,270 -21,080 entities Distributions of capital from 350 — unconsolidated entities Purchases of property -13,917 -20,145 and equipment Proceeds from sales of property and 234 184 equipment Maturities/sales of investments and — 1,750 securities Payments to purchase investments and — -1,750 securities Net cash used in -34,603 -41,041 investing activities Cash flows from financing activities: Repayment of loans payable and other -3,302 -11,522 borrowings Proceeds from issuance — 497,195 of senior notes Payment of debt — -5,106 issuance costs Proceeds from liabilities related to 59,947 — consolidated real estate not owned Dividends paid -94,224 -91,759 Repurchase of shares -285,000 -145,000 Net cash (used in)/provided by -322,579 243,808 financing activities Net (decrease)/increase in -97,659 77,382 cash and cash equivalents Beginning cash and 775,157 651,555 cash equivalents Ending cash and cash $ 677,498 $ 728,937 equivalents

(Unaudited) We aggregate our homebuilding operating segments into reporting segments based on similar long-term economic characteristics and geographical proximity. Our three reportable homebuilding segments are as follows:

• East: Alabama, Florida, Georgia, Mississippi, North Carolina and South Carolina

Reconciliation of Non-GAAP Information (Dollars in thousands): This press release includes comments and discussion about our operating results that reflect certain adjustments, including to home closing gross profit, home closing gross margin, earnings before income taxes, net earnings, diluted earnings per common share, and debt-to-capital ratios. These are considered non- GAAP financial measures and should be considered in addition to, rather than as a substitute for, the comparable GAAP financial measures. We believe these non- GAAP financial measures are relevant and useful to investors in understanding our operating results and may be helpful in comparing our company with other companies in the homebuilding and other industries to the extent they provide similar information. We encourage investors to understand the methods used by other companies to calculate these non-GAAP financial measures and any adjustments thereto before comparing to our non-GAAP financial measures.

Meritage is the fifth-largest public homebuilder in the United States, based on homes closed in 2025. The Company offers energy-efficient and affordable entry- level and first move-up homes. Operations span across Arizona, California, Colorado, Utah, Tennessee, Texas, Alabama, Florida, Georgia, Mississippi, North Carolina, and South Carolina.

Meritage has delivered over 220,000 homes in its 41-year history, and has a reputation for its distinctive style, quality construction, and award-winning customer experience. The Company is an industry leader in energy-efficient homebuilding, an eleven-time recipient of the U.S. Environmental Protection Agency’s (EPA) ENERGY STAR® Partner of the Year for Sustained Excellence Award and Residential New Construction Market Leader Award, as well as a four-time recipient of the EPA's Indoor airPLUS Leader Award.

The information included in this press release contains forward-looking statements within the meaning of the Private Securities Litigation Reform Act of 1995. Such statements include expectations about the housing market in general and the strength of our balance sheet.

Such statements are based on the current beliefs and expectations of Company management and current market conditions, which are subject to significant uncertainties and fluctuations. Actual results may differ from those set forth in the forward-looking statements. The Company makes no commitment, and disclaims any duty, except as required by law, to update or revise any forward- looking statements to reflect future events or changes in these expectations. Meritage's business is subject to a number of risks and uncertainties. As a result of those risks and uncertainties, the Company's stock and note prices may fluctuate dramatically. These risks and uncertainties include, but are not limited to, the following: increases in interest rates or decreases in mortgage availability, and the cost and use of rate locks and buy-downs; the cost of materials used to develop communities and construct homes; shortages in the availability and cost of subcontract labor; legislation related to tariffs; cancellation rates; supply chain and labor constraints; the ability of our potential buyers to sell their existing homes; the adverse effect of slow absorption rates; our ability to acquire and develop lots may be negatively impacted if we are unable to obtain performance and surety bonds; impairments of our real estate inventory; competition; home warranty and construction defect claims; failures in health and safety performance; fluctuations in quarterly operating results; our level of indebtedness; our exposure to counterparty risk with respect to our capped calls; our ability to obtain financing if our credit ratings are downgraded; our exposure to and impacts from natural disasters or severe weather conditions; the availability and cost of finished lots and undeveloped land; the success of our strategy to offer and market entry-level and first move-up homes; a change to the feasibility of projects under option or contract that could result in the write-down or write-off of earnest money or option deposits; our limited geographic diversification; sustainability matters and disclosures; our exposure to information technology failures and security breaches and the impact thereof; the loss of key personnel; changes in tax laws that adversely impact us or our homebuyers; our inability to prevail on contested tax positions; failure of our employees and representatives to comply with laws and regulations; our compliance with government regulations; liabilities or restrictions resulting from regulations applicable to our financial services operations; negative publicity that affects our reputation; potential disruptions to our business by an epidemic or pandemic, and measures that federal, state and local 14 governments and/or health authorities implement to address it; and other factors identified in documents filed by the Company with the Securities and Exchange Commission, including those set forth in our Form 10-K for the year ended December 31, 2025 and our subsequent Form 10-Qs under the caption "Risk Factors," which can be found on our website at https://investors.meritagehomes.com. 15

Full text with the tables
                                                                                
  Exhibit 99.1                                                                  
                                                                                
                                                                                
  Contacts:    Emily Tadano, VP Investor Relations and External Communications  
               -480) 515-8979 (office                                           
               [email protected]                                      
                                                                                
                                                                                
               Meritage Homes reports third quarter 2026 results                
                                                                                
SCOTTSDALE, Ariz., October 28, 2026 - Meritage Homes Corporation (NYSE: MTH),
the fifth-largest U.S. homebuilder, reported third quarter results for the
period ended September 30, 2026.
                                                                                
                     Summary Operating Results (unaudited)                      
                                                                                
                (Dollars in thousands, except per share amounts)                
                                                                                
       T…                                    N…                                 
       M…                                    M…                                 
       E…                                    E…                                 
  …    S…                                    S…                                 
  …    3…                      %             3…                      %          
  …    2…    3…    2…    3…    C…  (…  %     2…    9…    2…    1…    C…  (…  %  
 ────────────────────────────────────────────────────────────────────────────── 
  …                                                                             
  …    $     1…    $     1…        -…  %     $     3…    $     4…        -…  %  
  …                                                                             
  …                                                                             
  …                                                                             
  …    $     3…    $     3…        -4  %     $     3…    $     3…        -4  %  
  —                                                                             
  …                                                                             
  …                                                                             
  …          3…          3…        -…  %           1…          1…        -…  %  
  …                                                                             
  …                                                                             
  …    $     1…    $     1…        -…  %     $     3…    $     4…        -…  %  
  …                                                                             
  …                                                                             
  …                                                                             
  …    $     3…    $     3…        -2  %     $     3…    $     3…        -3  %  
  —                                                                             
  …                                                                             
  …                                                                             
  …                                                1…          1…        -5  %  
  …                                                                             
  …                                                                             
  …                                          $     6…    $     6…        -5  %  
  …                                                                             
  …                                                                             
  …                                                                             
  …                                          $     3…    $     3…         1  %  
  —                                                                             
  …                                                                             
  …                                                                             
  …          1…          1…            (…          1…          2…            …  
  …                                    b…                                    …  
  …                                                                             
  …                                                                             
  …    $     8…    $     1…        -…  %     $     2…    $     4…        -…  %  
  …                                                                             
  …                                                                             
  …    $     6…    $     9…        -…  %     $     2…    $     3…        -…  %  
  …                                                                             
  …    $     1…    $     1…        -…  %     $     3…    $     5…        -…  %  
  …                                                                             
                                                                                
                                       1                                        
                                                                                
  MANAGEMENT COMMENTS                                                           
                                                                                
"In the third quarter of 2026, we navigated an increasingly challenging
homebuying environment marked by rising mortgage interest rates and persistent
geopolitical and macroeconomic uncertainty. Constrained affordability weighed on
consumer sentiment, which was reflected in our 15% year-over-year decline in
third quarter orders despite achieving an average absorption pace of 3.0 net
sales per month per store," said Steven J. Hilton, executive chairman of
Meritage Homes. "In light of current market conditions, we intentionally focused
on preserving margins rather than pursuing a higher sales pace."

"We were able to convert nearly 190% of our backlog this quarter, delivering
3,187 homes across our larger footprint of 348 communities," added Phillippe
Lord, chief executive officer of Meritage Homes. "Third quarter 2026 home
closing revenue of $1.2 billion generated adjusted home closing gross margin of
17.9%, excluding $6.0 million of real estate inventory impairments and
terminated land deal walk-away charges, and SG&A as a percentage of home closing
revenue of 11.0%, nearly in line with the prior year period as we were able to
leverage our larger size and cost control initiatives to maximize
profitability."

"In today's volatile market, prudently managing capital is a key priority, as we
continue to focus on maintaining sufficient liquidity. During the quarter, we
pulled back our land investments by almost 40% year-over-year to $329 million
and returned $86 million to shareholders via share repurchases and dividends. We
are confident that the strength of our balance sheet and prudence around cash
preservation will be a differentiator, as we expect market conditions to
continue to be unpredictable over the next several quarters. In the first nine
months of 2026, we have returned nearly $380 million of capital to shareholders,
representing 177% of total earnings so far this year," concluded Mr. Lord. "We
ended the third quarter of 2026 with cash of $677 million, no borrowings under
our revolving credit facility, and a net debt-to-capital ratio of 18.9%. As of
September 30, 2026, our book value per share increased 4% year-over-year."
                                       2                                        
                                                                                
  THIRD QUARTER RESULTS                                                         
                                                                                
• Orders of 3,083 homes for the third quarter of 2026 decreased 15% year-over-
year as a result of 21% lower average absorption pace, which was partially
offset by a 7% increase in average community count. Third quarter 2026 average
sales price ("ASP") on orders of $383,000 was down 2% from the third quarter of
2025, primarily due to higher utilization of incentives and related costs
including rate buy-downs, as well as geographic mix.

• The 17% year-over-year decrease in home closing revenue in the third quarter
of 2026 to $1.2 billion was due to 14% lower closing volume of 3,187 homes
combined with a 4% decrease in ASP on closings to $365,000. The year-over-year
decline in ASP on closings was primarily due to higher utilization of incentives
and related costs including rate buy-downs, as well as geographic mix.

• Home closing gross margin of 17.4% in the third quarter of 2026 was 170 bps
lower than 19.1% in the prior year as a result of higher lot and incentive costs
coupled with lost leverage on lower home closing revenue, which were partially
offset by direct cost savings and lower performance-based compensation expense.
Excluding $6.6 million of real estate inventory impairments and a $0.6 million
net credit related to terminated land deal walk-away charges in the third
quarter of 2026, and $8.7 million of real estate inventory impairments and $5.8
million in terminated land deal walk-away charges in the prior year, adjusted
home closing gross margin was 17.9% and 20.1% for the third quarters of 2026 and
2025, respectively. In the third quarter of 2026, we incurred $0.9 million of
terminated land deal walk-away charges, which were more than offset by $1.5
million of recoveries related to previously incurred walk-away charges.

• Selling, general and administrative expenses ("SG&A") as a percentage of third
quarter 2026 home closing revenue were 11.0% compared to 10.8% in the third
quarter of 2025, as a result of lost leverage on lower home closing revenue and
higher technology costs, which were partially offset by an intentional pull back
in discretionary expenses and decreased performance-based compensation expense.

• The third quarter effective income tax rate was 20.1% in 2026 compared to
22.6% in 2025. The 2026 tax rate reflected acquired below-market transferable
clean fuel production tax credits.

• Net earnings were $68 million ($1.04 per diluted share) for the third quarter
of 2026, a 32% decrease from $99 million ($1.39 per diluted share) for the third
quarter of 2025, mainly resulting from lower home closing revenue and gross
profit. Excluding quarterly impairments and walk-away charges for each period,
adjusted diluted EPS was $1.11 and $1.55 for the third quarters of 2026 and
2025, respectively.
                                                                                
  YEAR TO DATE RESULTS                                                          
                                                                                
                                                                                
  •                                                                             
                                                                                
Total sales orders for the first nine months of 2026 decreased 10% year-over-
year, reflecting a 20% decrease in average absorption pace partially offset by a
12% increase in average communities compared to the first nine months of 2025.
The 3% lower ASP on orders for the first nine months of 2026 compared to prior
year was
                                       3                                        
primarily due to higher utilization of incentives and related costs including
rate buy-downs, as well as geographic mix.

• Home closing revenue decreased 16% year-over-year in the first nine months of
2026 to $3.7 billion, driven by 12% lower home closing volume and a 4% decrease
in ASP on closings compared to the first nine months of 2025. The year-over-year
decline in ASP on closings reflected higher utilization of incentives and
related costs including rate buy-downs, as well as geographic mix.

• Home closing gross margin of 17.8% decreased 290 bps in the first nine months
of 2026 from 20.7% in the prior year due to higher lot and incentive costs
coupled with lost leverage on lower home closing revenue, which were partially
offset by direct cost savings and lower performance-based compensation expense.
Excluding $12.6 million of real estate inventory impairments and $1.0 million in
terminated land deal walk-away charges in the first nine months of 2026 and $8.7
million of real estate inventory impairments and $11.4 million in terminated
land deal walk-away charges in the prior year, adjusted home closing gross
margin was 18.1% and 21.2% for the first nine months of 2026 and 2025,
respectively.

• SG&A as a percentage of home closing revenue was 11.0% in the first nine
months of 2026 compared to 10.7% in the prior year, as a result of lost leverage
on lower home closing revenue and higher technology costs, which were partially
offset by an intentional pull back in discretionary expenses and decreased
performance-based compensation expense.

• The effective income tax rate in the first nine months of 2026 was 23.1%
compared to 23.4% in 2025.

• Net earnings were $214 million ($3.22 per diluted share) for the first nine
months of 2026, a 42% decrease from $369 million ($5.13 per diluted share) for
the first nine months of 2025, primarily reflecting lower home closing revenue
and gross margins. Excluding year-to-date impairments and walk-away charges for
each period, adjusted diluted EPS was $3.38 and $5.35 for the first nine months
of 2026 and 2025, respectively.
                                                                                
  BALANCE SHEET & LIQUIDITY                                                     
                                                                                
• Cash and cash equivalents at September 30, 2026 totaled $677 million. This
compared to cash and cash equivalents of $775 million at December 31, 2025.

• Land acquisition and development spend, net of land development
reimbursements, totaled $329 million and $528 million for the third quarter of
2026 and 2025, respectively.

• Approximately 71,800 lots were owned or controlled as of September 30, 2026,
compared to approximately 80,800 lots as of September 30, 2025. Nearly 2,000 net
new lots were added in the third quarter of 2026, representing an estimated 21
future communities.

• Third quarter 2026 ending community count of 348 was up 4% compared to prior
year and up 2% sequentially from the second quarter of 2026.
                                       4                                        
• Debt-to-capital and net debt-to-capital ratios were 26.9% and 18.9%,
respectively, at September 30, 2026, which compared to 26.0% and 16.9%,
respectively, at December 31, 2025.

• The Company declared and paid quarterly cash dividends of $0.48 per share
totaling $31 million in the third quarter of 2026. This compared to $0.43 per
share totaling $30 million in the third quarter of 2025. Year-to-date dividends
paid were $94 million and $92 million in 2026 and 2025, respectively.

• During the third quarter of 2026, the Company repurchased 757,128 shares of
stock, or 1.2% of shares outstanding at the beginning of the quarter, for $55
million, consistent with the third quarter of 2025. For the first nine months of
2026, the Company repurchased 4,101,288 shares of stock, or 6.0% of shares
outstanding at the beginning of the year, for $285 million, up 97% compared to
prior year of $145 million. As of September 30, 2026, $229 million remained
available to repurchase.
                                                                                
  CONFERENCE CALL                                                               
                                                                                
Management will host a conference call to discuss its third quarter 2026 results
at 8:00 a.m. Pacific Time (11:00 a.m. Eastern Time) on Thursday, October 29,
2026. To listen, please go to Meritage's Investor Relations page for the live
webcast or dial in to 1-800-445-7795 US toll free or 1-785-424-1699. A replay
will be available on the Investor Relations page.
                                       5                                        
                                                                                
                  Meritage Homes Corporation and Subsidiaries                   
                                                                                
                                                                                
                         Consolidated Income Statements                         
                                                                                
                     (In thousands, except per share data)                      
                                                                                
                                  (Unaudited)                                   
                                                                                
                   Thr…                                                         
                   Mon…                                                         
                   End…                                                         
                   Sep…                                                         
                   30,                          Chan…          Chan…            
  Hom…             2026           2025          $              %                
 ────────────────────────────────────────────────────────────────────────────── 
          Home                                                                  
          clos…    $     1,16…    $     1,3…    $      -23…           -17  %    
          reve…                                                                 
          Land                                                                  
          clos…          6,081          16,…           -9,…           -62  %    
          reve…                                                                 
          Total                                                                 
          clos…          1,16…          1,4…           -24…           -17  %    
          reve…                                                                 
          Cost                                                                  
          of             -959…          -1,…           -17…           -15  %    
          home                                                                  
          clos…                                                                 
          Cost                                                                  
          of             -5,9…          -15…           -9,…           -62  %    
          land                                                                  
          clos…                                                                 
          Total                                                                 
          cost           -965…          -1,…           -18…           -16  %    
          of                                                                    
          clos…                                                                 
          Home                                                                  
          clos…          202,…          266…           -64…           -24  %    
          gross                                                                 
          prof…                                                                 
          Land                                                                  
          clos…            124           192            -68           -35  %    
          gross                                                                 
          prof…                                                                 
          Total                                                                 
          clos…          202,…          267…           -64…           -24  %    
          gross                                                                 
          prof…                                                                 
  Fin…                                                                          
  Ser…                                                                          
          Reve…          7,497          8,4…           -963           -11  %    
          Expe…          -3,9…          -4,…           -329            -8  %    
          Earn…                                                                 
          from                                                                  
          fina…                                                                 
          serv…                                                                 
          unco…          1,244           331            913           276  %    
          enti…                                                                 
          and                                                                   
          othe…                                                                 
          net                                                                   
          Fina…                                                                 
          serv…          4,759          4,4…            279             6  %    
          prof…                                                                 
  Com…                                                                          
  and                                                                           
  oth…                   -82,…          -99…           -17…           -17  %    
  sal…                                                                          
  cos…                                                                          
  Gen…                                                                          
  and                    -45,…          -51…           -6,…           -13  %    
  adm…                                                                          
  exp…                                                                          
  Int…                   -1,3…             —           1,3…                N/A  
  exp…                                                                          
  Oth…                                                                          
  inc…                   6,289          8,1…           -1,…           -23  %    
  net                                                                           
  Ear…                                                                          
  bef…                   84,8…          128…           -43…           -34  %    
  inc…                                                                          
  tax…                                                                          
  Pro…                                                                          
  for                    -17,…          -28…           -11…           -41  %    
  inc…                                                                          
  tax…                                                                          
  Net              $     67,7…    $     99,…    $      -31…           -32  %    
  ear…                                                                          
  Ear…                                                                          
  per                                                                           
  com…                                                                          
  sha…                                                                          
                                                Chan…          Chan…            
          Basic                                 $ or           %                
                                                shar…                           
          Earn…                                                                 
          per      $      1.05    $     1.40    $      -0.…           -25  %    
          comm…                                                                 
          share                                                                 
          Weig…                                                                 
          aver…          64,6…          70,…           -5,…            -8  %    
          shar…                                                                 
          outs…                                                                 
          Dilu…                                                                 
          Earn…                                                                 
          per      $      1.04    $     1.39    $      -0.…           -25  %    
          comm…                                                                 
          share                                                                 
          Weig…                                                                 
          aver…          65,1…          71,…           -6,…            -9  %    
          shar…                                                                 
          outs…                                                                 
                                                                                
                                       6                                        
                                                                                
                   Nine                                                         
                   Mon…                                                         
                   End…                                                         
                   Sep…                                                         
                   30,                          Chan…          Chan…            
  Hom…             2026           2025          $              %                
 ────────────────────────────────────────────────────────────────────────────── 
          Home                                                                  
          clos…    $     3,65…    $     4,3…    $      -69…           -16  %    
          reve…                                                                 
          Land                                                                  
          clos…          28,1…          39,…           -11…           -29  %    
          reve…                                                                 
          Total                                                                 
          clos…          3,68…          4,3…           -71…           -16  %    
          reve…                                                                 
          Cost                                                                  
          of             -3,0…          -3,…           -44…           -13  %    
          home                                                                  
          clos…                                                                 
          Cost                                                                  
          of             -27,…          -37…           -9,…           -25  %    
          land                                                                  
          clos…                                                                 
          Total                                                                 
          cost           -3,0…          -3,…           -45…           -13  %    
          of                                                                    
          clos…                                                                 
          Home                                                                  
          clos…          650,…          903…           -25…           -28  %    
          gross                                                                 
          prof…                                                                 
          Land                                                                  
          clos…            379          2,6…           -2,…           -86  %    
          gross                                                                 
          prof…                                                                 
          Total                                                                 
          clos…          650,…          906…           -25…           -28  %    
          gross                                                                 
          prof…                                                                 
  Fin…                                                                          
  Ser…                                                                          
          Reve…          21,5…          24,…           -3,…           -14  %    
          Expe…          -11,…          -13…           -1,…           -11  %    
          Earn…                                                                 
          from                                                                  
          fina…                                                                 
          serv…                                                                 
          unco…          3,759          1,8…           1,9…           104  %    
          enti…                                                                 
          and                                                                   
          othe…                                                                 
          net                                                                   
          Fina…                                                                 
          serv…          13,5…          13,…            -75            -1  %    
          prof…                                                                 
  Com…                                                                          
  and                                                                           
  oth…                   -253…          -30…           -49…           -16  %    
  sal…                                                                          
  cos…                                                                          
  Gen…                                                                          
  and                    -148…          -16…           -15…            -9  %    
  adm…                                                                          
  exp…                                                                          
  Int…                   -4,1…             —           4,1…                N/A  
  exp…                                                                          
  Oth…                                                                          
  inc…                   20,7…          28,…           -7,…           -27  %    
  net                                                                           
  Ear…                                                                          
  bef…                   277,…          481…           -20…           -42  %    
  inc…                                                                          
  tax…                                                                          
  Pro…                                                                          
  for                    -64,…          -11…           -48…           -43  %    
  inc…                                                                          
  tax…                                                                          
  Net              $     213,…    $     368…    $      -15…           -42  %    
  ear…                                                                          
  Ear…                                                                          
  per                                                                           
  com…                                                                          
  sha…                                                                          
                                                Chan…          Chan…            
          Basic                                 $ or           %                
                                                shar…                           
          Earn…                                                                 
          per      $      3.24    $     5.17    $      -1.…           -37  %    
          comm…                                                                 
          share                                                                 
          Weig…                                                                 
          aver…          65,9…          71,…           -5,…            -8  %    
          shar…                                                                 
          outs…                                                                 
          Dilu…                                                                 
          Earn…                                                                 
          per      $      3.22    $     5.13    $      -1.…           -37  %    
          comm…                                                                 
          share                                                                 
          Weig…                                                                 
          aver…          66,3…          71,…           -5,…            -8  %    
          shar…                                                                 
          outs…                                                                 
                                                                                
                                       7                                        
                                                                                
                  Meritage Homes Corporation and Subsidiaries                   
                                                                                
                                                                                
                          Consolidated Balance Sheets                           
                                                                                
                       (In thousands, except share data)                        
                                                                                
                                  (Unaudited)                                   
                                                                                
                                    September 30, 2026       December 31, 2025  
 ────────────────────────────────────────────────────────────────────────────── 
  Assets:                                                                       
  Cash and cash equivalents      $             677,498    $            775,157  
  Other receivables                            345,535                 306,956  
  Real estate(1)                             6,014,511               5,987,120  
  Deposits on real estate                                                       
  under option or                              170,777                 174,170  
  contract                                                                      
  Investments in                                64,225                  57,268  
  unconsolidated entities                                                       
  Property and equipment, net                   45,057                  46,647  
  Deferred tax asset, net                       44,427                  53,293  
  Prepaids, other assets and                   227,614                 221,676  
  goodwill                                                                      
  Total assets                   $           7,589,644    $          7,622,287  
  Liabilities:                                                                  
  Accounts payable               $             209,249    $            200,679  
  Accrued and other                            476,658                 387,698  
  liabilities                                                                   
  Home sale deposits                             7,627                   9,213  
  Loans payable and other                       42,351                  24,328  
  borrowings                                                                    
  Senior and convertible                     1,809,401               1,804,726  
  senior notes, net                                                             
  Total liabilities                          2,545,286               2,426,644  
  Stockholders' Equity:                                                         
  Preferred stock                                    —                       —  
  Common stock, par value                                                       
  $0.01.                                                                        
  Authorized 125,000,000                                                        
  shares;                                                                       
  64,423,225 and 68,168,923                        644                     682  
  shares issued                                                                 
  and outstanding at                                                            
  September 30, 2026                                                            
  and December 31, 2025,                                                        
  respectively                                                                  
  Additional paid-in capital                         —                       —  
  Retained earnings                          5,043,714               5,194,961  
  Total stockholders’ equity                 5,044,358               5,195,643  
  Total liabilities and                                                         
  stockholders’                  $           7,589,644    $          7,622,287  
  equity                                                                        
  (1)Real estate – Allocated                                                    
  costs:                                                                        
  Homes completed and under      $           2,045,060    $          2,069,548  
  construction                                                                  
  Finished home sites and                                                       
  home sites under                           3,842,767               3,917,572  
  development                                                                   
  Consolidated real estate                     126,684                       —  
  not owned                                                                     
  Total real estate              $           6,014,511    $          5,987,120  
                                                                                
                                       8                                        
                                                                                
                  Meritage Homes Corporation and Subsidiaries                   
                                                                                
                                                                                
                     Consolidated Statements of Cash Flows                      
                                                                                
                                 (In thousands)                                 
                                                                                
                                  (Unaudited)                                   
                                                                                
                            Nine Months Ended                                   
  Cash flows from           September 30,                                       
  operating activities:     2026                                2025            
 ────────────────────────────────────────────────────────────────────────────── 
  Net earnings              $                        213,723    $      368,982  
  Adjustments to                                                                
  reconcile net earnings                                                        
  to                                                                            
  net cash provided                                                             
  by/(used in) operating                                                        
  activities:                                                                   
  Depreciation and                                    16,973            18,603  
  amortization                                                                  
  Real estate and land                                12,648             9,292  
  impairments                                                                   
  Write-off of                                         1,006            11,437  
  terminated land deals                                                         
  Stock-based                                         16,788            14,780  
  compensation                                                                  
  Equity in earnings                                                            
  from unconsolidated                                 -2,941            -3,133  
  entities                                                                      
  Distribution of                                                               
  earnings from                                        3,325             3,732  
  unconsolidated                                                                
  entities                                                                      
  Other                                                8,972             7,415  
  Changes in assets and                                                         
  liabilities:                                                                  
  Decrease/(increase) in                              58,676          -413,224  
  real estate                                                                   
  Increase in deposits                                                          
  on real estate                                      -1,431            -9,010  
  under option or                                                               
  contract                                                                      
  Increase in other                                                             
  receivables, prepaids                              -42,770           -77,840  
  and other assets                                                              
  Decrease in accounts                                                          
  payable and accrued                                -23,860           -45,326  
  and other liabilities                                                         
  Decrease in home sale                               -1,586           -11,093  
  deposits                                                                      
  Net cash provided                                                             
  by/(used in) operating                             259,523          -125,385  
  activities                                                                    
  Cash flows from                                                               
  investing activities:                                                         
  Investments in                                                                
  unconsolidated                                     -21,270           -21,080  
  entities                                                                      
  Distributions of                                                              
  capital from                                           350                 —  
  unconsolidated                                                                
  entities                                                                      
  Purchases of property                              -13,917           -20,145  
  and equipment                                                                 
  Proceeds from sales of                                                        
  property and                                           234               184  
  equipment                                                                     
  Maturities/sales of                                                           
  investments and                                          —             1,750  
  securities                                                                    
  Payments to purchase                                                          
  investments and                                          —            -1,750  
  securities                                                                    
  Net cash used in                                   -34,603           -41,041  
  investing activities                                                          
  Cash flows from                                                               
  financing activities:                                                         
  Repayment of loans                                                            
  payable and other                                   -3,302           -11,522  
  borrowings                                                                    
  Proceeds from issuance                                   —           497,195  
  of senior notes                                                               
  Payment of debt                                          —            -5,106  
  issuance costs                                                                
  Proceeds from                                                                 
  liabilities related to                              59,947                 —  
  consolidated real                                                             
  estate not owned                                                              
  Dividends paid                                     -94,224           -91,759  
  Repurchase of shares                              -285,000          -145,000  
  Net cash (used                                                                
  in)/provided by                                   -322,579           243,808  
  financing                                                                     
  activities                                                                    
  Net                                                                           
  (decrease)/increase in                             -97,659            77,382  
  cash and cash                                                                 
  equivalents                                                                   
  Beginning cash and                                 775,157           651,555  
  cash equivalents                                                              
  Ending cash and cash      $                        677,498    $      728,937  
  equivalents                                                                   
                                                                                
                                       9                                        
                                                                                
                  Meritage Homes Corporation and Subsidiaries                   
                                                                                
                                                                                
                                 Operating Data                                 
                                                                                
                             (Dollars in thousands)                             
                                                                                
                                  (Unaudited)                                   
We aggregate our homebuilding operating segments into reporting segments based
on similar long-term economic characteristics and geographical proximity. Our
three reportable homebuilding segments are as follows:

• West: Arizona, California, Colorado, and Utah

• Central: Tennessee and Texas

• East: Alabama, Florida, Georgia, Mississippi, North Carolina and South
Carolina
                                                                                
            Three                                                               
            Months                                                              
            Ended                                                               
            Septem…                                                             
            30,                                                                 
  Homes     2026                                2025                            
  Close…    Homes             Value             Homes           Value           
 ────────────────────────────────────────────────────────────────────────────── 
  West                 710    $      341,836             883    $      420,658  
  Region                                                                        
  Centr…             1,170           383,964           1,260           443,086  
  Region                                                                        
  East               1,307           436,552           1,542           535,591  
  Region                                                                        
  Total              3,187    $      1,162,…           3,685    $      1,399,…  
  Homes                                                                         
  Order…                                                                        
  West                 706    $      352,026             867    $      426,509  
  Region                                                                        
  Centr…             1,132           396,999           1,289           468,690  
  Region                                                                        
  East               1,245           430,241           1,480           519,890  
  Region                                                                        
  Total              3,083    $      1,179,…           3,636    $      1,415,…  
                                                                                
                                                                                
            Nine                                                                
            Months                                                              
            Ended                                                               
            Septe…                                                              
            30,                                                                 
  Homes     2026                                2025                            
  Close…    Homes             Value             Homes            Value          
 ────────────────────────────────────────────────────────────────────────────── 
  West               2,221    $      1,078,…            3,046    $      1,449…  
  Region                                                                        
  Centr…             3,586           1,206,…            3,821           1,336…  
  Region                                                                        
  East               4,072           1,372,…            4,404           1,571…  
  Region                                                                        
  Total              9,879    $      3,658,…           11,271    $      4,357…  
  Homes                                                                         
  Order…                                                                        
  West               2,366    $      1,187,…            2,961    $      1,450…  
  Region                                                                        
  Centr…             3,707           1,294,…            3,952           1,433…  
  Region                                                                        
  East               4,249           1,474,…            4,513           1,636…  
  Region                                                                        
  Total             10,322    $      3,956,…           11,426    $      4,520…  
                                                                                
                                                                                
            At                                                                  
            Septem…                                                             
            30,                                                                 
  Order     2026                                2025                            
  Backl…    Homes             Value             Homes           Value           
 ────────────────────────────────────────────────────────────────────────────── 
  West                 330    $      170,668             350    $      176,493  
  Region                                                                        
  Centr…               578           217,191             612           232,018  
  Region                                                                        
  East                 703           249,308             737           261,496  
  Region                                                                        
  Total              1,611    $      637,167           1,699    $      670,007  
                                                                                
                                       10                                       
                                                                                
       T…                                     …                                 
       M…                                     …                                 
       E…                                     …                                 
       S…                                     …                                 
       3…                                     …                                 
       2…                  2…                 …                 …               
       E…        A…        E…        …        …        …        …        …      
  …                                                                             
  …                                                                             
  …        92        9…        85       8…       92       8…       85       8…  
  …                                                                             
  …        1…        1…        97       9…       1…       1…       97       8…  
  …                                                                             
  …        1…        1…        1…       1…       1…       1…       1…       1…  
  …                                                                             
  …        3…        3…        3…       3…       3…       3…       3…       3…  
                                                                                
                                       11                                       
                                                                                
                  Meritage Homes Corporation and Subsidiaries                   
                                                                                
                                                                                
                      Supplement and Non-GAAP information                       
                                                                                
                                  (Unaudited)                                   
                                                                                
                Supplemental Information (Dollars in thousands):                
                                                                                
         Thr…                                Nine                               
         Mon…                                Mon…                               
         End…                                End…                               
         Sep…                                Sep…                               
         30,                                 30,                                
         2026                2025            2026               20…             
 ────────────────────────────────────────────────────────────────────────────── 
  De…                                                                           
  and    $           5,5…    $       5,9…    $          16,…    $          18…  
  am…                                                                           
  Su…                                                                           
  of                                                                            
  Ca…                                                                           
  In…                                                                           
  Ca…                                                                           
  in…                                                                           
  be…    $     86,…          $       63,…    $     77…          $    53,…       
  of                                                                            
  pe…                                                                           
  In…          20,…                  20,…          60…               54,…       
  in…                                                                           
  In…          -1,…                     —          -4…                  —       
  ex…                                                                           
  In…                                                                           
  am…                                                                           
  to                                                                            
  co…                                                                           
  of           -13…                  -12…          -4…               -37…       
  ho…                                                                           
  and                                                                           
  la…                                                                           
  cl…                                                                           
  Ca…                                                                           
  in…                                                                           
  end    $     92,…          $       71,…    $     92…          $    71,…       
  of                                                                            
  pe…                                                                           
                                                                                
         Reconciliation of Non-GAAP Information (Dollars in thousands):         
This press release includes comments and discussion about our operating results
that reflect certain adjustments, including to home closing gross profit, home
closing gross margin, earnings before income taxes, net earnings, diluted
earnings per common share, and debt-to-capital ratios. These are considered non-
GAAP financial measures and should be considered in addition to, rather than as
a substitute for, the comparable GAAP financial measures. We believe these non-
GAAP financial measures are relevant and useful to investors in understanding
our operating results and may be helpful in comparing our company with other
companies in the homebuilding and other industries to the extent they provide
similar information. We encourage investors to understand the methods used by
other companies to calculate these non-GAAP financial measures and any
adjustments thereto before comparing to our non-GAAP financial measures.
                                                                                
  H…                                                                            
  C…                                                                            
  G…                                                                            
  P…                                                                            
  a…          Th…                                  Ni…                          
  H…          Mo…                                  Mo…                          
  C…          En…                                  En…                          
  G…          Se…                                  Se…                          
  M…    2026  30,          20…               2026  30,          20…             
 ────────────────────────────────────────────────────────────────────────────── 
  H…                                                                            
  c…    $          202…    $          26…    $          650…    $          90…  
  g…                                                                            
  p…                                                                            
  H…                                                                            
  c…          17…     %         19.1    %          17…     %         20.7    %  
  g…                                                                            
  m…                                                                            
  A…                                                                            
  R…               6,6…               8,…               12,…               8,…  
  e…                                                                            
  i…                                                                            
  A…                                                                            
  W…                                                                            
  of               -643               5,…               1,0…               11…  
  t…                                                                            
  l…                                                                            
  d…                                                                            
  A…                                                                            
  h…                                                                            
  c…    $          208…    $          28…    $          663…    $          92…  
  g…                                                                            
  p…                                                                            
  A…                                                                            
  h…                                                                            
  c…          17…     %         20.1    %          18…     %         21.2    %  
  g…                                                                            
  m…                                                                            
                                                                                
                                       12                                       
                                                                                
  E…                                                                            
  b…                                                                            
  i…                                                                            
  t…                                                                            
  N…                                                                            
  e…                                                                            
  a…    Thr…                                 Nine                               
  D…    Mon…                                 Mon…                               
  e…    End…                                 End…                               
  p…    Sep…                                 Sep…                               
  c…    30,                                  30,                                
  s…    2026               20…               2026               20…             
 ────────────────────────────────────────────────────────────────────────────── 
  E…                                                                            
  b…    $          84,…    $          12…    $          277…    $          48…  
  i…                                                                            
  t…                                                                            
  A…                                                                            
  R…               6,8…               8,…               12,…               8,…  
  e…                                                                            
  i…                                                                            
  A…                                                                            
  W…                                                                            
  of               -643               5,…               1,0…               11…  
  t…                                                                            
  l…                                                                            
  d…                                                                            
  A…                                                                            
  e…                                                                            
  b…    $          91,…    $          14…    $          291…    $          50…  
  i…                                                                            
  t…                                                                            
  I…                                                                            
  t…          24…     %         22.6    %          24…     %         23.4    %  
  r…                                                                            
  A…                                                                            
  p…                                                                            
  f…               -18…               -3…               -67…               -1…  
  i…                                                                            
  t…                                                                            
  A…                                                                            
  n…               72,…               11…               224…               38…  
  e…                                                                            
  D…                                                                            
  e…                                                                            
  p…    $     1.…          $    1.39         $     3.…          $    5.13       
  c…                                                                            
  s…                                                                            
  A…                                                                            
  d…                                                                            
  e…    $     1.…          $    1.55         $     3.…          $    5.35       
  p…                                                                            
  c…                                                                            
  s…                                                                            
                                                                                
                                                                                
  Debt-to-Capi…    September 30,                   December 31,                 
  Ratios           2026                            2025                         
 ────────────────────────────────────────────────────────────────────────────── 
  Senior and                                                                    
  convertible                                                                   
  senior notes,                                                                 
  net              $                  1,851,752    $                 1,829,054  
  and loans                                                                     
  payable and                                                                   
  other                                                                         
  borrowings                                                                    
  Stockholders'                       5,044,358                      5,195,643  
  equity                                                                        
  Total capital    $                  6,896,110    $                 7,024,697  
  Debt-to-capi…                           26.9%                          26.0%  
  Senior and                                                                    
  convertible                                                                   
  senior notes,                                                                 
  net              $                  1,851,752    $                 1,829,054  
  and loans                                                                     
  payable and                                                                   
  other                                                                         
  borrowings                                                                    
  Less: cash                                                                    
  and cash                             -677,498                       -775,157  
  equivalents                                                                   
  Net debt         $                  1,174,254    $                 1,053,897  
  Stockholders’                       5,044,358                      5,195,643  
  equity                                                                        
  Total net        $                  6,218,612    $                 6,249,540  
  capital                                                                       
  Net                                     18.9%                          16.9%  
  debt-to-capi…                                                                 
                                                                                
                                       13                                       
                                                                                
  About Meritage Homes Corporation                                              
                                                                                
Meritage is the fifth-largest public homebuilder in the United States, based on
homes closed in 2025. The Company offers energy-efficient and affordable entry-
level and first move-up homes. Operations span across Arizona, California,
Colorado, Utah, Tennessee, Texas, Alabama, Florida, Georgia, Mississippi, North
Carolina, and South Carolina.

Meritage has delivered over 220,000 homes in its 41-year history, and has a
reputation for its distinctive style, quality construction, and award-winning
customer experience. The Company is an industry leader in energy-efficient
homebuilding, an eleven-time recipient of the U.S. Environmental Protection
Agency’s (EPA) ENERGY STAR® Partner of the Year for Sustained Excellence Award
and Residential New Construction Market Leader Award, as well as a four-time
recipient of the EPA's Indoor airPLUS Leader Award.

For more information, visit www.meritagehomes.com.

The information included in this press release contains forward-looking
statements within the meaning of the Private Securities Litigation Reform Act of
1995. Such statements include expectations about the housing market in general
and the strength of our balance sheet.

Such statements are based on the current beliefs and expectations of Company
management and current market conditions, which are subject to significant
uncertainties and fluctuations. Actual results may differ from those set forth
in the forward-looking statements. The Company makes no commitment, and
disclaims any duty, except as required by law, to update or revise any forward-
looking statements to reflect future events or changes in these expectations.
Meritage's business is subject to a number of risks and uncertainties. As a
result of those risks and uncertainties, the Company's stock and note prices may
fluctuate dramatically. These risks and uncertainties include, but are not
limited to, the following: increases in interest rates or decreases in mortgage
availability, and the cost and use of rate locks and buy-downs; the cost of
materials used to develop communities and construct homes; shortages in the
availability and cost of subcontract labor; legislation related to tariffs;
cancellation rates; supply chain and labor constraints; the ability of our
potential buyers to sell their existing homes; the adverse effect of slow
absorption rates; our ability to acquire and develop lots may be negatively
impacted if we are unable to obtain performance and surety bonds; impairments of
our real estate inventory; competition; home warranty and construction defect
claims; failures in health and safety performance; fluctuations in quarterly
operating results; our level of indebtedness; our exposure to counterparty risk
with respect to our capped calls; our ability to obtain financing if our credit
ratings are downgraded; our exposure to and impacts from natural disasters or
severe weather conditions; the availability and cost of finished lots and
undeveloped land; the success of our strategy to offer and market entry-level
and first move-up homes; a change to the feasibility of projects under option or
contract that could result in the write-down or write-off of earnest money or
option deposits; our limited geographic diversification; sustainability matters
and disclosures; our exposure to information technology failures and security
breaches and the impact thereof; the loss of key personnel; changes in tax laws
that adversely impact us or our homebuyers; our inability to prevail on
contested tax positions; failure of our employees and representatives to comply
with laws and regulations; our compliance with government regulations;
liabilities or restrictions resulting from regulations applicable to our
financial services operations; negative publicity that affects our reputation;
potential disruptions to our business by an epidemic or pandemic, and measures
that federal, state and local
                                       14                                       
governments and/or health authorities implement to address it; and other factors
identified in documents filed by the Company with the Securities and Exchange
Commission, including those set forth in our Form 10-K for the year ended
December 31, 2025 and our subsequent Form 10-Qs under the caption "Risk
Factors," which can be found on our website at
https://investors.meritagehomes.com.
                                       15                                       

Sources

The 8-K item 2.02 filings (SEC EDGAR) and their EX-99 exhibits: the results release and, when filed, prepared remarks or the call transcript.

Also

Said vs did: the targets in these releases against what was then reported. Filings: every filing.

Work with it

Excel workbook · CSV. Google Sheet that stays up to date: paste =IMPORTDATA("https://tickdelta.com/company/MTH/export.csv") into a cell.

Next:Presentations
Esc

Type a ticker such as AAPL, a name, an investor such as Buffett, or a topic such as tariffs. ↑ ↓ to move, Enter to open.