Nasdaq, Inc. NDAQ
The Nasdaq Stock Market Operating company IPOs 155 SPAC IPOs 126 Switches from the New York Stock Exchange 20 LLC, or NYSE, and the NYSE American LLC, or NYSE American Upgrades from OTC 31 ETPs and Other Listings 452 Total 784 10-K, Item 1
- Headquarters
- New York, NY
- CEO
- Adena T. Friedman
- Next results
- around Jan 28, 2027
Where each dollar of revenue went, FY2025
Revenue of $8.3B through the costs to a net profit of $1.8B · income statement of the 10-K
NDAQ among Financials peers
Six ratios from the latest 10-K. Each corner is the share of 75 peers the company is above, not a score.
What changed
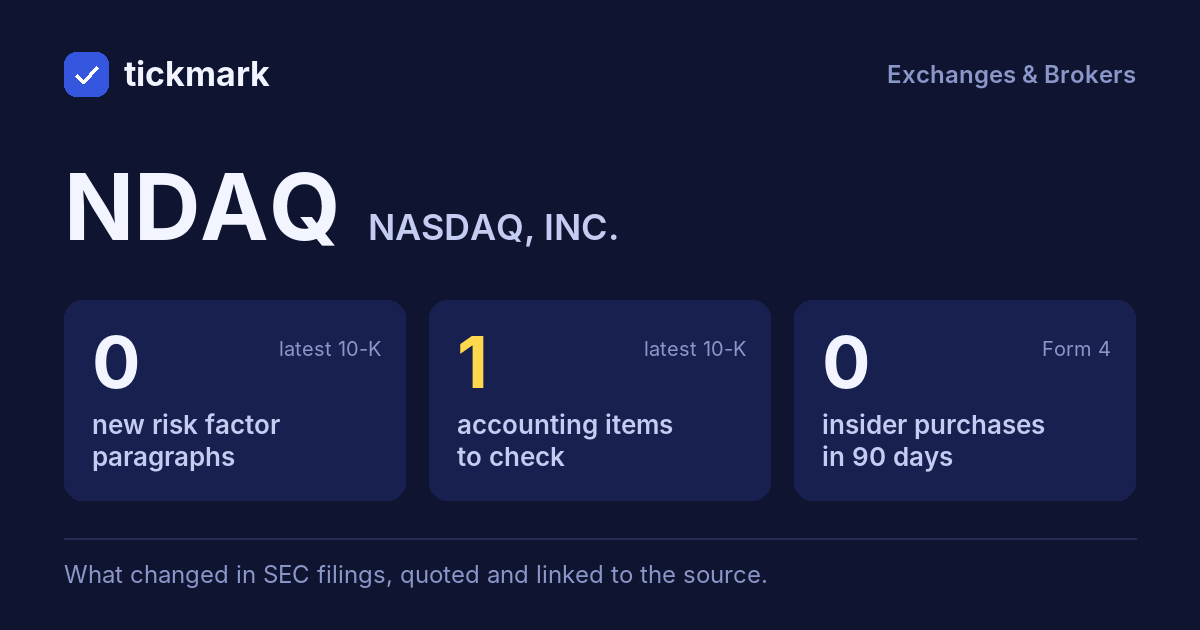
1 accounting fact worth reading about.
Each row opens the detail with the quote and the filing. A row is a change worth reading, not a verdict.
Accounting checks
9 checks on the latest 10-K. Checks, not verdicts.
1fact worth reading about the other 8 checks found nothing to note
-
Critical audit matters changedNew this year: Calypso and AxiomSL on-premises license; Description As described in Notes 2 and 3 to the; Matter Company recognizes revenue within its; Regulatory Technology and Capital Markets; Technology products for AxiomSL and; Post-contract customer support is recognized; Auditing the Company’s identification of; Calypso on-premises license agreements; F-3; How We We obtained an understanding, performed a; Addressed walkthrough of the process and evaluated the; Audit identifying performance obligations and; To test the Company’s judgments and; AxiomSL and Calypso service offerings and. No longer listed: Calypso and AxiomSL on-premises license revenue recognition; F-2
-
Receivables -7.7% vs revenue +11.6% (-19.4 pts)
7 more checks with nothing to note
-
Same auditor in both 10-Ks: Ernst & Young LLP
-
No statement of substantial doubt about going concern
-
No 8-K item 4.02 in the last 2 years
-
No NT 10-K or NT 10-Q in the last 2 years
-
No sentence in the 10-K concludes that controls were not effective because of a material weakness
-
No 8-K item 2.06 in the last 2 years
-
No 8-K item 1.03 in the last 2 years
In their words
No new paragraphs in Risk Factors
No new paragraphs in Risk Factors, or fewer than two 10-Ks to compare.
Financial performance
Last 4 fiscal years · 10-K XBRL
| Metric | FY2022 | FY2023 | FY2024 | FY2025 |
|---|---|---|---|---|
| Revenue | $6.2B | $6.1B | $7.4B | $8.3B |
| Net income | $1.1B | $1.1B | $1.1B | $1.8B |
| Operating cash flow | $1.7B | $1.7B | $1.9B | $2.3B |
| Free cash flow | $1.6B | $1.5B | $1.7B | $2.0B |
Revenue, FY2016 to FY2025
Ten fiscal years, each from its own 10-K · XBRL · USD
$8.3B ▲ 11.6% in FY2025$1.8B ▲ 60.1% in FY2025$2.0B ▲ 14.8% in FY2025
Recent filings
3 filings in the last 30 days · SEC EDGAR
-
8-KOct 26, 2026Director or officer change 8-K item 5.02
-
8-KOct 22, 2026Quarterly results, Regulation FD disclosure, Other events 8-K items 2.02, 7.01, 8.01
-
10-QOct 22, 2026Quarterly report (10-Q) period ended Sep 30, 2026
About the company
Nasdaq, Inc., New York, NY · from the 10-K filed Feb 12, 2026
The Nasdaq Stock Market Operating company IPOs 155 SPAC IPOs 126 Switches from the New York Stock Exchange 20 LLC, or NYSE, and the NYSE American LLC, or NYSE American Upgrades from OTC 31 ETPs and Other Listings 452 Total 784
- Headquarters
- New York, NY
- Country
- United States
- Reports in
- USD
- Listed on
- Nasdaq
- Fiscal year ends
- December 31
- Last results
- Oct 22, 2026
- Incorporated in
- DE
Email alerts
Sources
Numbers from the XBRL of the 10-Ks; filings from SEC EDGAR.
Work with it: Excel workbook · CSV. Google Sheet that stays up to date: paste =IMPORTDATA("https://tickdelta.com/company/NDAQ/export.csv") into a cell.