NEENextEra Energy
NEE is one of the largest electric power and energy infrastructure companies in North America. 10-K, Item 1
- Headquarters
- Juno Beach, FL
- Next results
- around Jan 1, 2027
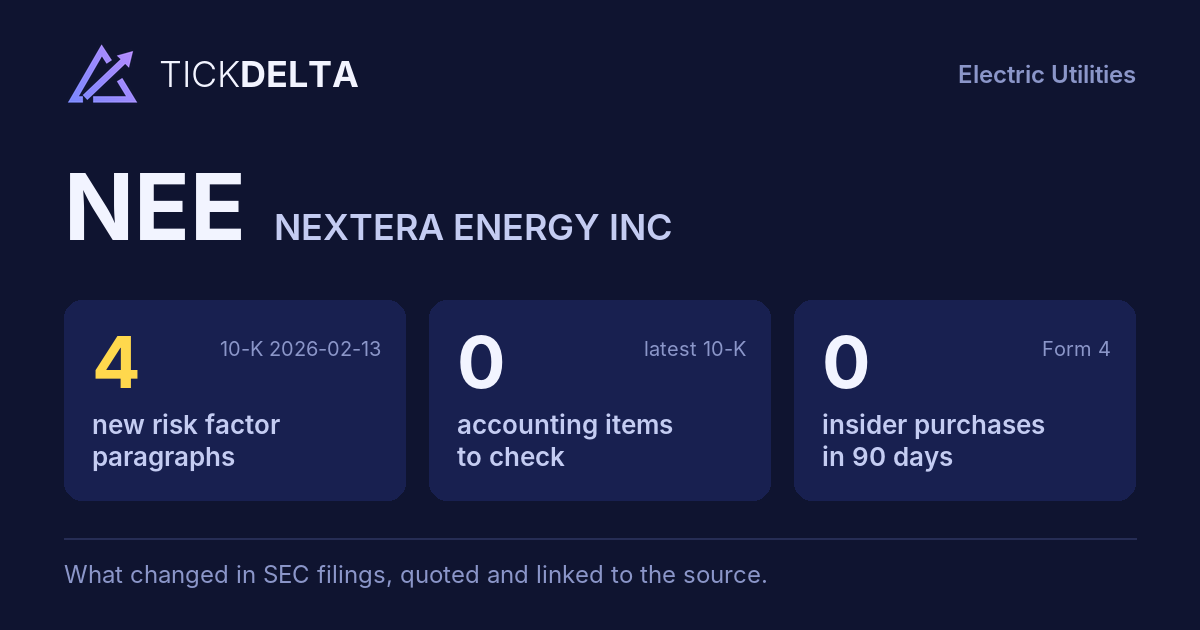
The biggest changes in the 10-K filed 2026-02-13, this fiscal year against the last, and the sentences in the MD&A (Item 7) where management explains them, quoted word for word. Tickdelta picks sentences that name the line, a direction and a cause. It does not write explanations of its own.
Revenue
+9.8% FY to 2025-12-31 vs 2024-12-31“During 2025, operating revenues increased $1,243 million primarily due to higher storm cost recovery, retail base and storm protection plan cost recovery revenues, partly offset by lower fuel cost recovery revenues.”
Read it in the 10-K ↗
“Retail base revenues increased approximately $222 million during the year ended December 31, 2025 primarily related to an increase of 1.7% in the average number of customer accounts and new retail base rates through its Solar Base Rate Adjustment mechanism under the 2021 rate agreement.”
Read it in the 10-K ↗
Cash from operations
-5.8% FY to 2025-12-31 vs 2024-12-31“During 2025, the change from a net over-recovery of cost recovery clauses to a net under-recovery of cost recovery clauses impacted FPL's operating cash flows by approximately $89 million, primarily related to higher fuel prices.”
Read it in the 10-K ↗
Operating margin
31.8% → 32.1% (+0.3 pts) FY to 2025-12-31 vs 2024-12-31“Operating expenses – net for 2025 increased $613 million primarily due to increases of $221 million in O&M expenses, $161 million in depreciation and amortization expenses and $152 million in fuel, purchased power and interchange expenses.”
Read it in the 10-K ↗
Net income
-1.6% FY to 2025-12-31 vs 2024-12-31“Net income attributable to NEE for 2025 was lower than 2024 by $111 million, or $0.07 per share, assuming dilution, due to lower results at Corporate and Other, partly offset by higher results at FPL and NEER.”
Read it in the 10-K ↗
“FPL's net income increased in 2025 primarily driven by continued investments in plant in service and other property and a higher earned regulatory ROE in 2025.”
Read it in the 10-K ↗
Changes are computed from the XBRL figures in the same 10-K. Hover a number to see the line item. Open the 10-K ↗
Work on NEE in a spreadsheet:
Excel workbook (a sheet per section, ten years by column, charts, links to the filings) ·
CSV.
For a Google Sheet that stays up to date, paste =IMPORTDATA("https://tickdelta.com/company/NEE/export.csv") into a cell.