Paragraph 44 · 42% changed
Every version of it
Screener
/
SEC EDGAR
/CIK 0001030469
/10-K filed Feb 25, 2026, compared with Feb 27, 2025
/Numbers from the XBRL of the 10-Ks
The 10-K against last year's
160 changes: 27 added, 18 removed, 115 reworded
10-K Feb 25, 2026 vs Feb 27, 2025
Risk Factors
12.7%
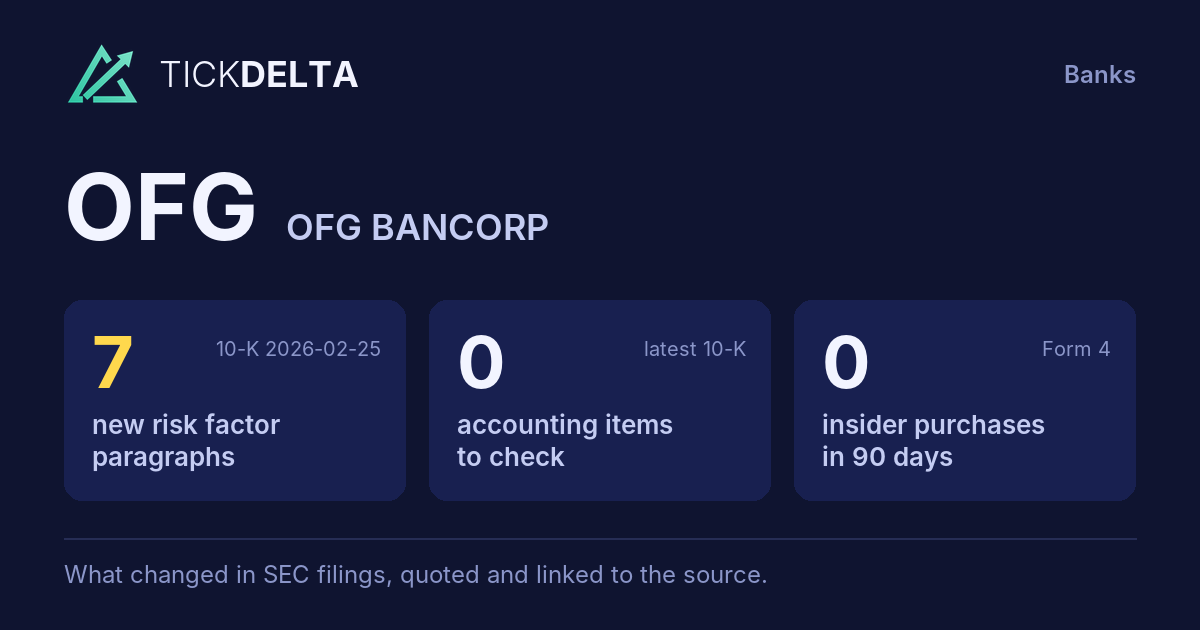
of the text changed · 7,337 words now · 7 new paragraphs, 0 gone
MD&A
30.2%
of the text changed · 10,600 words now · 20 new paragraphs, 18 gone
Legal Proceedings
2.0%
of the text changed · 1,162 words now
Accounting Policies
16.5%
of the text changed · 10,573 words now
10-K 0001030469-26-000008 (Feb 25, 2026) vs 10-K 0001030469-25-000007 (Feb 27, 2025)
Every paragraph, and how much of it changed
One bar per paragraph, in the order of the 10-K. Height and colour show the share of its words not in the closest paragraph a year earlier; the tallest bars are new paragraphs.
Risk Factors
89 paragraphs · 7 new · 20 reworded · 0 gone · 10-K Feb 25, 2026 against Feb 27, 2025
New paragraph
Reworded (5% of its words or more)
Same or nearly
Paragraph 55 · 38% changed
Every version of it
Paragraph 4 · 38% changed
Every version of it
In the past, Puerto Rico has experienced significant economic contraction that persisted over a decade, a government fiscal crisis that led to the appointment of a federal oversight board in 2016 and a bankruptcy-type restructuring process of the government’s finances. While Puerto Rico’s economy has been gradually recovering, it still faces economic and fiscal challenges and could face additional economic or fiscal challenges in the future. Deterioration in local economic conditions or in the financial condition of an industry on which the local market depends could adversely affect factors such as unemployment rates and real estate vacancy and values. This could result in, among other things, a reduction of creditworthy borrowers seeking loans, an increase in loan delinquencies, defaults and foreclosures, an increase in classified and non-accrual loans, a decrease in the value of collateral for loans, and a decrease in core deposits. Any of these factors could materially impact our business. In addition, there is no assurance that the Puerto Rico government will be able to satisfy its obligations as restructured.
Paragraph 34 · 32% changed
Every version of it
Paragraph 70 · 30% changed
Every version of it
The financial services industry is continually undergoing rapid technological change with frequent introductions of new technology-driven products and services, such as including artificial intelligence (“AI”) technologies. The effective use of technology increases efficiency and enables financial institutions to better serve clients and to reduce costs. OFG’s Our future success depends, in part, upon its our ability to address client needs by using technology to provide products and services that will satisfy client demands, as well as to create additional efficiencies in OFG’s our operations. OFG We may not be able to effectively implement new technology-driven products and services services, including AI-based solutions, or be successful in marketing these products and services to its our clients. The rapid evolution of AI technologies presents risks from competitors that more effectively leverage AI capabilities and thus may gain significant advantages in operational efficiency, customer service, risk management, and product development. Additionally, the integration of AI into our operations may require substantial investment in technology infrastructure, talent acquisition, and ongoing training, and there can be no assurance that such investments will yield the anticipated benefits. Regulatory frameworks governing AI in financial services are also evolving, and future regulations may impose compliance burdens or restrict certain AI applications, which could limit our ability to fully realize the potential benefits of these technologies. Failure to successfully keep pace with technological change affecting the financial services industry could negatively affect OFG’s our growth, revenue, and profit.
Paragraph 64 · 30% changed
Every version of it
Paragraph 72 · 26% changed
Every version of it
We face substantial competition in originating loans and in loans, attracting deposits and growing assets to manage. under management. The competition in originating loans and attracting assets comes principally from other Puerto Rico, U.S., and foreign banks, investment advisors, securities broker-dealers, mortgage banking companies, consumer finance companies, credit unions, insurance companies, fintech companies and other institutional lenders and purchasers of loans. We will encounter greater competition as As we expand seek to grow our operations. Increased competition may require us to increase the rates paid on deposits or lower the rates charged on loans, which could adversely affect our profitability.
Paragraph 63 · 26% changed
Every version of it
We expect to have continued access to credit from the foregoing sources of funds. However, there can be no assurance that such financing sources will continue to be available or will be available on favorable terms. In a period of financial disruption, or if negative developments occur with respect to us, the availability and cost of funding sources could be adversely affected. In that event, our cost of funds may increase, thereby reducing the net interest income, or we may need to dispose of a portion of the investment portfolio, which, depending upon market conditions, could result in realizing a loss or experiencing other adverse accounting consequences upon such dispositions. The interest rates that we pay on our investment securities are also influenced by, among other things, applicable credit ratings from recognized rating agencies. A downgrade to any of these credit ratings could affect our ability to access the capital markets, increase our borrowing costs and have a negative impact on our results of operations. Our efforts to monitor and manage liquidity risk may not be successful to deal with dramatic or unanticipated changes in the global securities markets or other reductions in liquidity driven by us or market-related events. In
Paragraph 44 · 42% changed
Every version of it
10-K Feb 27, 2025Cybersecurity incidents may include unauthorized access to our digital systems for purposes of misappropriation of assets, gaining access to sensitive information, corrupting data, or causing operational disruption. Although our information technology structure continues to be subject to cyber-attacks, we have not, to our knowledge, experience a breach of cyber-security. Such an event could compromise our confidential information, as well as that of our customers and third parties with whom we interact with and may result in negative consequences.
10-K Feb 25, 2026
security. Such an event could compromise our confidential information, as well as that of our customers and third parties with whom we interact with and may result in negative consequences.
Paragraph 55 · 38% changed
Every version of it
10-K Feb 27, 2025finance our digitalization initiatives, fund planned capital distributions and meet regulatory requirements. We rely primarily on core deposits as a low cost and stable source of funding for our lending activities and the operation of our business. Therefore, our funding costs are largely dependent on our ability to maintain and grow our core deposits. As we face substantial competition in attracting and retaining deposits, we have increased our cost of funds by increasing the rates we pay to our depositors to avoid losing deposits. We may also need to rely on more expensive sources of funding if deposits decrease. Furthermore, we have a significant amount of collateralized deposits from the Puerto Rico government, its instrumentalities and municipalities ($1.445 billion, or approximately 15.0% of our total deposits, as of December 31, 2024), of which a $1.2 billion consist of a deposit that will reprice in May 15, 2025, and the amount of these deposits may fluctuate depending on the financial condition and liquidity of these entities, as well as on our ability to maintain these customer relationships. No assurance can be given that any such deposit will be available in the future. If we are unable to maintain or grow our deposits for any reason, we may be subject to paying higher funding costs and our net interest income may decrease.
10-K Feb 25, 2026
2026 and the remaining $638 million will reprice on May 15, 2026. The amount of these deposits may fluctuate depending on the financial condition and liquidity of these entities, as well as on our ability to maintain these customer relationships. No assurance can be given that any such deposit will be available in the future. If we are unable to maintain or grow our deposits for any reason, we may be subject to paying higher funding costs and our net interest income may decrease.
Paragraph 4 · 38% changed
Every version of it
10-K Feb 27, 2025
In the past, Puerto Rico has experienced significant economic contraction that persisted over a decade, a government fiscal crisis that led to the appointment of a federal oversight board in 2016 and a bankruptcy-type restructuring process of the government’s finances. While Puerto Rico’s economy has been gradually recovering, it still faces economic and fiscal challenges and could face additional economic or fiscal challenges in the future. Deterioration in local economic conditions or in the financial condition of an industry on which the local market depends could adversely affect factors such as unemployment rates and real estate vacancy and values. This could result in, among other things, a reduction of creditworthy borrowers seeking loans, an increase in loan delinquencies, defaults and foreclosures, an increase in classified and non-accrual loans, a decrease in the value of collateral for loans, and a decrease in core deposits. Any of these factors could materially impact our business. In addition, there is no assurance that the Puerto Rico government will be able to satisfy its obligations as restructured.
10-K Feb 25, 2026
In the past, Puerto Rico has experienced significant economic contraction that persisted over a decade, a government fiscal crisis that led to the appointment of a federal oversight board in 2016 and a bankruptcy-type restructuring process of the government’s finances. While Puerto Rico’s economy has been gradually recovering, it still faces economic and fiscal challenges and could face additional economic or fiscal challenges in the future. Deterioration in local economic conditions or
Paragraph 34 · 32% changed
Every version of it
10-K Feb 27, 2025In the past, the decline in Puerto Rico’s economy had an adverse effect in the credit quality of our mortgage and commercial real estate loan portfolios. Among other things, during the local recession, we experienced an increase in the level of non-performing assets and credit loss provision, which adversely affected our profitability. Delinquency rates and non-performing assets may increase if Puerto Rico’s economy enters into a recession, or if there is a decline in economic activity, additional increases in the ACL could be necessary with further adverse effects on our profitability.
10-K Feb 25, 2026
assets may increase if Puerto Rico’s economy enters into a recession, or if there is a decline in economic activity, additional increases in the ACL could be necessary with further adverse effects on our profitability.
Paragraph 70 · 30% changed
Every version of it
10-K Feb 27, 2025
The financial services industry is continually undergoing rapid technological change with frequent introductions of new technology-driven products and services, such as artificial intelligence technologies. The effective use of technology increases efficiency and enables financial institutions to better serve clients and to reduce costs. OFG’s future success depends, in part, upon its ability to address client needs by using technology to provide products and services that will satisfy client demands, as well as to create additional efficiencies in OFG’s operations. OFG may not be able to effectively implement new technology-driven products and services or be successful in marketing these products and services to its clients. Failure to successfully keep pace with technological change affecting the financial services industry could negatively affect OFG’s growth, revenue, and profit.
10-K Feb 25, 2026
The financial services industry is continually undergoing rapid technological change with frequent introductions of new technology-driven products and services, including artificial intelligence (“AI”) technologies. The effective use of technology increases efficiency and enables financial institutions to better serve clients and reduce costs. Our future success depends, in part, upon our ability to address client needs by using technology to provide products and services that will satisfy client demands, as well as to create additional efficiencies in our operations. We may not be able to effectively implement new technology-driven products and services, including AI-based solutions, or be successful in marketing these products and services to our clients. The rapid evolution of AI technologies presents risks from competitors that more effectively leverage AI capabilities and thus may gain significant advantages in operational efficiency, customer service, risk management, and product development. Additionally, the integration of AI into our operations may require substantial investment in technology infrastructure, talent acquisition, and ongoing training, and there can be no assurance that such investments will yield the anticipated benefits. Regulatory frameworks governing AI in financial services are also evolving, and future regulations may impose compliance burdens or restrict certain AI applications, which could limit our ability to fully realize the potential benefits of these technologies. Failure to successfully keep pace with technological change affecting the financial services industry could negatively affect our growth, revenue, and profit.
Paragraph 64 · 30% changed
Every version of it
10-K Feb 27, 2025We expect to have continued access to credit from the foregoing sources of funds. However, there can be no assurance that such financing sources will continue to be available or will be available on favorable terms. In a period of financial disruption, or if negative developments occur with respect to us, the availability and cost of funding sources could be adversely affected. In that event, our cost of funds may increase, thereby reducing the net interest income, or we may need to dispose of a portion of the investment portfolio, which, depending upon market conditions, could result in realizing a loss or experiencing other adverse accounting consequences upon such dispositions. The interest rates that we pay on our investment securities are also influenced by, among other things, applicable credit ratings from recognized rating agencies. A downgrade to any of these credit ratings could affect our ability to access the capital markets, increase our borrowing costs and have a negative impact on our results of operations. Our efforts to monitor and manage liquidity risk may not be successful to deal with dramatic or unanticipated changes in the global securities markets or other reductions in liquidity driven by us or market-related events. In
10-K Feb 25, 2026
adverse accounting consequences upon such dispositions. The interest rates that we pay on our investment securities are also influenced by, among other things, applicable credit ratings from recognized rating agencies. A downgrade to any of these credit ratings could affect our ability to access the capital markets, increase our borrowing costs and have a negative impact on our results of operations. Our efforts to monitor and manage liquidity risk may not be successful to deal with dramatic or unanticipated changes in the global securities markets or other reductions in liquidity driven by us or market-related events. In the event that such sources of funds are reduced or eliminated, and we are not able to replace them on a cost-effective basis, we may be forced to curtail or cease our loan origination business and treasury activities, which would have a material adverse effect on our operations and financial condition.
Paragraph 72 · 26% changed
Every version of it
10-K Feb 27, 2025
We face substantial competition in originating loans and in attracting deposits and assets to manage. The competition in originating loans and attracting assets comes principally from other Puerto Rico, U.S., and foreign banks, investment advisors, securities broker-dealers, mortgage banking companies, consumer finance companies, credit unions, insurance companies, and other institutional lenders and purchasers of loans. We will encounter greater competition as we expand our operations. Increased competition may require us to increase the rates paid on deposits or lower the rates charged on loans, which could adversely affect our profitability.
10-K Feb 25, 2026
We face substantial competition in originating loans, attracting deposits and growing assets under management. The competition in originating loans and attracting assets comes principally from other Puerto Rico, U.S., and foreign banks, investment advisors, securities broker-dealers, mortgage banking companies, consumer finance companies, credit unions, insurance companies, fintech companies and other institutional lenders and purchasers of loans. As we seek to grow our
Paragraph 63 · 26% changed
Every version of it
10-K Feb 27, 2025
We expect to have continued access to credit from the foregoing sources of funds. However, there can be no assurance that such financing sources will continue to be available or will be available on favorable terms. In a period of financial disruption, or if negative developments occur with respect to us, the availability and cost of funding sources could be adversely affected. In that event, our cost of funds may increase, thereby reducing the net interest income, or we may need to dispose of a portion of the investment portfolio, which, depending upon market conditions, could result in realizing a loss or experiencing other adverse accounting consequences upon such dispositions. The interest rates that we pay on our investment securities are also influenced by, among other things, applicable credit ratings from recognized rating agencies. A downgrade to any of these credit ratings could affect our ability to access the capital markets, increase our borrowing costs and have a negative impact on our results of operations. Our efforts to monitor and manage liquidity risk may not be successful to deal with dramatic or unanticipated changes in the global securities markets or other reductions in liquidity driven by us or market-related events. In
10-K Feb 25, 2026
We expect to have continued access to credit from the foregoing sources of funds. However, there can be no assurance that such financing sources will continue to be available or will be available on favorable terms. In a period of financial disruption, or if negative developments occur with respect to us, the availability and cost of funding sources could be adversely affected. In that event, our cost of funds may increase, thereby reducing the net interest income, or we may need to dispose of a portion of the investment portfolio, which, depending upon market conditions, could result in realizing a loss or experiencing other
MD&A
147 paragraphs · 20 new · 90 reworded · 18 gone · 10-K Feb 25, 2026 against Feb 27, 2025
New paragraph
Reworded (5% of its words or more)
Same or nearly
Paragraph 66 · 50% changed
The efficiency ratio was 52.94%, an improvement from 53.22%. The efficiency ratio measures how much of OFG’s revenues is used 53.41% compared to pay operating expenses. OFG computes its efficiency ratio by dividing non-interest expenses by the sum of its net interest income and non-interest income, but excluding gains (losses) on the sale of investment securities, other gains and losses, and other income that may be considered volatile in nature. Management believes that the exclusion of those items permits consistent comparability. 52.94%. Amounts presented as part of non-interest income that were excluded from the efficiency ratio computation for years ended December 31, 2025 and 2024 and 2023 amounted to $2.1 $1.6 million and $6.5 $2.1 million, respectively.
Paragraph 56 · 50% changed
•A $58.9 $0.5 million increase in interest income from loans driven by higher interest income from: (i) commercial loans of $28.3 million, primarily related to the upward repricing of variable rate commercial loans, increased yields on new loans originated during 2024, and higher average balance; (ii) auto loans of $29.9 million reflecting higher originations during 2024; and (iii) consumer loans of $7.3 million mortgage banking activities, mainly due to an increase higher: (i) servicing fees of $56.9 $2.6 million driven by the purchase of a servicing portfolio in the average balance August 2024, and (ii) gain on sale of this portfolio. loans and securitization of $1.4 million, which includes $676 thousand favorable market valuation for held-for-sale loans and $553 thousand higher gain on securitization and sales. These increases were partially offset by a decrease of $6.7 $4.1 million in interest income from mortgage loans due to a reduction of $135.4 million unfavorable variance in the average balance valuation of this portfolio, mainly from regular paydowns and the securitization and sale of conforming loans; and mortgage servicing rights.
Paragraph 83 · 49% changed
Cash and due from banks decreased increased by $159.1 $451.6 million to $584.5 million, $1.0 billion, reflecting the effect of loan funding higher deposits and lower deposit balances. new wholesale borrowings during 2025.
Paragraph 105 · 49% changed
Paragraph 79 · 48% changed
Paragraph 77 · 47% changed
•Increase of $10.6 $12.3 million in non-interest expenses, mainly due to: to increases of: (i) $3.4 $4.3 million increase in electronic banking charges due to increased transaction volumes, (ii) $4.9 million in professional and service fees due to a performance based advisory costs as part of the renegotiation of a cost-saving technology services contract and higher compliance-related expenses, (iii) $1.8 million as a result of higher salaries and benefits, including payroll taxes, and (iv) $2.0 million reduction in foreclosed real estate and other repossessed assets expenses, net expenses (income), net. This reduction primarily reflects a $4.0 million increase in gains from the sale of income, due to unfavorable valuation adjustments other repossessed assets driven by higher volume of units sold and improved pricing, partially offset by $1.9 million lower gain gains on sale sales of foreclosed real estate from decrease in sales volume; (ii) increase in compensation and employee benefits of $2.0 million due to higher salaries and benefits, including payroll taxes and (iii) increase in electronic banking charges lower volume of $1.5 million mainly due to debit and credit card expenses; properties sold.
Paragraph 65 · 45% changed
Paragraph 45 · 45% changed
Net interest income of $588.4 $608.5 million increased by $27.5 $20.1 million from $560.9 $588.4 million reflecting higher loans and investment securities income. This increase was partially offset by an increase in borrowings expense and the impact of one fewer day than the prior year, which reduced net interest income by $1.1 million. Tax equivalent basis net interest income of $605.2 $623.8 million increased $28.3 by $18.6 million, or 4.9%, 3.1%, from $576.9 $605.2 million.
Paragraph 66 · 50% changed
10-K Feb 27, 2025
The efficiency ratio was 52.94%, an improvement from 53.22%. The efficiency ratio measures how much of OFG’s revenues is used to pay operating expenses. OFG computes its efficiency ratio by dividing non-interest expenses by the sum of its net interest income and non-interest income, but excluding gains (losses) on the sale of investment securities, other gains and losses, and other income that may be considered volatile in nature. Management believes that the exclusion of those items permits consistent comparability. Amounts presented as part of non-interest income that were excluded from the efficiency ratio computation for years ended December 31, 2024 and 2023 amounted to $2.1 million and $6.5 million, respectively.
10-K Feb 25, 2026
The efficiency ratio was 53.41% compared to 52.94%. Amounts presented as part of non-interest income that were excluded from the efficiency ratio computation for 2025 and 2024 amounted to $1.6 million and $2.1 million, respectively.
Paragraph 56 · 50% changed
10-K Feb 27, 2025
•A $58.9 million increase in interest income from loans driven by higher interest income from: (i) commercial loans of $28.3 million, primarily related to the upward repricing of variable rate commercial loans, increased yields on new loans originated during 2024, and higher average balance; (ii) auto loans of $29.9 million reflecting higher originations during 2024; and (iii) consumer loans of $7.3 million mainly due to an increase of $56.9 million in the average balance of this portfolio. These increases were partially offset by a decrease of $6.7 million in interest income from mortgage loans due to a reduction of $135.4 million in the average balance of this portfolio, mainly from regular paydowns and the securitization and sale of conforming loans; and
10-K Feb 25, 2026
•A $0.5 million increase in mortgage banking activities, mainly due to higher: (i) servicing fees of $2.6 million driven by the purchase of a servicing portfolio in August 2024, and (ii) gain on sale of loans and securitization of $1.4 million, which includes $676 thousand favorable market valuation for held-for-sale loans and $553 thousand higher gain on securitization and sales. These increases were partially offset by a $4.1 million unfavorable variance in the valuation of mortgage servicing rights.
Paragraph 83 · 49% changed
10-K Feb 27, 2025
Cash and due from banks decreased by $159.1 million to $584.5 million, reflecting the effect of loan funding and lower deposit balances.
10-K Feb 25, 2026
Cash and due from banks increased by $451.6 million to $1.0 billion, reflecting higher deposits and new wholesale borrowings during 2025.
Paragraph 105 · 49% changed
10-K Feb 27, 2025OFG’s non-performing assets include non-performing loans, foreclosed real estate, and other repossessed assets (see Tables 13 and 15). At December 31, 2024, OFG had $78.0 million of non-accrual loans held for investment, including $2.9 million PCD loans, compared to $79.4 million at December 31, 2023, reflecting decreases of $2.3 million and $1.0 million in mortgage and commercial loan portfolios, respectively (see Table 14). As of December 31, 2023, total non-accrual loans excluded $6.4 million of past due commercial loans held-for-sale, these loans were sold in 2024. There were no past due or non-accrual commercial loans held-for-sale as of December 31, 2024.
10-K Feb 25, 2026
As of December 31, 2025, OFG had $3.1 million in non-accrual commercial US loans held-for-sale. There were no past due or non-accrual commercial loans held-for-sale as of December 31, 2024.
Paragraph 79 · 48% changed
10-K Feb 27, 2025Total Interest Expense of $41.0 million compared to $41.2 million in the third quarter of 2024 and $32.7 million in the fourth quarter of 2023. Compared to the third quarter of 2024, the fourth quarter of 2024 decreased $0.1 million, primarily reflecting slightly lower average balances and costs of core deposits and higher average balances of borrowings and brokered deposits.
10-K Feb 25, 2026
•Decrease of $4.0 million in interest expense primarily related to a decrease of 3 basis points in the average cost of core deposits.
Paragraph 77 · 47% changed
10-K Feb 27, 2025
•Increase of $10.6 million in non-interest expenses, mainly due to: (i) $3.4 million increase in foreclosed real estate and other repossessed assets expenses, net of income, due to unfavorable valuation adjustments and lower gain on sale of foreclosed real estate from decrease in sales volume; (ii) increase in compensation and employee benefits of $2.0 million due to higher salaries and benefits, including payroll taxes and (iii) increase in electronic banking charges of $1.5 million mainly due to debit and credit card expenses;
10-K Feb 25, 2026
•Increase of $12.3 million in non-interest expenses, mainly due to increases of: (i) $4.3 million in electronic banking charges due to increased transaction volumes, (ii) $4.9 million in professional and service fees due to a performance based advisory costs as part of the renegotiation of a cost-saving technology services contract and higher compliance-related expenses, (iii) $1.8 million as a result of higher salaries and benefits, including payroll taxes, and (iv) $2.0 million reduction in foreclosed real estate and other repossessed assets expenses (income), net. This reduction primarily reflects a $4.0 million increase in gains from the sale of other repossessed assets driven by higher volume of units sold and improved pricing, partially offset by $1.9 million lower gains on sales of foreclosed real estate due to lower volume of properties sold.
Paragraph 65 · 45% changed
10-K Feb 27, 2025•Increase in foreclosed real estate and other repossessed assets expenses, net of income, of $3.4 million primarily reflecting $2.6 million in lower gain on sale of foreclosed real estate due to lower volume of properties sold and $1.4 million unfavorable valuation adjustments;
10-K Feb 25, 2026
The increase in non-interest expense was partially offset by a $2.0 million reduction in foreclosed real estate and other repossessed assets expenses (income), net. This reduction primarily reflects a $4.0 million increase in gains from the sale of other repossessed assets driven by higher volume of units sold and improved pricing, partially offset by $1.9 million lower gains on sales of foreclosed real estate due to lower volume of properties sold.
Paragraph 45 · 45% changed
10-K Feb 27, 2025
Net interest income of $588.4 million increased by $27.5 million from $560.9 million. Tax equivalent basis net interest income of $605.2 million increased $28.3 million, or 4.9%, from $576.9 million.
10-K Feb 25, 2026
Net interest income of $608.5 million increased by $20.1 million from $588.4 million reflecting higher loans and investment securities income. This increase was partially offset by an increase in borrowings expense and the impact of one fewer day than the prior year, which reduced net interest income by $1.1 million. Tax equivalent basis net interest income of $623.8 million increased by $18.6 million, or 3.1%, from $605.2 million.
A paragraph is matched with the one last year that shares the most of its words; under half in common makes it new. The paragraphs shown are the 8 reworded the most in each section.
The paragraph that changed most in each section
The redline
Marked against last year's 10-K: cut words struck through, new words highlighted.
MD&A243 words changed in this paragraph; it is 33% similar to last year's version.
Source: Item 7, 10-K 0001030469-26-000008 vs Item 7, 10-K 0001030469-25-000007
Accounting Policies160 words changed in this paragraph; it is 36% similar to last year's version.
Source: Item 8, Note 1 – SUMMARY OF SIGNIFICANT ACCOUNTING POLICIES, 10-K 0001030469-26-000008 vs Item 8, Note 1 – SUMMARY OF SIGNIFICANT ACCOUNTING POLICIES, 10-K 0001030469-25-000007
Risk Factors124 words changed in this paragraph; it is 65% similar to last year's version.
The financial services industry is continually undergoing rapid technological change with frequent introductions of new technology-driven products and services, such as including artificial intelligence (“AI”) technologies. The effective use of technology increases efficiency and enables financial institutions to better serve clients and to reduce costs. OFG’s Our future success depends, in part, upon its our ability to address client needs by using technology to provide products and services that will satisfy client demands, as well as to create additional efficiencies in OFG’s our operations. OFG We may not be able to effectively implement new technology-driven products and services services, including AI-based solutions, or be successful in marketing these products and services to its our clients. The rapid evolution of AI technologies presents risks from competitors that more effectively leverage AI capabilities and thus may gain significant advantages in operational efficiency, customer service, risk management, and product development. Additionally, the integration of AI into our operations may require substantial investment in technology infrastructure, talent acquisition, and ongoing training, and there can be no assurance that such investments will yield the anticipated benefits. Regulatory frameworks governing AI in financial services are also evolving, and future regulations may impose compliance burdens or restrict certain AI applications, which could limit our ability to fully realize the potential benefits of these technologies. Failure to successfully keep pace with technological change affecting the financial services industry could negatively affect OFG’s our growth, revenue, and profit.
Source: Item 1A, 10-K 0001030469-26-000008 vs Item 1A, 10-K 0001030469-25-000007
Legal Proceedings18 words changed in this paragraph; it is 90% similar to last year's version.
At December 31, 2024 2025 and 2023, 2024, OFG maintained other non-credit commitments amounting to $14.6 $17.8 million and $18.9 $14.6 million, respectively, primarily for the acquisition of equity securities. In addition, as we continue OFG continues to transform OFG with a focus on simplification and building a culture of excellence and customer service, we continue OFG continues to invest in technology that drive our drives its strategy, namely digital, data analytics, cloud migration, cyber security, and our sales and service capabilities. At December 31, 2024 2025 and 2023, 2024, OFG had commitments for capital expenditures in technology amounting to $1.6 million and $953 thousand and $7.8 million, thousand, respectively.
Source: Item 3, via Note 24 – COMMITMENTS AND CONTINGENCIES, 10-K 0001030469-26-000008 vs Item 3, via Note 24 – COMMITMENTS AND CONTINGENCIES, 10-K 0001030469-25-000007
Sentences and paragraphs added, removed or reworded
Every change, by type
Sentences and paragraphs of OFG's Risk Factors and MD&A, 10-K Feb 25, 2026 against 10-K Feb 27, 2025. Each links to the text at sec.gov.
Quiet changes are sentences kept from last year with one to four words changed, at least one of them a hedge, a modal or a qualifier (may, could, will, not, significant, material…). A year or date rolling forward is not counted.
The full word list
adverse, adversely, all, although, anticipate, anticipates, any, approximately, believe, believes, can, cannot, certain, could, expect, expects, generally, however, if, intend, intends, largely, likely, many, material, materially, may, might, most, must, never, no, not, possible, primarily, probable, should, significant, significantly, some, substantial, substantially, unlikely, will, would
AddedRisk Factors
Adverse developments in federal trade policy and the phasing-out of federal emergency and stimulus funds may impact our business and stock price.
Read it in 10-K Feb 25, 2026 at sec.gov
AddedRisk Factors
Recent shifts in trade policy may have a significant negative impact on the local, U.S. and global economies, including supply chain disruption and price inflation. Periods of increased global economic and geopolitical uncertainties caused by changes in U.S. trade policy have resulted in considerable volatility in the trading markets and may increase the risk of a recession. In addition, proposed significant reductions in federal spending, including cuts to programs and funding streams, could impact the federal emergency and stimulus funds that are vital to Puerto Rico’s economy. Many of Puerto Rico’s government programs and services are supported by these funds and their phase-out could adversely impact Puerto Rico’s economy. As a financial institution with its main operations in Puerto Rico, we are exposed to the potential negative effects of the phase-out of these federal funds and the uncertainty it creates in the local economy These uncertainties may also lead to heightened credit risks,
Read it in 10-K Feb 25, 2026 at sec.gov
AddedRisk Factors
reduced economic activity, and limited growth opportunities, thereby potentially adversely impacting our financial performance. Furthermore, these developments have adversely impacted, and could continue to adversely impact, the market price of our common stock.
Read it in 10-K Feb 25, 2026 at sec.gov
AddedRisk Factors
business and operations, we expect to encounter greater competition from both traditional financial institutions and non-bank competitors. Increased competition may require us to increase the rates paid on deposits or lower the rates charged on loans, which could adversely affect our profitability. In addition, technological advancements and the emergence of digital banking platforms have lowered barriers to entry, enabling new market participants to compete for our customers. Our failure to effectively compete for customers could result in a loss of market share and have a material adverse effect on our business, financial condition, or results of operations.
Read it in 10-K Feb 25, 2026 at sec.gov
AddedRisk Factors
Our adoption of artificial intelligence technologies exposes us to evolving legal, regulatory, and operational risks.
Read it in 10-K Feb 25, 2026 at sec.gov
AddedRisk Factors
We have adopted AI technologies for certain aspects of our operations, mainly customer service channels and data analytics, and may further incorporate AI capabilities in the future. We do not build or maintain proprietary AI systems. Instead, we utilize AI solutions provided by third-party technology vendors. Our reliance on these external AI platforms extends to tools that support real-time business analytics and improve operational decision-making. We also face indirect exposure to AI-related risks through vendors, business partners, and customers who may employ AI technologies in ways that affect our operations or services.
Read it in 10-K Feb 25, 2026 at sec.gov
AddedRisk Factors
The rapidly evolving nature of AI regulation and technology creates significant uncertainty for our business. Federal and state lawmakers are actively developing new rules governing AI deployment, while existing regulatory frameworks—including consumer protection laws enforced by the CFPB, data privacy requirements under the Gramm-Leach-Bliley Act, and fair lending statutes—are being interpreted and applied to AI use cases in ways that remain unsettled. As a financial institution with more than $10 billion in assets, we face heightened regulatory scrutiny of our consumer-facing technologies, including AI applications. Our dependence on third-party AI vendors means that provider failures, service disruptions, or contract terminations could impair certain business functions with limited ability to quickly pivot to alternative solutions. Additionally, cybercriminals are increasingly using AI to conduct more sophisticated attacks against financial institutions. Failure to promptly adapt to and effectively implement security measures in response to rapidly evolving technological threats could significantly heighten our risks of data breaches, financial fraud, operational disruptions, regulatory scrutiny, reputational harm, and financial losses.
Read it in 10-K Feb 25, 2026 at sec.gov
RewordedRisk Factors
Furthermore, we have a significant amount of collateralized deposits from the Puerto Rico government, its instrumentalities and municipalities ($1.445 ($1.676 billion, or approximately 15.0% 16.3% of our total deposits, as of December 31, 2024), 2025), of which a $1.2 $1.1 billion consist of a deposit that will reprice had $500 million moved to our wealth management business as an advisory account in May 15, 2025, and the amount of these deposits may fluctuate depending on the financial condition and liquidity of these entities, as well as on our ability to maintain these customer relationships. January
Read it in 10-K Feb 25, 2026 at sec.gov
Show the other 47
RewordedRisk Factors
RewordedRisk Factors
RewordedRisk Factors
RewordedRisk Factors
RewordedRisk Factors
We face substantial competition in originating loans and in loans, attracting deposits and growing assets to manage. under management.
Read it in 10-K Feb 25, 2026 at sec.gov
RewordedRisk Factors
In an effort to address inflation, the Federal Open Market Committee of the Board of Governors of the Federal Reserve System (“FRB”) Board tightened monetary policy back in 2022 and 2023.
Read it in 10-K Feb 25, 2026 at sec.gov
RewordedRisk Factors
RewordedRisk Factors
Failure to keep pace with technological change change, including developments in artificial intelligence, could adversely affect OFG’s results of operations and financial condition.
Read it in 10-K Feb 25, 2026 at sec.gov
RewordedRisk Factors
Climate change presents multi-faceted risks, including: operational risk from the physical effects of climate events on OFG us and its our clients’ facilities and other assets; credit risk from borrowers with significant exposure to climate risk; transition risks associated with the transition to a less carbon-dependent economy; and reputational risk from stakeholder concerns about our practices related to climate change, OFG’s our carbon footprint, and its business relationships with clients who operate in carbon-intensive industries.
Read it in 10-K Feb 25, 2026 at sec.gov
RewordedRisk Factors
In that event, our cost of funds may increase, thereby reducing the net interest income, or we may need to dispose of a portion of the investment portfolio, which, depending upon market conditions, could result in realizing a loss or experiencing other adverse accounting consequences upon such dispositions.
Read it in 10-K Feb 25, 2026 at sec.gov
RewordedRisk Factors
AddedMD&A
Puerto Rico’s economy has continued to show stable performance, supported by favorable labor market conditions and adequate system liquidity. According to the Puerto Rico Department of Economic Development and Commerce, the Puerto Rico Economic Activity Index stood at 128.1 points in November 2025, representing a 0.8% increase compared to November 2024 and a consistent upward month-to-month trend in recent periods. Employment data published by such government agency
Read it in 10-K Feb 25, 2026 at sec.gov
AddedMD&A
indicates continued gains across multiple industries. As of November 2025, total non-farm payroll employment averaged approximately 963,400 jobs, reflecting a 0.2% increase from the prior month and a 0.9% increase year over year. Economic activity has benefited from public sector reconstruction funding, private investment, and on-shoring initiatives. However, OFG continues to monitor global economic conditions, related uncertainties and their possible impact on Puerto Rico's economy, which could influence OFG's business and operational results.
Read it in 10-K Feb 25, 2026 at sec.gov
AddedMD&A
The quarter ended December 31, 2025 earnings per share increased 16.4% year-over-year on a 1.9% growth in total core revenues in total core revenues, driven by disciplined core operations and a favorable tax benefit. For 2025, earnings per share grew 8.3% on a 2.8% increase in total core revenues, reflecting continued operating momentum and solid underlying performance.
Read it in 10-K Feb 25, 2026 at sec.gov
AddedMD&A
Asset quality and credit metrics remained sound and well-controlled throughout the year. OFG repurchased $40.1 million of common shares during the fourth quarter of 2025 and $91.6 million for the year, reinforcing our commitment to disciplined capital deployment and shareholder returns.
Read it in 10-K Feb 25, 2026 at sec.gov
AddedMD&A
During the quarter and year ended December 31, 2025, in line with our strategies, we saw increased commercial loans and broad acceptance of our flagship mass-market Libre and mass affluent Elite deposit accounts. By December 31, 2025, we grew our client base 4.26% from December 31, 2024 and our Digital First strategy continued to solidify our leadership in banking innovation in Puerto Rico.
Read it in 10-K Feb 25, 2026 at sec.gov
AddedMD&A
The island’s economy also continued to perform well, supported by infrastructure investments with federal and private funds and new multi-million dollar on-shoring projects, reinforcing Puerto Rico’s position as a global hub for medical devices and pharmaceutical manufacturing. These developments underpin our confidence in sustained economic activity and long-term growth across our core businesses.
Read it in 10-K Feb 25, 2026 at sec.gov
AddedMD&A
Other Income reflected a loss of $1.1 million compared to a profit of $2.2 million in the third quarter of 2025 and $0.8 million in the fourth quarter of 2024. The fourth quarter of 2025 included $6.1 million accelerated amortization of technology related assets and gains of $3.9 million on the sale of non-performing loans and $1.1 million on the sale of a building. The third quarter of 2025, included $2.2 million in gains from OFG Ventures investments in fintech focused funds.
Read it in 10-K Feb 25, 2026 at sec.gov
AddedMD&A
Total Non-Interest Expense of $105.0 million compared to $96.5 million in the third quarter of 2025 and $99.7 million in the fourth quarter of 2024. Total non-interest expense in the fourth quarter of 2025 included expenses of $3.3 million in professional service fees related to performance-based advisory costs as part of the renegotiation of a cost-saving technology services contract, $2.5 million for business rightsizing, and $1.0 million related to the previously mentioned accelerated amortization of technology related assets. Compared to the third quarter of 2025, costs for additional accumulation for performance bonuses, expanded marketing activities, and the sale of foreclosed assets increased $1.7 million.
Read it in 10-K Feb 25, 2026 at sec.gov
AddedMD&A
Income Tax was a benefit of $8.5 million compared to an expense of $9.5 million in the third quarter of 2025 and $2.4 million in the fourth quarter of 2024. The fourth quarter of 2025 benefited from $16.8 million in discrete tax benefits, including $12.9 million from the expiration of a tax agreement from the 2019 acquisition of Scotiabank’s Puerto Rico and USVI operations, and $3.9 million from a release in valuation allowance of deferred tax assets at the holding company level. Excluding discrete benefits, 2025's estimated income tax rate was 21.8%.
Read it in 10-K Feb 25, 2026 at sec.gov
AddedMD&A
Interest Average rate Average balance 2025 2024 2025 2024 2025 2024 (Dollars in thousands) Interest-bearing liabilities: Deposits: NOW Accounts 61,263 78,362 1.91% 2.31% 3,206,076 3,399,476 Savings accounts 22,864 18,843 1.05% 0.93% 2,172,288 2,027,746 Time deposits 56,214 46,482 3.07% 2.93% 1,828,809 1,585,427 Total core deposits 140,341 143,687 1.95% 2.04% 7,207,173 7,012,649 Brokered deposits 8,633 2,065 4.12% 4.63% 209,487 44,555 148,974 145,752 2.01% 2.07% 7,416,660 7,057,204 Non-interest bearing deposits — — —% —% 2,583,225 2,556,518 Fair value premium and core deposit intangible amortizations 3,773 4,528 —% —% — — Total deposits 152,747 150,280 1.53% 1.56% 9,999,885 9,613,722 Borrowings: Securities sold under agreements to repurchase 2,767 542 4.13% 4.81% 66,941 11,270 Advances from FHLB and other borrowings 16,955 11,015 4.13% 4.56% 410,831 241,649 Total borrowings 19,722 11,557 4.13% 4.57% 477,772 252,919 Total interest-bearing liabilities 172,469 161,837 1.65% 1.64% 10,477,657 9,866,641 Net interest income / spread $ 608,467 $ 588,440 5.12% 5.29% Interest rate margin 5.27% 5.43% Excess of average interest-earning assets over average interest-bearing liabilities $ 1,065,256 $ 963,266 Average interest-earning assets to average interest-bearing liabilities ratio 110.17 % 109.76 % (1) To provide meaningful comparisons of interest income, yields, and net interest margins, we calculate interest income on a taxable-equivalent basis. This involves adjusting the interest income from tax-exempt assets to be equivalent to taxable investments. Note that this adjustment is not permitted under GAAP in the unaudited consolidated statements of operations. (2) Includes loans held for sale and excludes allowance for credit losses. Nonperforming loans are included in the respective average loan balances. Income on these nonperforming loans is generally recognized on a cost recovery basis.
Read it in 10-K Feb 25, 2026 at sec.gov
AddedMD&A
•A $0.4 million decrease in other non-interest income reflecting losses of: (i) $6.1 million accelerated amortization of technology related assets, and (ii) $279 thousand impairment on equity securities, offset by gains of: (i) $3.9 million on the sale of non-performing loans, (ii) $1.9 million gains from investments of OFG Ventures in fintech-focused funds, and (iii) $1.1 million on the sale of a building.
Read it in 10-K Feb 25, 2026 at sec.gov
AddedMD&A
•Increase of $4.8 million in professional and service fees mainly due to a $3.3 million performance-based advisory costs, as part of the cost-saving renegotiation of a technology services contract, and higher compliance-related expenses;
Read it in 10-K Feb 25, 2026 at sec.gov
RemovedMD&A
RemovedMD&A
RemovedMD&A
RemovedMD&A
RemovedMD&A
RemovedMD&A
RemovedMD&A
RemovedMD&A
RemovedMD&A
RemovedMD&A
RemovedMD&A
RemovedMD&A
RewordedMD&A
Common equity tier 1 capital ratio 13.97 % 14.26 % 14.12 % 1.0% (2.0)% Minimum common equity tier 1 capital ratio required 4.50 % 4.50 % —% Actual common equity tier 1 capital $ 1,318,633 1,256,906 1,174,205 7.0% 4.9% Minimum common equity tier 1 capital required $ 424,620 396,559 374,301 5.9% 7.1% Minimum capital conservation buffer required (2.5%) $ 235,900 220,311 207,945 5.9% 7.1% Excess over regulatory requirement $ 658,113 640,036 591,959 8.1% 2.8% Risk-weighted assets $ 9,436,010 8,812,422 8,317,802 5.9% 7.1% Tier 1 risk-based capital ratio 13.97 % 14.26 % 14.12 % 1.0% (2.0)% Minimum tier 1 risk-based capital ratio required 6.00 % 6.00 % —% Actual tier 1 risk-based capital $ 1,318,633 $ 1,256,906 $ 1,174,205 7.0% 4.9% Minimum tier 1 risk-based capital required $ 566,161 $ 528,745 $ 499,068 5.9% 7.1% Minimum capital conservation buffer required (2.5%) $ 235,900 220,311 207,945 5.9% 7.1% Excess over regulatory requirement $ 516,572 $ 507,850 $ 467,192 8.7% 1.7% Risk-weighted assets $ 9,436,010 $ 8,812,422 $ 8,317,802 5.9% 7.1% Total risk-based capital ratio 15.24 % 15.52 % 15.37 % 1.0% (1.8)% Minimum total risk-based capital ratio required 8.00 % 8.00 % —% Actual total risk-based capital $ 1,437,596 $ 1,367,692 $ 1,278,537 7.0% 5.1% Minimum total risk-based capital required $ 754,881 $ 704,994 $ 665,424 5.9% 7.1% Minimum capital conservation buffer required (2.5%) $ 235,900 220,311 207,945 5.9% 7.1% Excess over regulatory requirement $ 446,815 $ 442,387 $ 405,168 9.2% 1.0% Risk-weighted assets $ 9,436,010 $ 8,812,422 $ 8,317,802 5.9% 7.1% Leverage capital ratio 10.71 % 10.93 % 11.03 % (0.9)% (2.0)% Minimum leverage capital ratio required 4.00 % 4.00 % —% Actual tier 1 capital $ 1,318,633 $ 1,256,906 $ 1,174,205 7.0% 4.9% Minimum tier 1 capital required $ 492,568 $ 460,138 $ 425,911 8.0% 7.0% Excess over regulatory requirement $ 826,065 $ 796,768 $ 748,294 6.5% 3.7% Tangible common equity to total assets 10.40 % 10.05 % 3.5% Tangible common equity to risk-weighted assets 13.73 % 13.11 % 4.7% Total equity to total assets 11.15 % 10.91 % 10.52 % 3.7% 2.2% Total equity to risk-weighted assets 14.73 % 14.23 % 14.35 % (0.8)% 3.5% Stock data:
Read it in 10-K Feb 25, 2026 at sec.gov
RewordedMD&A
Year Ended December 31, 2025 2024 2023 Variance % (In (Dollars in thousands) Compensation and employee benefits $ 162,426 $ 159,710 $ 155,827 2.5% 1.7% Occupancy, equipment and infrastructure costs 59,781 59,123 59,235 (0.2)% 1.1% Electronic banking charges 47,077 42,816 41,336 3.6% 10.0% Information technology expenses 26,806 27,582 27,162 1.5% (2.8)% Professional and service fees 23,705 18,876 18,764 0.6% 25.6% Taxes, other than payroll and income taxes 15,774 13,949 12,968 7.6% 13.1% Insurance 11,375 11,252 10,494 7.2% Loan servicing and clearing expenses 7,935 7,774 2.1% 1.1% Advertising, business promotion, and strategic initiatives 11,416 9,714 8,743 11.1% 17.5% Loan servicing and clearing expenses 9,145 7,935 15.2% Communication 4,553 4,551 4,678 (2.7)% —% Printing, postage, stationery and supplies 4,148 3,816 3,338 14.3% 8.7% Director and investor relations 1,354 1,250 8.3% Foreclosed real estate and other repossessed assets expenses, expenses (income), net of (income) 1,026 3,012 (405) 843.7% 65.9% Other 13,354 13,451 (0.7)% 11,227 12,104 (7.2)% Total non-interest expenses $ 389,813 $ 375,690 $ 363,365 3.4% 3.8% Relevant ratios and data:
Read it in 10-K Feb 25, 2026 at sec.gov
RewordedMD&A
Common Equity Tier 1 Capital to Risk-Weighted Assets 13.44% 13.60% 13.01% 4.5% (1.2)% Actual common equity tier 1 capital $1,260,530 $1,191,547 $1,075,487 10.8% 5.8% Minimum capital requirement (4.5%) $422,175 $394,192 $371,913 6.0% 7.1% Minimum capital conservation buffer requirement (2.5%) $234,542 $218,995 $206,618 6.0% 7.1% Minimum to be well capitalized (6.5%) $609,808 $569,388 $537,208 6.0% 7.1% Tier 1 Capital to Risk-Weighted Assets 13.44% 13.60% 13.01% 4.5% (1.2)% Actual tier 1 risk-based capital $1,260,530 $1,191,547 $1,075,487 10.8% 5.8% Minimum capital requirement (6%) $562,900 $525,589 $495,884 6.0% 7.1% Minimum capital conservation buffer requirement (2.5%) $234,542 $218,995 $206,618 6.0% 7.1% Minimum to be well capitalized (8%) $750,533 $700,786 $661,179 6.0% 7.1% Total Capital to Risk-Weighted Assets 14.70% 14.86% 14.27% 4.1% (1.1)% Actual total risk-based capital $1,378,822 $1,301,684 $1,179,164 10.4% 5.9% Minimum capital requirement (8%) $750,533 $700,786 $661,179 6.0% 7.1% Minimum capital conservation buffer requirement (2.5%) $234,542 $218,995 $206,618 6.0% 7.1% Minimum to be well capitalized (10%) $938,167 $875,982 $826,474 6.0% 7.1% Total Tier 1 Capital to Average Total Assets 10.31% 10.45% 10.20% 2.5% (1.3)% Actual tier 1 capital $1,260,530 $1,191,547 $1,075,487 10.8% 5.8% Minimum capital requirement (4%) $489,159 $456,144 $421,660 8.2% 7.2% Minimum to be well capitalized (5%) $611,449 $570,179 $527,075 8.2% 7.2%
Read it in 10-K Feb 25, 2026 at sec.gov
RewordedMD&A
December 31, 2025 2024 2023 (In thousands, except share or per share information) Total stockholders’ equity $ 1,390,005 $ 1,254,371 $ 1,193,480 Goodwill (84,241) (84,241) Other intangible assets (9,855) (14,782) (20,694) Total tangible common equity (non-GAAP) $ 1,295,909 $ 1,155,348 $ 1,088,545 Total assets $ 12,465,657 11,500,734 11,344,453 Goodwill (84,241) (84,241) Core deposit intangible (7,547) (11,320) (15,848) Customer relationship intangible (2,308) (3,462) (4,846) Total tangible assets (non-GAAP) $ 12,371,561 $ 11,401,711 $ 11,239,518 Tangible common equity to tangible assets (non-GAAP) 10.47 % 10.13 % 9.68 % Common shares outstanding at end of year 43,257,167 45,440,269 47,065,156 Tangible book value per common share (non-GAAP) $ 29.96 $ 25.43 $ 23.13 Year-to-date average 2024 2023 (In thousands) Total Average stockholders’ equity $ 1,341,568 $ 1,255,872 $ 1,110,919 Average intangible assets (96,362) (101,764) (108,200) Average tangible common equity (non-GAAP) $ 1,245,206 $ 1,154,108 $ 1,002,719 Average return on tangible common equity (Non-GAAP) 16.47% 17.17% 18.14% * Averages are calculated on a year-to-date basis.
Read it in 10-K Feb 25, 2026 at sec.gov
RewordedMD&A
It also included a $5.7 million qualitative adjustment to account for uncertainty of recent increasing auto delinquency trends that the model does not fully capture, net of a $2.7 million reserve release mainly due to an improved U.S. macroeconomic perspective earlier in the year.The provision for credit losses for 2023 reflected a provision of $42.6 million related to the growth in loan balances, a provision of $13.1 million related to commercial-specific loan reserves, mainly in the US commercial loan portfolio, and $4.8 million associated with qualitative adjustments mostly to the auto loan and US commercial loan portfolios. 2024.
Read it in 10-K Feb 25, 2026 at sec.gov
RewordedMD&A
These variances were partially offset by $68.6 $92.1 million from higher treasury stock as a result of repurchases of common stock in the aggregate amount of $70.3 $91.6 million in 2024 during 2025 in connection with the two $50 million approved stock buy back repurchase programs announced during 2024, and a higher accumulated other comprehensive loss, net of tax, of $22.8 million from unfavorable market value adjustments in AFS, mainly MBS, due to volatile financial markets and uncertainty in economic and political environment. for such period.
Read it in 10-K Feb 25, 2026 at sec.gov
RewordedMD&A
RewordedMD&A
NOW accounts 12,076 40,576 52,652 (1,791) (15,308) (17,099) Savings accounts (1,579) 2,695 1,116 1,797 2,224 4,021 Time deposits 8,508 12,749 21,257 8,612 1,120 9,732 Brokered deposits 266 (221) 45 6,820 (252) 6,568 Fair value premium and core deposit intangible amortizations — (755) (755) Securities sold under agreements to repurchase (2,373) (391) (2,764) 2,226 (1) 2,225 Advances from FHLB and other borrowings 2,125 151 2,276 7,064 (1,124) 5,940 Total interest expense 19,023 54,804 73,827 24,728 (14,096) 10,632 Net Interest Income $ 48,802 22,482 $ (21,232) (2,455) $ 27,570 20,027
Read it in 10-K Feb 25, 2026 at sec.gov
RewordedMD&A
December 31, Variance % 2025 2024 2023 (Dollars in thousands) Non-performing loans Non-PCD Commercial loans $ 87,253 $ 38,913 $ 36,096 7.8% 124.2% Mortgage loans 17,400 16,928 20,007 (15.4)% 2.8% Consumer loans 4,378 4,207 3,376 24.6% 4.1% Auto loans 20,750 20,055 19,056 5.2% 3.5% Total $ 129,781 $ 80,103 $ 78,535 2.0% 62.0% PCD Commercial loans $ 55 $ 2,641 $ 6,424 (58.9)% (97.9)% Mortgage loans 227 239 250 (4.4)% (5.0)% Total $ 282 $ 2,880 $ 6,674 (56.8)% (90.2)% Total non-performing loans $ 130,063 $ 82,983 $ 85,209 (2.6)% 56.7% Non-performing loans composition percentages:
Read it in 10-K Feb 25, 2026 at sec.gov
RewordedMD&A
Year Ended December 31, 2025 2024 2023 Variance % (In (Dollars in thousands) Banking service revenue $ 64,443 $ 66,923 $ 70,078 (4.5)% (3.7)% Wealth management revenue 37,765 35,622 32,990 8.0% 6.0% Mortgage banking activities 19,133 18,636 18,787 (0.8)% 2.7% Total banking and financial service revenue 121,341 121,181 121,855 (0.6)% Net loss on sale of securities (7) (1,149) (99.4)% 0.1% Other non-interest income 2,075 7,675 (73.0)% 1,635 2,068 (20.9)% Total non-interest income $ 122,976 $ 123,249 $ 128,381 (4.0)% (0.2)%
Read it in 10-K Feb 25, 2026 at sec.gov
RewordedMD&A
This increase reflects an increase in retained earnings of $132.7 million and legal surplus of $18.6 $132.6 million, mainly due to $198.2 $205.1 million in net income, partially offset by $46.9 $53.5 million in dividends declared on common stock dividends. and legal surplus of $19.0 million, and lower accumulated other comprehensive loss, net of tax, of $72.9 million from favorable market value adjustments in available-for-sale investment securities.
Read it in 10-K Feb 25, 2026 at sec.gov
RewordedMD&A
Sources
The two latest 10-Ks on EDGAR, section by section. Each change links to the text at sec.gov.
Also
New risk factors: paragraphs with nothing like them last year, quoted in full.
Work with it
Excel workbook · CSV. Google Sheet that stays up to date: paste =IMPORTDATA("https://tickdelta.com/company/OFG/export.csv") into a cell.