Privia Health Group, Inc. PRVA
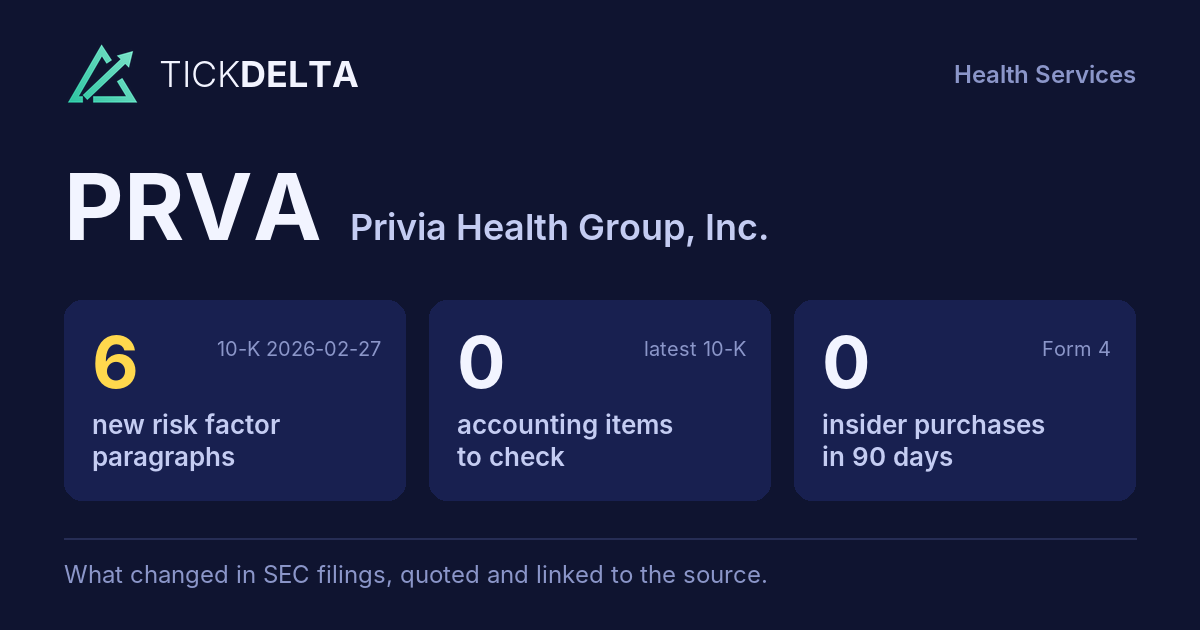
The biggest changes in the 10-K filed Feb 27, 2026, in management's words
10-K, Item 7This fiscal year against the last, and the sentences in the MD&A where management explains each change. Tickdelta picks sentences that name the line, a direction and a cause. It does not write explanations of its own.
Net income
Big change, FY to Dec 31, 2025 vs Dec 31, 2024
“The provision for income taxes increased as a result of higher income before income taxes.”
Read it in the 10-K
“Net income attributable to non-controlling interests was $6.8 million for the year ended December 31, 2025, an increase compared to $2.7 million during the comparative period in 2024.”
Read it in the 10-K
Cash from operations
Big change, FY to Dec 31, 2025 vs Dec 31, 2024
The MD&A has no sentence that names a cause for this change.
Revenue
Big change, FY to Dec 31, 2025 vs Dec 31, 2024
“Our FFS revenue is primarily dependent upon the size of our provider base, payer contracted rates and patient volume.”
Read it in the 10-K
“Our VBC revenue is primarily dependent upon the number of attributed patients in our VBC arrangements, risk levels of our payer contracts, and effective management of our patients’ total cost of care.”
Read it in the 10-K
Operating margin
Change, FY to Dec 31, 2025 vs Dec 31, 2024
The MD&A has no sentence that names a cause for this change.
What management said, year by year
The cause given in each 10-K, 2 fiscal years, newest first · MD&A (Item 7)
Each bar is how the line changed that year (from the same 10-K's XBRL). Under it, the sentence in that year's MD&A that names the line, a direction and a cause, word for word. A year with no sentence says so.
Revenue
2 of 2 years explained-
FY 2025 +22.3%
“Our FFS revenue is primarily dependent upon the size of our provider base, payer contracted rates and patient volume.”
Read it in the FY 2025 10-K“Our VBC revenue is primarily dependent upon the number of attributed patients in our VBC arrangements, risk levels of our payer contracts, and effective management of our patients’ total cost of care.”
Read it in the FY 2025 10-K -
FY 2024 +4.7%
“As a percentage of revenue, Care Margin was 23.3% for the year ended December 31, 2024 an increase from 21.7% for the same period in 2023 due to renegotiated certain at-risk capitation agreements for a more favorable contract structure which is reflected on a net basis under shared savings starting in 2024 and a decrease from 22.5% in 2022, due to the addition of the at-risk capitation arrangements during 2022 and 2023 resulting in higher revenues.”
Read it in the FY 2024 10-K“Key drivers of this revenue growth include: FFS–patient care revenue and FFS-administrative services, which increased $169.5 million and $12.3 million, primarily attributable to the addition of new providers and an increase in visit volume; an increase in PMPM revenue of $13.5 million primarily due to increased Attributed Lives; shared savings revenue, which increased $9.1 million primarily due to more Attributed Lives in Medicare programs as well as continued strong estimated performance in our value based care programs in the aggregate.”
Read it in the FY 2024 10-K
Operating margin
0 of 2 years explained-
FY 2025 +0.6 pts
The FY 2025 MD&A has no sentence that names a cause for this change.
-
FY 2024 -0.3 pts
The FY 2024 MD&A has no sentence that names a cause for this change.
Net income
2 of 2 years explained-
FY 2025 +59.3%
“The provision for income taxes increased as a result of higher income before income taxes.”
Read it in the FY 2025 10-K“Net income attributable to non-controlling interests was $6.8 million for the year ended December 31, 2025, an increase compared to $2.7 million during the comparative period in 2024.”
Read it in the FY 2025 10-K -
FY 2024 -37.7%
“Net income attributable to non-controlling interests was $2.7 million for the year ended December 31, 2024, an increase compared to a (loss) of $(2.1) million during the same period in 2023.”
Read it in the FY 2024 10-K“Net income was $17.0 million during the year ended December 31, 2024 compared to the income of $21.0 million during the year ended December 31, 2023, primarily driven by the increase in stock-based compensation expense during the year ended December 31, 2024 when compared to the same period in 2023.”
Read it in the FY 2024 10-K
Cash from operations
0 of 2 years explained-
FY 2025 +49.5%
The FY 2025 MD&A has no sentence that names a cause for this change.
-
FY 2024 +35.3%
The FY 2024 MD&A has no sentence that names a cause for this change.
Changes are computed from the XBRL figures in the same 10-K. Hover a number to see the line item. Open the 10-K
Sources
The Management's Discussion and Analysis (Item 7) of the latest 10-K, quoted word for word; the changes are computed from the same 10-K's XBRL.
Also
Financials: the numbers year by year.
Work with it
Excel workbook · CSV. Google Sheet that stays up to date: paste =IMPORTDATA("https://tickdelta.com/company/PRVA/export.csv") into a cell.