Form 10-K
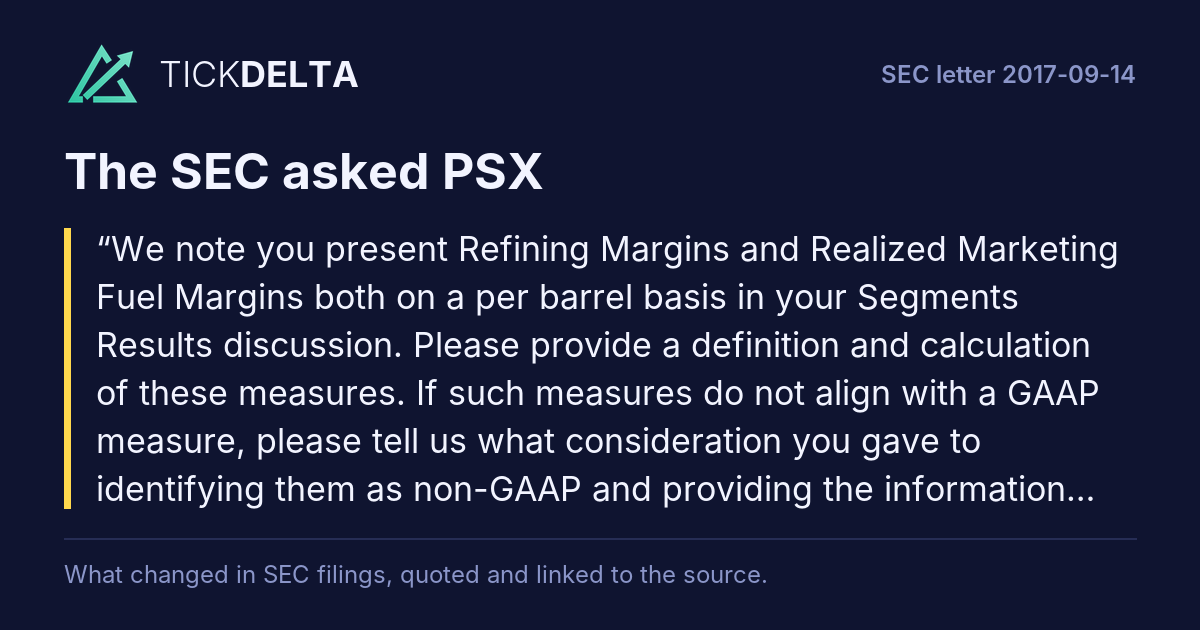
We note you present Refining Margins and Realized Marketing Fuel Margins both on a per barrel basis in your Segments Results discussion. Please provide a definition and calculation of these measures. If such measures do not align with a GAAP measure, please tell us what consideration you gave to identifying them as non-GAAP and providing the information set forth in Item 10(e) of Regulation S-K.
Set forth below are the definitions and calculations of the two statistical measures requested by the Staff.
Realized Marketing Fuel Margins Per Barrel
Realized marketing fuel margins per barrel measure the difference between a) sales and other operating revenues and associated other income derived from the sale of fuels in our Marketing and Specialties segment and b) purchase costs of those fuels.Read in the reply ↗Rest of the answer
These margins are then converted to a per-barrel basis by dividing the dollar value of marketing fuel margins by sales volumes measured on a barrel basis.
For the supplemental information of the Staff, the table below illustrates the calculation for the year ended December 31, 2016:
Millions of Dollars
Except as Indicated
Marketing Fuel Margin
U.S.
International
Year Ended December 31, 2016
Sales and other operating revenues
$
42,076
6,319
Plus (Less):
Purchased crude oil and products
(40,927
)
(5,887
Realized marketing fuel margin
1,149
432
Total fuel sales volumes (thousands of barrels)
699,111
106,574
Realized marketing fuel margin per barrel (dollars per barrel)
1.64
4.05
As illustrated above, we believe our realized marketing fuel margin per barrel calculation is a GAAP-based financial measure, as the revenues and purchase costs utilized in the calculation were derived in accordance with GAAP. To allow for greater transparency in the disclosure, in future filings we will provide a narrative explanation of how this measure is defined and calculated.
Refining Margins Per Barrel
Refining margins measure the difference between a) sales and other operating revenues and associated other income derived from the sale of petroleum products manufactured at our refineries and b) purchase costs of feedstocks, primarily crude oil, used to produce the petroleum products. These margins are then converted to a per-barrel basis by dividing the dollar value of refining margins by total refinery processed inputs measured on a barrel basis. Our definition of realized refining margin is intended to be comparable with industry refining margins, which are known as “crack spreads.” As discussed on page 32 of our 2016 Form 10-K, industry crack spreads measure the difference between market prices for refined petroleum products and crude oil. By calculating our realized refining margins on a similar basis as industry crack spreads, we are able to provide investors with a useful measure of how well we performed relative to benchmark industry margins.
We perform our realized refining margin per barrel calculation for each of our ten wholly owned refineries, as well as our three joint-venture refineries. These amounts are presented by geographic region and in total for our worldwide operations on a weighted-average-throughput basis.
For the supplemental information of the Staff, the table below illustrates the calculation for our worldwide operations for the year ended December 31, 2016:
Refining Margin
Worldwide
52,068
Other income
(47,103
Refining margin
4,969
Proportional share of refining margins contributed by equity affiliates
755
Special items
(32
Realized refining margin
5,692
Total processed inputs (thousands of barrels)*
814,113
Realized refining margin per barrel (dollars per barrel)
6.99
* Includes our proportional share of processed inputs of equity affiliates.
As noted above, we incorporate the realized refining margins of our joint-venture refineries that we account for using the equity method of accounting by taking our proportional share of the joint-venture refinery’s realized margin and processed inputs. These amounts are calculated on a basis consistent with our wholly owned refineries. We believe it is necessary to present a refining margin inclusive of our share of the refining margins of joint-venture refineries for investors to understand our performance, as these joint ventures are an integral part of our refining operations, with our share of their refining crude oil throughput capacity representing 14 percent of our total worldwide capacity. In addition, we adjust revenues or purchase costs if they are impacted by items that are not representative of the underlying operating performance of a period. We refer to these as “special items,” and they include such items as lower-of-cost-or-market inventory adjustments and certain legal settlements.
The adjustments for special items and for our proportional share of the joint-venture refineries render the refining margins per barrel a non-GAAP measure. However, during the three-year period presented in the 2016 Form 10-K, the impact of these adjustments on the worldwide refining margin per barrel was not material, ranging from 1 percent to 3 percent in each year presented. After reconsidering our presentation in light of the Staff’s comment, we plan to present, on a prospective basis beginning with the third-quarter 2017 Form 10-Q, a definition of refining margin per barrel, as well as both a GAAP and non-GAAP calculation of our realized refining margins, accompanied by the reconciliations and disclosures required by Item 10(e) of Regulation S-K, regardless of the materiality of such non-GAAP adjustments.
If you have any additional questions or comments, please contact the undersigned.
First report after the company's reply of 2017-09-22: 10-Q filed 2017-10-27 ↗, against the 10-Q filed 2017-08-01 ↗.
Tickdelta does not hold the text of both reports, so they are not compared here.
We have read your response to prior comment one in which you provide details of how marketing fuel margin, refining margin and realized refining margin are calculated on a per barrel basis. Further, we note on a prospective basis you intend to include a definition and calculation for each of these measures in your filings.Rest of the question
Please include details of how the amounts used in the calculations are derived from your financial statements and related note disclosures. In addition, please indicate these margin measures are not comparable to GAAP gross margin or gross profit as you subtract some but not all of the expenses that comprise a complete cost of sales measure from revenue in your calculations.
We acknowledge the Staff’s comment and, in future filings, will reconcile our marketing and refining margins per barrel to the nearest GAAP measure – “net income attributable to Phillips 66 per barrel” for each respective measure. This reconciliation will be accompanied by the disclosures required by Item 10(e) of Regulation S-K.
Using 2016 as an example, we propose to include the following reconciliations and expanded disclosures in our upcoming Form 10-Q and Form 10-K filings in regards to our marketing and refining margins per barrel:
Realized Marketing Fuel Margins Per Barrel
TheRead in the reply ↗Rest of the answer
following table presents our realized marketing fuel margin per barrel. Realized marketing fuel margins measure the difference between a) sales and other operating revenues derived from the sale of fuels in our Marketing and Specialties segment and b) purchase costs of those fuels. These margins are converted to a per-barrel basis by dividing them by sales volumes measured on a barrel basis. Marketing fuel margin per barrel demonstrates the value uplift our marketing operations provide by optimizing the placement and ultimate sale of our refineries’ fuel production.
Within the Marketing and Specialties segment, the GAAP performance measure most directly comparable to marketing fuel margin per barrel is the marketing business’ “net income attributable to Phillips 66 per barrel.” Marketing fuel margin per barrel excludes items that are typically included in gross margin, such as depreciation and operating expenses, and other items used to determine net income, such as general and administrative expenses and income taxes. Because marketing fuel margin per barrel excludes these items, and because marketing fuel margin per barrel may be defined differently by other companies in our industry, it has limitations as an analytical tool.
Dollars Per Barrel
2016
Net Income Attributable to Phillips 66
U.S.
$
0.74
International
2.21
Realized Marketing Fuel Margins
1.64
4.05
Non-GAAP Reconciliations
Millions of Dollars
Year Ended December 31, 2016
Net income attributable to Phillips 66
519
235
Plus (Minus):
Provision for income taxes
285
Taxes other than income taxes
5,187
8,132
Depreciation and amortization
Selling, general and administrative expenses
708
259
Equity in earnings of affiliates
(4
)
(75
Other operating revenues*
(5,558
(8,157
Other segment (income) expenses, net
—
Marketing margins
1,149
477
Less: Margin for non-fuel related sales
(45
Realized marketing fuel margins
432
Total fuel sales volumes (thousands of barrels)
699,111
106,574
Net income attributable to Phillips 66 per barrel (dollars per barrel)
Realized marketing fuel margins (dollars per barrel)
* Primarily excise taxes and other non-fuel revenues.
Refining Margins Per Barrel
The following table presents our realized refining margin per barrel. Realized refining margins measure the difference between a) sales and other operating revenues derived from the sale of petroleum products manufactured at our refineries and b) purchase costs of feedstocks, primarily crude oil, used to produce the petroleum products. The margins are adjusted to include our proportional share of our joint venture refineries’ realized margins, as calculated above, as well as to exclude those items that are not representative of the underlying operating performance of a period, which we call “special items.” The realized refining margins are converted to a per-barrel basis by dividing them by total refinery processed inputs (primarily crude oil) measured on a barrel basis, including our share of inputs processed by our joint venture refineries. Our realized refining margin per barrel is intended to be comparable with industry refining margins, which are known as “crack spreads.” As discussed in “Business Environment,” industry crack spreads measure the difference between market prices for refined petroleum products and crude oil. Realized refining margin per barrel calculated on a similar basis as industry crack spreads provides a useful measure of how well we performed relative to benchmark industry margins.
The GAAP performance measure most directly comparable to refining margin per barrel is the Refining segment’s “net income attributable to Phillips 66 per barrel.” Refining margin per barrel excludes items that are typically included in a manufacturer’s gross margin, such as depreciation and operating expenses, and other items used to determine net income, such as general and administrative expenses and income taxes. It also includes our proportional share of joint venture refineries’ realized margins and excludes special items. Because refining margin per barrel is calculated in this manner, and because refining margin per barrel may be defined differently by other companies in our industry, it has limitations as an analytical tool.
Atlantic Basin/Europe
0.93
Gulf Coast
0.18
Central Corridor
2.38
West Coast
(0.92
Worldwide
0.51
Realized Refining Margins
6.26
5.49
8.70
9.15
6.99
Net income (loss) attributable to Phillips 66
204
234
(116
374
Provision (benefit) for income taxes
(17
133
(72
253
Depreciation, amortization and impairments
200
106
230
770
195
Operating expenses
817
1,234
465
979
3,495
(50
(122
(164
(11
(6
(2
(16
Proportional share of refining gross margins contributed by equity affiliates
705
756
Special items:
Pending claims and settlements
(70
Certain tax impacts
(32
Recognition of deferred logistics commitments
Railcar lease residual value deficiencies and related costs
Realized refining margins
1,381
1,556
1,599
1,156
5,692
Total processed inputs (thousands of barrels)
220,519
283,574
98,217
126,329
728,639
Adjusted total processed inputs (thousands of barrels)*
183,691
814,113
Net income (loss) attributable to Phillips 66 per barrel (dollars per barrel)**
Realized refining margins (dollars per barrel)***
* Adjusted total processed inputs include our proportional share of processed inputs of equity affiliates.
** Net income (loss) attributable to Phillips 66 divided by total processed inputs.
*** Realized refining margin divided by adjusted total processed inputs.
First report after the company's reply of 2017-10-23: 10-Q filed 2017-10-27 ↗, against the 10-Q filed 2017-08-01 ↗.
Tickdelta does not hold the text of both reports, so they are not compared here.
Also in this review: closing letter, 2017-11-07