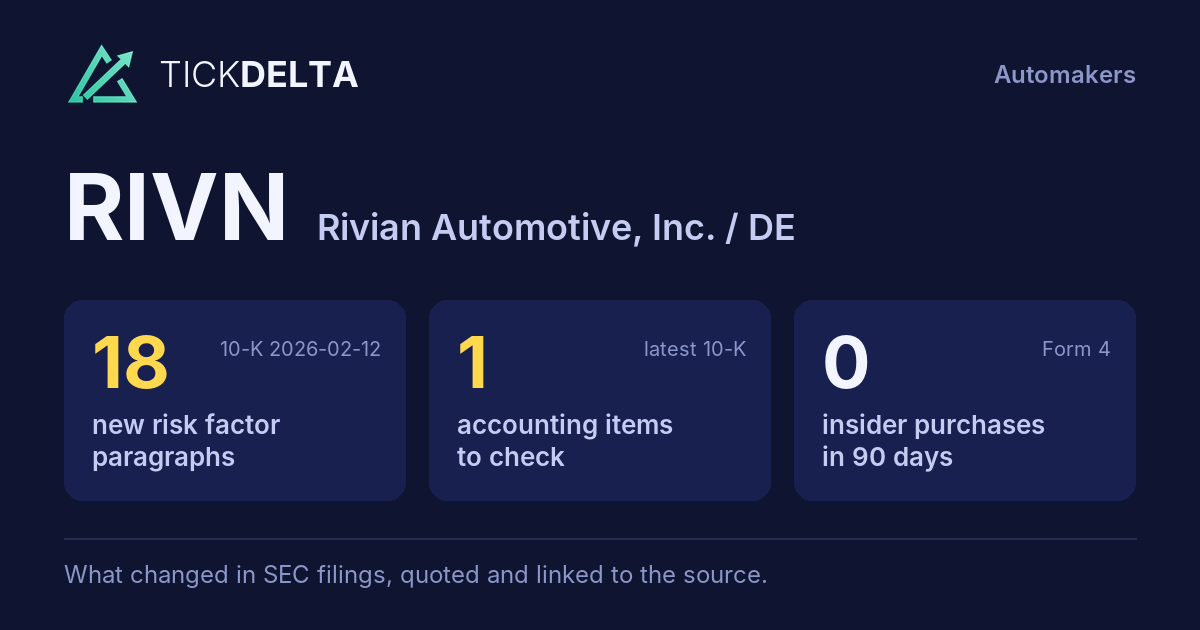
Screener / SEC EDGAR /CIK 0001874178 /10-K filed Feb 12, 2026, compared with Feb 24, 2025 /Numbers from the XBRL of the 10-Ks
Nasdaq Consumer discretionary · Automakers

Rivian Automotive, Inc. / DE RIVN

Compare with peers Embed
Earnings releases

Latest results release: Oct 29, 2026

8-K item 2.02, exhibit 99

What RIVN's management wrote with each quarter's results: the press release and, when the company files them, its prepared remarks or the call transcript. The call itself is not filed with SEC, so most quarters have the release only.

Read and search

Every release, in full · linked to sec.gov

Press release Oct 29, 2026 · EX-99.1

Rivian Releases Third Quarter 2026 Financial Results

Open on SEC

• Deliveries up 46 percent year-over-year with R2 already the best-selling Rivian vehicle by volume, outselling both R1 and EDV in the third quarter

• Given Rivian’s strong performance, the company is improving 2026 guidance across all metrics

Irvine, California, October 29, 2026: Rivian Automotive, Inc. (NASDAQ: RIVN), an American automotive technology company that develops and manufactures category- defining electric vehicles as well as vertically integrated technologies and offers a suite of value-added services, today announced its third quarter 2026 financial results.

“We had great results with R2 becoming our best selling vehicle by volume in the third quarter. Customer and media feedback on R2 has been exceptional. Regarding our technology roadmap, our autonomy platform is progressing rapidly, and we are super excited about Point to Point. We are laying the foundations for a future that we believe will be fully electric, autonomous and AI defined. I could not be more excited about the opportunity ahead for Rivian.”

Rivian achieved record production volumes in Normal, Illinois as it continued to ramp R2 manufacturing. The company had record deliveries of 19,248 units with R2 delivering much of the gain quarter-over-quarter. R2 is already the best-selling Rivian vehicle, outselling both R1 and EDV in the third quarter. R2 continues to generate rave reviews and awards from the media and recently won Top Gear’s SUV of the Year for 2027.

Rivian continues to innovate with software and AI. With the Rivian Assistant, Rivian has developed a smarter and more customizable AI-defined vehicle experience for R1 and R2 owners. In its October OTA (over-the-air) update, the company added Gmail integration to Rivian Assistant and released the annual “Halloween Mode.”

Rivian continues to see strong momentum in the company’s Autonomy+ offering, which is available on every R2 and R1 starting with the 2025 model year. Today, every vehicle with Autonomy+ is capable of Universal Hands-Free on millions of miles of roads. Rivian’s next milestone is the company’s Point to Point feature. This means customers will be able to enter an address while their vehicle follows the route from start to finish, handling city streets, stop lights, highway interchanges and everything in-between with driver supervision. A limited rollout of Point to Point is expected to begin later this year via the invitation-only Autonomy Early Access Program, with a general release to all Autonomy+ subscribers expected in 2027. Rivian believes Point to Point capabilities will be an important purchase criteria for customers and are becoming a driver of market share. Additionally, last week, Rivian announced the acquisition of Third Dimension AI to support its closed loop simulation efforts. The company will share more at its Autonomy and AI Day on December 9.

Production and Deliveries •19,751 vehicles produced at Rivian’s manufacturing facility in Normal, Illinois. •19,248 vehicles delivered to customers. Revenues •Consolidated revenue was $2.155 billion, a 38 percent increase overthe same quarter of the prior year. This was driven by a 46 percent year-over-year increase in delivery volumes, $81 million in revenues related to regulatory credits, and strong performance from the company’s software and services segment. ◦Automotive revenue was $1.550 billion, a 36 percent increase overthe same quarter of the prior year, primarily due to the increase in vehicle deliveries and an $80 million increase in revenues related to regulatory credits, which were partially offset by a decline in average vehicle selling price due to a higher mix of R2 and commercial van deliveries. ◦Software and services revenue was $605 million, a 45 percent increase overthe same quarter of the prior year, primarily due to increases in vehicle electrical architecture and software development services, vehicle repair and maintenance services, and Autonomy+, partially offset by lower remarketing sales. $354 million or 59 percent of software and services revenue was attributable to the company’s joint venture with Volkswagen Group. Gross Profit •Consolidated gross profit was $176 million, a $152 million improvement overthe same quarter of the prior year. ◦Automotive gross profit loss for the third quarter was $(80) millioncompared to$(130) million inthe same quarter of the prior year, a $50 million improvementprimarily resulting from increases in delivery volumes at an improved per unit margin, an increase in revenues related to regulatory credits, and an IEEPA tariff refund receivable, partially offset by costs related to the ramp of R2 production. In the quarter, Rivian recognized approximately $120 million in incremental cost of revenues due to the ramp of R2 production as compared to production at more normalized levels. ◦Software and servicesgross profitfor thethirdquarter was $256 million,a 42 percent margin and $102 million improvement overthe same quarter of the prior year at$154 million,primarily due to increases in vehicle electrical architecture and software development services from the joint venture with Volkswagen Group and Autonomy+. Operating Expenses and Operating Loss •Total operating expenses in the third quarter increased to $1.057 billion compared to $1.007 billion inthe same quarter of the prior year. ◦Research and development (R&D) expenses were $485 million compared to $453 million inthe same quarter of the prior year. The increase was primarily driven by increases in software expenses to support AI and autonomy initiatives,partially offset by a reduction in engineering, design, and development spend. ◦Selling, general and administrative (SG&A) expenses remained relatively consistent at $572 million compared to $554 million inthe same quarter of the prior year. •For the third quarter, the company experienced a loss from operations of $(881) million compared to $(983) million inthe same quarter of the prior year, a $102 million improvement.

Adjusted Operating Expenses (non-GAAP) •Total adjusted operating expenses for the third quarter were $799 million compared to $783 million forthe same quarter of the prior year. ◦Adjusted R&D expenses for the third quarter were $382 million compared to $361 million forthe same quarter of the prior year. ◦Adjusted SG&A expenses for the third quarter were $417 million compared to $422 million forthe same quarter of the prior year. Net Loss •Net loss attributable to common stockholders for the third quarter was $(913) million compared to $(1.173) billion forthe same quarter of the prior year. Adjusted EBITDA (non-GAAP) •Adjusted EBITDA for the third quarter was $(435) million compared to $(602) million forthe same quarter of the prior year. Net Cash Used in Operating Activities •Net cash (used in) provided by operating activities for the third quarter was $(758) million, compared to $26 million forthe same quarter of the prior year, primarily driven by a change in cash used by working capital. Cash used by working capital for the third quarter of 2026 was primarily driven by a reduction in deferred revenues and a buildup of inventory purchases to support the launch of R2. Adjusted Net Loss Per Share •Adjusted net loss per share for the third quarter was $(0.48) compared to $(0.65) forthe same quarter of the prior year. Capital Expenditures •Capital expenditures for the third quarter were $(366) million, compared to $(447) million forthe same quarter of the prior year. Liquidity and Free Cash Flow (non-GAAP) •Rivian ended the third quarter with $5.502 billion in cash, cash equivalents, and short-term investments. ◦Including the capacity under its asset-based revolving-credit facility, the company ended the third quarter with $6.095 billion of total liquidity, which, with the pro forma addition of $1.000 billion received in October 2026 from the non-recourse 10-year term loan facility from Volkswagen Group, would be total available liquidity of $7.095 billion. •Rivian defines free cash flow as net cash used in operating activities less capital expenditures. The net cash used by operating activities in the third quarter partially offset by the decrease in capital expenditures identified above resulted in free cash flow of $(1,124) million compared to $(421) million forthe same quarter of the prior year.

Full year delivery guidance is improving from 65,000 - 70,000 units to 67,000 - 70,000 units as a result of the production and delivery outlook for the fourth quarter of 2026.

Adjusted EBITDA is improving by $100 million at the mid-point due to better than expected revenue related to regulatory credits, an IEEPA tariff refund receivable in the third quarter, and an expected increase in delivery volumes.

• Capital Expenditures are decreasing by $300 million at the mid-point due to timing of spend.

Current Outlook Vehicles Delivered 67,000 – 70,000 Adjusted EBITDA $(1.85)B – $(1.75)B Capital Expenditures $1.40B – $1.50B

Rivian will host an audio webcast to discuss its results and provide a business update at 2:00pm PT / 5:00pm ET on October 29, 2026. The link to the webcast and shareholder presentation will be made available on the company’s Investor Relations website at rivian.com/investors . After the call, a replay will be available at rivian.com/investors for four weeks.

Quarterly Financial Performance (in millions, except production, delivery, and gross margin) (unaudited)

Condensed Consolidated Balance Sheets1 (in millions, except per share amounts) (unaudited)

Assets December 31, 2025 September 30, 2026 ────────────────────────────────────────────────────────────────────────────── Current assets: Cash and cash $ 3,579 $ 3,509 equivalents Short-term 2,503 1,993 investments Accounts receivable, 555 596 net Inventory 1,594 1,779 Other current assets 361 259 Total current assets 8,592 8,136 Property, plant, and 5,119 5,605 equipment, net Operating lease 571 778 assets, net Strategic investments 119 682 Other non-current 463 526 assets Total assets $ 14,864 $ 15,727 Liabilities and Stockholders’ Equity Current liabilities: Accounts payable $ 595 $ 1,038 Accrued liabilities 1,438 1,104 Current portion of deferred revenues, 1,660 1,598 lease liabilities, and other liabilities Total current 3,693 3,740 liabilities Long-term debt 4,440 4,446 Non-current lease 551 764 liabilities Other non-current 1,586 1,059 liabilities Total liabilities 10,270 10,009 Commitments and contingencies Stockholders' equity: Preferred stock, $0.001 par value; 10 shares authorized and 0 shares issued — — and outstanding as of December 31, 2025 and September 30, 2026 Common stock, $0.001 par value; 5,258 and 5,258 shares authorized and 1,240 and 1,460 shares issued and 1 1 outstanding as of December 31, 2025 and September 30, 2026, respectively Additional paid-in 31,508 34,806 capital Accumulated deficit -26,951 -29,113 Accumulated other comprehensive income 8 -3 (loss) Noncontrolling 28 27 interest Total stockholders' 4,594 5,718 equity Total liabilities and stockholders' $ 14,864 $ 15,727 equity 1The prior period has been recast to conform to current period presentation.

Condensed Consolidated Statements of Operations (in millions, except per share amounts) (unaudited)

Nine Months Ended Cash flows from September 30, operating activities: 2025 2026 ────────────────────────────────────────────────────────────────────────────── Net loss $ -2,822 $ -2,160 Depreciation and 583 682 amortization Stock-based compensation 551 634 expense Gain on strategic -101 -506 investments Other non-cash -6 89 activities Changes in operating assets and liabilities: Accounts receivable, net 267 -44 Inventory 511 -372 Other assets -26 144 Accounts payable and 488 268 accrued liabilities Deferred revenues 495 -637 Other liabilities -38 -46 Net cash used in -98 -1,948 operating activities Cash flows from investing activities: Purchases of short-term investments and -2,571 -2,045 shares for deferred compensation Sales of short-term investments and 107 32 shares for deferred compensation Maturities of short-term 2,204 2,463 investments Deconsolidation of Mind — -114 Robotics, Inc. Capital expenditures -1,247 -1,100 Net cash used in -1,507 -764 investing activities Cash flows from financing activities: Proceeds from stock-based compensation $ 34 $ 40 programs Proceeds from issuance 750 2,617 of capital stock Proceeds from issuance 1,250 — of long-term debt Repayments of long-term -1,250 — debt Other financing -37 -11 activities Net cash provided by financing 747 2,646 activities Effect of exchange rate changes on cash 5 -4 and cash equivalents Net change in cash -853 -70 Cash and cash equivalents, and 5,294 3,579 restricted cash - Beginning of period Cash and cash equivalents, and $ 4,441 $ 3,509 restricted cash - End of period Supplemental disclosure of non-cash investing and financing activities: Capital expenditures included in $ 499 $ 386 liabilities Capital stock issued to $ 47 $ 110 settle bonuses Right-of-use assets obtained in exchange $ 224 $ 302 for operating lease liabilities 1The prior period has been recast to conform to current period presentation.

Quarterly Financial Performance Reconciliation of Non-GAAP Financial Measures Continued (in millions, except per share amounts) (unaudited)

This press release and statements that are made on our earnings call contain forward-looking statements within the meaning of the Private Securities Litigation Reform Act of 1995. All statements contained in this press release and made on our earnings call that do not relate to matters of historical fact should be considered forward-looking statements, including without limitation statements regarding our future operations, initiatives and business strategy, including our future financial results, liquidity, vehicle profitability and future gross profits, our future capital expenditures and R&D investments, the underlying trends in our business (including customer preferences and expectation), macroeconomic and policy conditions, including changes to applicable tariffs and to the availability of government and economic incentives, including tax credits, for electric vehicles, our market opportunity, and our potential for growth, our production ramp and manufacturing capacity expansion and anticipated production levels, the timeline for the construction activity at the Georgia plant, the timeline for drawing on our Department of Energy Loan, our expected future production and deliveries, our expected future products and technology and product enhancements, including enhanced performance features and pricing (including the timing of launches and customer deliveries), our roadmap and timeline for the release of our next- generation vehicle autonomy systems, hardware, and software architecture underpinned by artificial intelligence, including LDM, Rivian Assistant, Universal Hands-Free, RUI, and Point to Point, future revenue opportunities, including with respect to the emerging autonomous driving market, our joint venture with Volkswagen Group, including the expected benefits from the partnership and future Volkswagen Group investments, our partnership with Uber Technologies, Inc., including the expected benefits from the partnership and future Uber investments, the achievement of certain milestones and regulatory approvals, the expected benefits of the Third Dimension AI acquisition, and expected benefits from partnerships with other third parties. These statements are neither promises nor guarantees and involve known and unknown risks, uncertainties, and other important factors that may cause our actual results, performance, or achievements to be materially different from any future results, performance, or achievements expressed or implied by the forward-looking statements, including, but not limited to: our history of losses as a growth- stage company and our limited operating history; we may underestimate or not effectively manage the cost of revenues, operating expenses, and capital expenditures associated with our business and operations; that we will require additional financings to raise capital to support our business; our ability to attract and retain a large number of consumers and maintain strong demand for our vehicles, software and services; the highly competitive automotive and software and services markets in which we operate; demand for and consumers’ willingness to adopt electric vehicles; that our long-term results depend upon our ability to successfully introduce, integrate and market new products and services; that we have experienced and may in the future experience significant delays in the manufacture and delivery of our vehicles; risks associated with the development of complex software and hardware in coordination with our joint venture with Volkswagen Group and our other vendors and suppliers; risks associated with our joint venture with Volkswagen Group; risks associated with additional strategic alliances or acquisitions; we have experienced and could experience in the future cost increases and disruptions in supply of raw materials, components, or equipment used to produce our vehicles; our dependence on establishing and maintaining relationships with vendors and suppliers; our ability to accurately estimate the supply and demand for our vehicles and predict our manufacturing requirements; our ability to scale our business and manage future growth effectively; our ability to maintain our relationship with one customer that has generated a significant portion of our revenues; that we are highly dependent on the services and reputation of our Founder and Chief Executive Officer; the unavailability, reduction or elimination of government and economic incentives and credits for electric vehicles; that we may not be able to obtain or agree on acceptable terms and conditions for all or a significant portion of the government grants, loans, and other incentives, including regulatory credits, for which we apply or are approved for; risks

associated with breaches in data security, failure of technology systems, cyber- attacks or other security or privacy-related incidents; risk of intellectual property infringement claims; effect of trade tariffs or other trade barriers; effects of export and import control laws; risks related to motor vehicle safety standards; delays, limitations and risks related to permits and other approvals required to build, operate or expand operations including the construction and development of facilities to support R2; and the other factors described in our filings with the SEC. These factors could cause actual results to differ materially from those indicated by the forward-looking statements made in this press release. Any such forward-looking statements represent management’s estimates as of the date of this press release. While we may elect to update such forward-looking statements at some point in the future, except as may be required by law, we disclaim any obligation to do so, even if subsequent events cause our views to change.

In addition to our results determined in accordance with generally accepted accounting principles in the United States (“GAAP”), we review financial measures that are not calculated and presented in accordance with GAAP (“non- GAAP financial measures”). We believe our non-GAAP financial measures are useful in evaluating our operating performance. We use the following non-GAAP financial information, collectively, to evaluate our ongoing operations and for internal planning and forecasting purposes. We believe that non-GAAP financial information, when taken collectively, may be helpful to investors, because it focuses on underlying operating results and trends, provides consistency and comparability with past financial performance, and assists in comparisons with other companies, some of which use similar non-GAAP financial information to supplement their GAAP results. The non-GAAP financial information is presented for supplemental informational purposes only, should not be considered a substitute for financial information presented in accordance with GAAP, and may be different from similarly titled non-GAAP measures used by other companies. A reconciliation of each historical non-GAAP financial measure to the most directly comparable financial measure stated in accordance with GAAP is provided above. Reconciliations of forward- looking non-GAAP financial measures are not provided because we are unable to provide such reconciliations without unreasonable effort due to the uncertainty regarding, and potential variability of, certain items, such as stock-based compensation expense and other costs and expenses that may be incurred in the future. Investors are encouraged to review the related GAAP financial measures and the reconciliation of these non-GAAP financial measures to their most directly comparable GAAP financial measures.

Our non-GAAP financial measures include adjusted research and development expenses, adjusted selling, general, and administrative expenses, total adjusted operating expenses, adjusted EBITDA, adjusted net loss, adjusted net loss per share, and free cash flow.

Adjusted research and development expenses is defined as total research and development expenses, less R&D depreciation and amortization expenses and R&D stock-based compensation expenses.

Adjusted selling, general, and administrative expenses is defined as total selling, general, and administrative expenses, less SG&A depreciation and amortization expenses and SG&A stock-based compensation expenses.

Adjusted operating expenses is defined as total operating expenses, less R&D depreciation and amortization expenses, R&D stock-based compensation expenses, SG&A depreciation and amortization expenses, and SG&A stock-based compensation expenses.

Adjusted EBITDA is defined as net loss before interest expense (income), net, provision for income taxes, depreciation and amortization, stock-based compensation, other expense (income), net, and special items. Our management team ordinarily excludes special items from its review of the results of the ongoing operations. Special items is comprised of (i) cost of revenue efficiency initiatives which include costs incurred as we transition between major vehicle programs, cost incurred for negotiations with major suppliers regarding changing demand forecasts or design modifications, and other costs for enhancing capital and cost optimization of the Company (ii) restructuring expenses for significant actions taken by the Company, (iii) significant asset impairments and write- offs, and (iv) other items that we do not necessarily consider to be indicative of earnings from ongoing operating activities, including fair value gain or loss on convertible note, net, and joint venture formation expenses.

Adjusted net loss is defined as net loss before stock-based compensation expense, other (expense) income, and special items. Our management team ordinarily excludes special items from its review of the results of the ongoing operations. Special items is comprised of (i) cost of revenue efficiency initiatives which include costs incurred as we transition between major vehicle programs, cost incurred for negotiations with major suppliers regarding changing demand forecasts or design modifications, and other costs for enhancing capital and cost optimization of the Company (ii) restructuring expenses for significant actions taken by the Company, (iii) significant asset impairments and write- offs, and (iv) other items that we do not necessarily consider to be indicative of earnings from ongoing operating activities, including fair value gain or loss on convertible note, net, and joint venture formation expenses.

Adjusted net loss per share is defined as adjusted net loss divided by the weighted-average common shares outstanding.

Free cash flow is defined as net cash used in operating activities less capital expenditures.

is an American automotive technology company that develops and manufactures category-defining electric vehicles as well as vertically integrated technologies and offers a suite of value-added services. Through innovation across its electrical architecture, end-to-end software, autonomous driving platform, artificial intelligence, and propulsion, the company creates vehicles that excel at work and play with the goal of accelerating the global transition to zero-emission transportation and energy. Rivian vehicles are manufactured in the United States and are sold directly to consumer and commercial customers. Whether taking families on new adventures or electrifying fleets at scale, Rivian vehicles all share a common goal — preserving the natural world for generations to come.

Full text with the tables
                                                                                
              Rivian Releases Third Quarter 2026 Financial Results              
                                                                                
• Generated $2.155 billion in revenue, a 38 percent increase year-over-year

• Deliveries up 46 percent year-over-year with R2 already the best-selling
Rivian vehicle by volume, outselling both R1 and EDV in the third quarter

• Given Rivian’s strong performance, the company is improving 2026 guidance
across all metrics

Irvine, California, October 29, 2026: Rivian Automotive, Inc. (NASDAQ: RIVN), an
American automotive technology company that develops and manufactures category-
defining electric vehicles as well as vertically integrated technologies and
offers a suite of value-added services, today announced its third quarter 2026
financial results.

RJ Scaringe, Rivian Founder and CEO, said:

“We had great results with R2 becoming our best selling vehicle by volume in the
third quarter. Customer and media feedback on R2 has been exceptional. Regarding
our technology roadmap, our autonomy platform is progressing rapidly, and we are
super excited about Point to Point. We are laying the foundations for a future
that we believe will be fully electric, autonomous and AI defined. I could not
be more excited about the opportunity ahead for Rivian.”
                                                                                
  Business Highlights                                                           
                                                                                
Rivian achieved record production volumes in Normal, Illinois as it continued to
ramp R2 manufacturing. The company had record deliveries of 19,248 units with R2
delivering much of the gain quarter-over-quarter. R2 is already the best-selling
Rivian vehicle, outselling both R1 and EDV in the third quarter. R2 continues to
generate rave reviews and awards from the media and recently won Top Gear’s SUV
of the Year for 2027.

Rivian continues to innovate with software and AI. With the Rivian Assistant,
Rivian has developed a smarter and more customizable AI-defined vehicle
experience for R1 and R2 owners. In its October OTA (over-the-air) update, the
company added Gmail integration to Rivian Assistant and released the annual
“Halloween Mode.”

Rivian continues to see strong momentum in the company’s Autonomy+ offering,
which is available on every R2 and R1 starting with the 2025 model year. Today,
every vehicle with Autonomy+ is capable of Universal Hands-Free on millions of
miles of roads. Rivian’s next milestone is the company’s Point to Point feature.
This means customers will be able to enter an address while their vehicle
follows the route from start to finish, handling city streets, stop lights,
highway interchanges and everything in-between with driver supervision. A
limited rollout of Point to Point is expected to begin later this year via the
invitation-only Autonomy Early Access Program, with a general release to all
Autonomy+ subscribers expected in 2027. Rivian believes Point to Point
capabilities will be an important purchase criteria for customers and are
becoming a driver of market share. Additionally, last week, Rivian announced the
acquisition of Third Dimension AI to support its closed loop simulation efforts.
The company will share more at its Autonomy and AI Day on December 9.
                                                                                
  Third Quarter 2026 Results Summary                                            
                                                                                
                                                      
  Production and Deliveries                           
  •19,751 vehicles produced at Rivian’s               
  manufacturing facility in Normal, Illinois.         
  •19,248 vehicles delivered to customers.            
  Revenues                                            
  •Consolidated revenue was $2.155 billion, a 38      
  percent increase overthe same quarter of the prior  
  year. This was driven by a 46 percent               
  year-over-year increase in delivery volumes, $81    
  million in revenues related to regulatory credits,  
  and strong performance from the company’s software  
  and services segment.                               
  ◦Automotive revenue was $1.550 billion, a 36        
  percent increase overthe same quarter of the prior  
  year, primarily due to the increase in vehicle      
  deliveries and an $80 million increase in revenues  
  related to regulatory credits, which were           
  partially offset by a decline in average vehicle    
  selling price due to a higher mix of R2 and         
  commercial van deliveries.                          
  ◦Software and services revenue was $605 million, a  
  45 percent increase overthe same quarter of the     
  prior year, primarily due to increases in vehicle   
  electrical architecture and software development    
  services, vehicle repair and maintenance services,  
  and Autonomy+, partially offset by lower            
  remarketing sales. $354 million or 59 percent of    
  software and services revenue was attributable to   
  the company’s joint venture with Volkswagen Group.  
  Gross Profit                                        
  •Consolidated gross profit was $176 million, a      
  $152 million improvement overthe same quarter of    
  the prior year.                                     
  ◦Automotive gross profit loss for the third         
  quarter was $(80) millioncompared to$(130) million  
  inthe same quarter of the prior year, a $50         
  million improvementprimarily resulting from         
  increases in delivery volumes at an improved per    
  unit margin, an increase in revenues related to     
  regulatory credits, and an IEEPA tariff refund      
  receivable, partially offset by costs related to    
  the ramp of R2 production. In the quarter, Rivian   
  recognized approximately $120 million in            
  incremental cost of revenues due to the ramp of R2  
  production as compared to production at more        
  normalized levels.                                  
  ◦Software and servicesgross profitfor               
  thethirdquarter was $256 million,a 42 percent       
  margin and $102 million improvement overthe same    
  quarter of the prior year at$154 million,primarily  
  due to increases in vehicle electrical              
  architecture and software development services      
  from the joint venture with Volkswagen Group and    
  Autonomy+.                                          
  Operating Expenses and Operating Loss               
  •Total operating expenses in the third quarter      
  increased to $1.057 billion compared to $1.007      
  billion inthe same quarter of the prior year.       
  ◦Research and development (R&D) expenses were $485  
  million compared to $453 million inthe same         
  quarter of the prior year. The increase was         
  primarily driven by increases in software expenses  
  to support AI and autonomy initiatives,partially    
  offset by a reduction in engineering, design, and   
  development spend.                                  
  ◦Selling, general and administrative (SG&A)         
  expenses remained relatively consistent at $572     
  million compared to $554 million inthe same         
  quarter of the prior year.                          
  •For the third quarter, the company experienced a   
  loss from operations of $(881) million compared to  
  $(983) million inthe same quarter of the prior      
  year, a $102 million improvement.                   
                                                      
                                                      
  Adjusted Operating Expenses (non-GAAP)              
  •Total adjusted operating expenses for the third    
  quarter were $799 million compared to $783 million  
  forthe same quarter of the prior year.              
  ◦Adjusted R&D expenses for the third quarter were   
  $382 million compared to $361 million forthe same   
  quarter of the prior year.                          
  ◦Adjusted SG&A expenses for the third quarter were  
  $417 million compared to $422 million forthe same   
  quarter of the prior year.                          
  Net Loss                                            
  •Net loss attributable to common stockholders for   
  the third quarter was $(913) million compared to    
  $(1.173) billion forthe same quarter of the prior   
  year.                                               
  Adjusted EBITDA (non-GAAP)                          
  •Adjusted EBITDA for the third quarter was $(435)   
  million compared to $(602) million forthe same      
  quarter of the prior year.                          
  Net Cash Used in Operating Activities               
  •Net cash (used in) provided by operating           
  activities for the third quarter was $(758)         
  million, compared to $26 million forthe same        
  quarter of the prior year, primarily driven by a    
  change in cash used by working capital. Cash used   
  by working capital for the third quarter of 2026    
  was primarily driven by a reduction in deferred     
  revenues and a buildup of inventory purchases to    
  support the launch of R2.                           
  Adjusted Net Loss Per Share                         
  •Adjusted net loss per share for the third quarter  
  was $(0.48) compared to $(0.65) forthe same         
  quarter of the prior year.                          
  Capital Expenditures                                
  •Capital expenditures for the third quarter were    
  $(366) million, compared to $(447) million forthe   
  same quarter of the prior year.                     
  Liquidity and Free Cash Flow (non-GAAP)             
  •Rivian ended the third quarter with $5.502         
  billion in cash, cash equivalents, and short-term   
  investments.                                        
  ◦Including the capacity under its asset-based       
  revolving-credit facility, the company ended the    
  third quarter with $6.095 billion of total          
  liquidity, which, with the pro forma addition of    
  $1.000 billion received in October 2026 from the    
  non-recourse 10-year term loan facility from        
  Volkswagen Group, would be total available          
  liquidity of $7.095 billion.                        
  •Rivian defines free cash flow as net cash used in  
  operating activities less capital expenditures.     
  The net cash used by operating activities in the    
  third quarter partially offset by the decrease in   
  capital expenditures identified above resulted in   
  free cash flow of $(1,124) million compared to      
  $(421) million forthe same quarter of the prior     
  year.                                               
                                                      
                                                                                
  2026 Annual Guidance Summary                                                  
                                                                                
                                                                                
  •                                                                             
                                                                                
Full year delivery guidance is improving from 65,000 - 70,000 units to 67,000 -
70,000 units as a result of the production and delivery outlook for the fourth
quarter of 2026.
                                                                                
  •                                                                             
                                                                                
Adjusted EBITDA is improving by $100 million at the mid-point due to better than
expected revenue related to regulatory credits, an IEEPA tariff refund
receivable in the third quarter, and an expected increase in delivery volumes.

• Capital Expenditures are decreasing by $300 million at the mid-point due to
timing of spend.
                                               
                          Current Outlook      
  Vehicles Delivered      67,000 – 70,000      
  Adjusted EBITDA         $(1.85)B – $(1.75)B  
  Capital Expenditures    $1.40B – $1.50B      
                                               
Third Quarter 2026 Results Webcast and Replay Information

Rivian will host an audio webcast to discuss its results and provide a business
update at 2:00pm PT / 5:00pm ET on October 29, 2026. The link to the webcast and
shareholder presentation will be made available on the company’s Investor
Relations website at rivian.com/investors . After the call, a replay will be
available at rivian.com/investors for four weeks.
                                                  
  Quarterly Financial Performance                 
  (in millions, except production, delivery, and  
  gross margin)                                   
  (unaudited)                                     
                                                  
                                                                                
         Thr…  Sep…          Dec…          Mar…          June          Sep…     
         Mon…   30,           31,           31,           30,           30,     
         End…  2025          2025          2026          2026          2026     
 ────────────────────────────────────────────────────────────────────────────── 
  Pr…          10,…          10,…          10,…          12,…          19,…     
  De…          13,…          9,7…          10,…          12,…          19,…     
  Re…                                                                           
  Au…    $     1,1…       $   839       $   908       $  1,1…       $  1,5…     
  So…                                                                           
  and           416           447           473           515           605     
  se…                                                                           
  To…    $     1,5…       $  1,2…       $  1,3…       $  1,6…       $  2,1…     
  re…                                                                           
  Co…                                                                           
  of                                                                            
  re…                                                                           
  Au…    $     1,2…       $   898       $   970       $  1,1…       $  1,6…     
  So…                                                                           
  and           262           268           292           300           349     
  se…                                                                           
  To…                                                                           
  co…    $     1,5…       $  1,1…       $  1,2…       $  1,4…       $  1,9…     
  of                                                                            
  re…                                                                           
  Gr…    $       24       $   120       $   119       $   179       $   176     
  pr…                                                                           
  Gr…             2  %          9  %          9  %         11  %          8  %  
  ma…                                                                           
  Re…                                                                           
  and    $      453       $   424       $   458       $   466       $   485     
  de…                                                                           
  Se…                                                                           
  ge…           554           529           542           549           572     
  and                                                                           
  ad…                                                                           
  To…                                                                           
  op…    $     1,0…       $   953       $  1,0…       $  1,0…       $  1,0…     
  ex…                                                                           
  Ad…                                                                           
  re…                                                                           
  and    $      361       $   328       $   348       $   347       $   382     
  de…                                                                           
  (n…                                                                           
  Ad…                                                                           
  se…                                                                           
  ge…           422           384           392           384           417     
  and                                                                           
  ad…                                                                           
  (n…                                                                           
  To…                                                                           
  ad…                                                                           
  op…    $      783       $   712       $   740       $   731       $   799     
  ex…                                                                           
  (n…                                                                           
  Ad…                                                                           
  EB…    $     -602       $  -465       $  -472       $  -379       $  -435     
  (n…                                                                           
  Ca…                                                                           
  ca…                                                                           
  eq…    $     7,0…       $  6,0…       $  4,8…       $  5,3…       $  5,5…     
  and                                                                           
  sh…                                                                           
  in…                                                                           
  Net                                                                           
  ca…                                                                           
  pr…                                                                           
  by     $       26       $  -681       $  -703       $  -487       $  -758     
  (u…                                                                           
  in)                                                                           
  op…                                                                           
  ac…                                                                           
  Ca…          -447          -463          -372          -362          -366     
  ex…                                                                           
  Fr…                                                                           
  ca…    $     -421       $  -1,…       $  -1,…       $  -849       $  -1,…     
  fl…                                                                           
  (n…                                                                           
  De…                                                                           
  and                                                                           
  am…                                                                           
  ex…                                                                           
  Co…                                                                           
  of     $      125       $   108       $   122       $   138       $   166     
  re…                                                                           
  Re…                                                                           
  and            18            20            23            25            24     
  de…                                                                           
  Se…                                                                           
  ge…            55            59            57            64            61     
  and                                                                           
  ad…                                                                           
  To…                                                                           
  de…                                                                           
  and    $      198       $   187       $   202       $   227       $   251     
  am…                                                                           
  ex…                                                                           
  St…                                                                           
  co…                                                                           
  ex…                                                                           
  Co…                                                                           
  of     $       24       $    26       $    27       $    31       $    28     
  re…                                                                           
  Re…                                                                           
  and            74            76            87            94            79     
  de…                                                                           
  Se…                                                                           
  ge…            77            86            93           101            94     
  and                                                                           
  ad…                                                                           
  To…                                                                           
  st…    $      175       $   188       $   207       $   226       $   201     
  co…                                                                           
  ex…                                                                           
  ¹A                                                                            
  re…                                                                           
  of                                                                            
  no…                                                                           
  fi…                                                                           
  me…                                                                           
  to                                                                            
  the                                                                           
  mo…                                                                           
  co…                                                                           
  GA…                                                                           
  me…                                                                           
  is                                                                            
  pr…                                                                           
  la…                                                                           
  in                                                                            
  th…                                                                           
  pr…                                                                           
                                                                                
                                           
  Condensed Consolidated Balance Sheets1   
  (in millions, except per share amounts)  
  (unaudited)                              
                                           
                                                                                
                         Assets     December 31, 2025       September 30, 2026  
 ────────────────────────────────────────────────────────────────────────────── 
  Current assets:                                                               
  Cash and cash                  $              3,579    $               3,509  
  equivalents                                                                   
  Short-term                                    2,503                    1,993  
  investments                                                                   
  Accounts receivable,                            555                      596  
  net                                                                           
  Inventory                                     1,594                    1,779  
  Other current assets                            361                      259  
  Total current assets                          8,592                    8,136  
  Property, plant, and                          5,119                    5,605  
  equipment, net                                                                
  Operating lease                                 571                      778  
  assets, net                                                                   
  Strategic investments                           119                      682  
  Other non-current                               463                      526  
  assets                                                                        
  Total assets                   $             14,864    $              15,727  
  Liabilities and                                                               
  Stockholders’ Equity                                                          
  Current liabilities:                                                          
  Accounts payable               $                595    $               1,038  
  Accrued liabilities                           1,438                    1,104  
  Current portion of                                                            
  deferred revenues,                            1,660                    1,598  
  lease liabilities,                                                            
  and other liabilities                                                         
  Total current                                 3,693                    3,740  
  liabilities                                                                   
  Long-term debt                                4,440                    4,446  
  Non-current lease                               551                      764  
  liabilities                                                                   
  Other non-current                             1,586                    1,059  
  liabilities                                                                   
  Total liabilities                            10,270                   10,009  
  Commitments and                                                               
  contingencies                                                                 
  Stockholders' equity:                                                         
  Preferred stock,                                                              
  $0.001 par value; 10                                                          
  shares authorized and                                                         
  0 shares issued                                   —                        —  
  and outstanding as of                                                         
  December 31, 2025                                                             
  and September 30,                                                             
  2026                                                                          
  Common stock, $0.001                                                          
  par value; 5,258                                                              
  and 5,258 shares                                                              
  authorized and 1,240                                                          
  and 1,460 shares                                                              
  issued and                                        1                        1  
  outstanding                                                                   
  as of December 31,                                                            
  2025 and September                                                            
  30, 2026,                                                                     
  respectively                                                                  
  Additional paid-in                           31,508                   34,806  
  capital                                                                       
  Accumulated deficit                         -26,951                  -29,113  
  Accumulated other                                                             
  comprehensive income                              8                       -3  
  (loss)                                                                        
  Noncontrolling                                   28                       27  
  interest                                                                      
  Total stockholders'                           4,594                    5,718  
  equity                                                                        
  Total liabilities and                                                         
  stockholders'                  $             14,864    $              15,727  
  equity                                                                        
  1The prior period has                                                         
  been recast to                                                                
  conform to current                                                            
  period presentation.                                                          
                                                                                
                                                   
  Condensed Consolidated Statements of Operations  
  (in millions, except per share amounts)          
  (unaudited)                                      
                                                   
                                                                                
          Th…                        Ni…                                        
          Mo…                        Mo…                                        
          En…                        En…                                        
          Se…                        Se…                                        
          30,  20…              20…  30,         20…              20…           
 ────────────────────────────────────────────────────────────────────────────── 
  A…           $    1,…         $    1,…         $    2,…         $    3…       
  S…                                                                            
  a…                416              605              1,…              1…       
  s…                                                                            
  T…                1,…              2,…              4,…              5…       
  r…                                                                            
  A…                1,…              1,…              3,…              3…       
  S…                                                                            
  a…                262              349              713              9…       
  s…                                                                            
  T…                                                                            
  c…                1,…              1,…              4,…              4…       
  of                                                                            
  r…                                                                            
  G…                 24              176               24              4…       
  p…                                                                            
  O…                                                                            
  e…                                                                            
  R…                                                                            
  a…                453              485              1,…              1…       
  d…                                                                            
  S…                                                                            
  g…                554              572              1,…              1…       
  a…                                                                            
  a…                                                                            
  T…                                                                            
  o…                1,…              1,…              2,…              3…       
  e…                                                                            
  L…                                                                            
  f…                -9…              -8…              -2…              -…       
  o…                                                                            
  I…                 76               55              229              1…       
  i…                                                                            
  I…                -69              -74              -2…              -…       
  e…                                                                            
  O…                                                                            
  (…                -1…               -8              -86              4…       
  i…                                                                            
  n…                                                                            
  L…                                                                            
  b…                -1…              -9…              -2…              -…       
  i…                                                                            
  t…                                                                            
  P…                                                                            
  f…                  1                1               -3               4       
  i…                                                                            
  t…                                                                            
  N…                -1…              -9…              -2…              -…       
  l…                                                                            
  L…                                                                            
  N…                                                                            
  i…                                                                            
  a…                  7                6               13               2       
  to                                                                            
  n…                                                                            
  i…                                                                            
  N…                                                                            
  l…                                                                            
  a…           $    -1…         $    -9…         $    -2…         $    -…       
  to                                                                            
  c…                                                                            
  s…                                                                            
  N…                                                                            
  l…                                                                            
  a…                                                                            
  to                                                                            
  c…           $    -1…         $    -9…         $    -2…         $    -…       
  s…                                                                            
  b…                                                                            
  a…                                                                            
  d…                                                                            
  N…                                                                            
  l…                                                                            
  p…                                                                            
  s…                                                                            
  a…                                                                            
  to                                                                            
  C…                                                                            
  A            $    -0…         $    -0…         $    -2…         $    -…       
  a…                                                                            
  C…                                                                            
  B                                                                             
  c…                                                                            
  s…                                                                            
  b…                                                                            
  a…                                                                            
  d…                                                                            
  W…                                                                            
  c…                                                                            
  s…                                                                            
  o…                     1,…              1,…              1,…             1,…  
  b…                                                                            
  a…                                                                            
  d…                                                                            
  1…                                                                            
  t…                                                                            
  n…                                                                            
  m…                                                                            
  e…                                                                            
  S…                                                                            
  3…                                                                            
  2…                                                                            
  we                                                                            
  r…                                                                            
  a                                                                             
  $…                                                                            
  m…                                                                            
  g…                                                                            
  in                                                                            
  "…                                                                            
  (…                                                                            
  i…                                                                            
  n…                                                                            
  r…                                                                            
  to                                                                            
  t…                                                                            
  S…                                                                            
  A                                                                             
  c…                                                                            
  r…                                                                            
  a…                                                                            
  r…                                                                            
  d…                                                                            
  of                                                                            
  M…                                                                            
  R…                                                                            
                                                                                
                                                    
  Condensed Consolidated Statements of Cash Flows1  
  (in millions)                                     
  (unaudited)                                       
                                                    
                                                                                
                              Nine Months Ended                                 
  Cash flows from             September 30,                                     
  operating activities:       2025                                2026          
 ────────────────────────────────────────────────────────────────────────────── 
  Net loss                    $                         -2,822    $     -2,160  
  Depreciation and                                         583             682  
  amortization                                                                  
  Stock-based compensation                                 551             634  
  expense                                                                       
  Gain on strategic                                       -101            -506  
  investments                                                                   
  Other non-cash                                            -6              89  
  activities                                                                    
  Changes in operating                                                          
  assets and                                                                    
  liabilities:                                                                  
  Accounts receivable, net                                 267             -44  
  Inventory                                                511            -372  
  Other assets                                             -26             144  
  Accounts payable and                                     488             268  
  accrued liabilities                                                           
  Deferred revenues                                        495            -637  
  Other liabilities                                        -38             -46  
  Net cash used in                                         -98          -1,948  
  operating activities                                                          
  Cash flows from                                                               
  investing activities:                                                         
  Purchases of short-term                                                       
  investments and                                       -2,571          -2,045  
  shares for deferred                                                           
  compensation                                                                  
  Sales of short-term                                                           
  investments and                                          107              32  
  shares for deferred                                                           
  compensation                                                                  
  Maturities of short-term                               2,204           2,463  
  investments                                                                   
  Deconsolidation of Mind                                    —            -114  
  Robotics, Inc.                                                                
  Capital expenditures                                  -1,247          -1,100  
  Net cash used in                                      -1,507            -764  
  investing activities                                                          
  Cash flows from                                                               
  financing activities:                                                         
  Proceeds from                                                                 
  stock-based compensation    $                             34    $         40  
  programs                                                                      
  Proceeds from issuance                                   750           2,617  
  of capital stock                                                              
  Proceeds from issuance                                 1,250               —  
  of long-term debt                                                             
  Repayments of long-term                               -1,250               —  
  debt                                                                          
  Other financing                                          -37             -11  
  activities                                                                    
  Net cash provided by                                                          
  financing                                                747           2,646  
  activities                                                                    
  Effect of exchange rate                                                       
  changes on cash                                            5              -4  
  and cash equivalents                                                          
  Net change in cash                                      -853             -70  
  Cash and cash                                                                 
  equivalents, and                                       5,294           3,579  
  restricted cash -                                                             
  Beginning of period                                                           
  Cash and cash                                                                 
  equivalents, and            $                          4,441    $      3,509  
  restricted cash - End of                                                      
  period                                                                        
  Supplemental disclosure                                                       
  of non-cash                                                                   
  investing and financing                                                       
  activities:                                                                   
  Capital expenditures                                                          
  included in                 $                            499    $        386  
  liabilities                                                                   
  Capital stock issued to     $                             47    $        110  
  settle bonuses                                                                
  Right-of-use assets                                                           
  obtained in exchange        $                            224    $        302  
  for operating lease                                                           
  liabilities                                                                   
  1The prior period has                                                         
  been recast to                                                                
  conform to current                                                            
  period presentation.                                                          
                                                                                
                              
  Reconciliation of Non-GAAP  
  Financial Measures          
  (in millions)               
  (unaudited)                 
                              
                                                                                
           Three   Septe…       Decem…        March          June       Septe…  
           Months     30,          31,          31,           30,          30,  
           Ended     2025         2025         2026          2026         2026  
 ────────────────────────────────────────────────────────────────────────────── 
  Adju…                                                                         
  Rese…                                                                         
  and                                                                           
  Deve…                                                                         
  Expe…                                                                         
  Total                                                                         
  rese…                                                                         
  and      $          453    $     424    $     458    $      466    $     485  
  deve…                                                                         
  expe…                                                                         
  R&D                                                                           
  depr…                                                                         
  and                 -18          -20          -23           -25          -24  
  amor…                                                                         
  expe…                                                                         
  R&D                                                                           
  stoc…               -74          -76          -87           -94          -79  
  comp…                                                                         
  expe…                                                                         
  Adju…                                                                         
  rese…                                                                         
  and      $          361    $     328    $     348    $      347    $     382  
  deve…                                                                         
  (non…                                                                         
  Adju…                                                                         
  Sell…                                                                         
  Gene…                                                                         
  and                                                                           
  Admi…                                                                         
  Expe…                                                                         
  Total                                                                         
  sell…                                                                         
  gene…    $          554    $     529    $     542    $      549    $     572  
  and                                                                           
  admi…                                                                         
  expe…                                                                         
  SG&A                                                                          
  depr…                                                                         
  and                 -55          -59          -57           -64          -61  
  amor…                                                                         
  expe…                                                                         
  SG&A                                                                          
  stoc…               -77          -86          -93          -101          -94  
  comp…                                                                         
  expe…                                                                         
  Adju…                                                                         
  sell…                                                                         
  gene…    $          422    $     384    $     392    $      384    $     417  
  and                                                                           
  admi…                                                                         
  (non…                                                                         
  Adju…                                                                         
  Oper…                                                                         
  Expe…                                                                         
  Total                                                                         
  oper…    $        1,007    $     953    $   1,000    $    1,015    $   1,057  
  expe…                                                                         
  R&D                                                                           
  depr…                                                                         
  and                 -18          -20          -23           -25          -24  
  amor…                                                                         
  expe…                                                                         
  R&D                                                                           
  stoc…               -74          -76          -87           -94          -79  
  comp…                                                                         
  expe…                                                                         
  SG&A                                                                          
  depr…                                                                         
  and                 -55          -59          -57           -64          -61  
  amor…                                                                         
  expe…                                                                         
  SG&A                                                                          
  stoc…               -77          -86          -93          -101          -94  
  comp…                                                                         
  expe…                                                                         
  Total                                                                         
  adju…                                                                         
  oper…    $          783    $     712    $     740    $      731    $     799  
  expe…                                                                         
  (non…                                                                         
  Adju…                                                                         
  EBIT…                                                                         
  Net                                                                           
  loss                                                                          
  attr…    $       -1,173    $    -811    $    -416    $     -833    $    -913  
  to                                                                            
  comm…                                                                         
  stoc…                                                                         
  Inte…                                                                         
  (inc…                -7            —           15            20           19  
  expe…                                                                         
  net                                                                           
  Prov…                                                                         
  for                  -1            3           -2            -1           -1  
  inco…                                                                         
  taxes                                                                         
  Depr…                                                                         
  and                 198          187          202           227          251  
  amor…                                                                         
  Stoc…                                                                         
  comp…               175          188          207           226          201  
  expe…                                                                         
  Other                                                                         
  expe…               191          -32         -478           -18            8  
  (inc…                                                                         
  net¹                                                                          
  Rest…                15            —            —             —            —  
  expe…                                                                         
  Adju…                                                                         
  EBIT…    $         -602    $    -465    $    -472    $     -379    $    -435  
  (non…                                                                         
  1Dur…                                                                         
  the                                                                           
  nine                                                                          
  mont…                                                                         
  ended                                                                         
  Sept…                                                                         
  30,                                                                           
  2026,                                                                         
  we                                                                            
  reco…                                                                         
  a                                                                             
  $506                                                                          
  mill…                                                                         
  gain                                                                          
  in                                                                            
  "Oth…                                                                         
  (exp…                                                                         
  inco…                                                                         
  net"                                                                          
  on                                                                            
  the                                                                           
  Cond…                                                                         
  Cons…                                                                         
  Stat…                                                                         
  of                                                                            
  Oper…                                                                         
  rela…                                                                         
  to                                                                            
  the                                                                           
  Seri…                                                                         
  A                                                                             
  capi…                                                                         
  raise                                                                         
  and                                                                           
  rela…                                                                         
  deco…                                                                         
  of                                                                            
  Mind                                                                          
  Robo…                                                                         
                                                                                
                                           
  Quarterly Financial Performance          
  Reconciliation of Non-GAAP               
  Financial Measures Continued             
  (in millions, except per share amounts)  
  (unaudited)                              
                                           
                                                                                
          Thr…  Sept…       Dec…          March          June       Sept…       
          Mon…    30,        31,            31,           30,         30,       
          End…   2025       2025           2026          2026        2026       
 ────────────────────────────────────────────────────────────────────────────── 
  Adj…                                                                          
  Net                                                                           
  Loss                                                                          
  Net                                                                           
  loss                                                                          
  att…                                                                          
  to                                                                            
  com…    $     -1,1…    $  -811       $   -416       $  -833    $   -913       
  sto…                                                                          
  bas…                                                                          
  and                                                                           
  dil…                                                                          
  Sto…                                                                          
  com…            175        188            207           226         201       
  exp…                                                                          
  Oth…                                                                          
  exp…            191        -32           -478           -18           8       
  (in…                                                                          
  net¹                                                                          
  Res…             15          —              —             —           —       
  exp…                                                                          
  Adj…                                                                          
  net                                                                           
  loss                                                                          
  att…                                                                          
  to                                                                            
  com…    $      -792    $  -655       $   -687       $  -625    $   -704       
  sto…                                                                          
  bas…                                                                          
  and                                                                           
  dil…                                                                          
  (no…                                                                          
  Adj…                                                                          
  Net                                                                           
  Loss                                                                          
  Per                                                                           
  Sha…                                                                          
  Net                                                                           
  loss                                                                          
  per                                                                           
  sha…                                                                          
  att…                                                                          
  to      $     -0.96    $  -0.…       $  -0.33       $  -0.…    $  -0.63       
  com…                                                                          
  sto…                                                                          
  bas…                                                                          
  and                                                                           
  dil…                                                                          
  Sto…                                                                          
  com…                                                                          
  exp…           0.14       0.15           0.17          0.17        0.14       
  per                                                                           
  sha…                                                                          
  Oth…                                                                          
  exp…                                                                          
  (in…           0.16       -0.…          -0.38          -0.…        0.01       
  net                                                                           
  per                                                                           
  sha…                                                                          
  Res…                                                                          
  exp…           0.01          —              —             —           —       
  per                                                                           
  sha…                                                                          
  Adj…                                                                          
  net                                                                           
  loss                                                                          
  per                                                                           
  sha…                                                                          
  att…                                                                          
  to      $     -0.65    $  -0.…    *  $  -0.54    *  $  -0.…    $  -0.48    *  
  com…                                                                          
  sto…                                                                          
  bas…                                                                          
  and                                                                           
  dil…                                                                          
  (no…                                                                          
  Wei…                                                                          
  com…                                                                          
  sha…                                                                          
  out…          1,220       1,2…          1,249          1,3…       1,446       
  bas…                                                                          
  and                                                                           
  dil…                                                                          
  (GA…                                                                          
  *                                                                             
  Does                                                                          
  not                                                                           
  cal…                                                                          
  due                                                                           
  to                                                                            
  rou…                                                                          
  Free                                                                          
  Cash                                                                          
  Flow                                                                          
  Net                                                                           
  cash                                                                          
  pro…                                                                          
  by      $        26    $  -681       $   -703       $  -487    $   -758       
  (us…                                                                          
  in)                                                                           
  ope…                                                                          
  act…                                                                          
  Cap…           -447       -463           -372          -362        -366       
  exp…                                                                          
  Free                                                                          
  cash    $      -421    $  -1,…       $  -1,0…       $  -849    $  -1,1…       
  flow                                                                          
  (no…                                                                          
  1Du…                                                                          
  the                                                                           
  nine                                                                          
  mon…                                                                          
  end…                                                                          
  Sep…                                                                          
  30,                                                                           
  202…                                                                          
  we                                                                            
  rec…                                                                          
  a                                                                             
  $506                                                                          
  mil…                                                                          
  gain                                                                          
  in                                                                            
  "Ot…                                                                          
  (ex…                                                                          
  inc…                                                                          
  net"                                                                          
  on                                                                            
  the                                                                           
  Con…                                                                          
  Con…                                                                          
  Sta…                                                                          
  of                                                                            
  Ope…                                                                          
  rel…                                                                          
  to                                                                            
  the                                                                           
  Ser…                                                                          
  A                                                                             
  cap…                                                                          
  rai…                                                                          
  and                                                                           
  rel…                                                                          
  dec…                                                                          
  of                                                                            
  Mind                                                                          
  Rob…                                                                          
                                                                                
Forward Looking Statements:

This press release and statements that are made on our earnings call contain
forward-looking statements within the meaning of the Private Securities
Litigation Reform Act of 1995. All statements contained in this press release
and made on our earnings call that do not relate to matters of historical fact
should be considered forward-looking statements, including without limitation
statements regarding our future operations, initiatives and business strategy,
including our future financial results, liquidity, vehicle profitability and
future gross profits, our future capital expenditures and R&D investments, the
underlying trends in our business (including customer preferences and
expectation), macroeconomic and policy conditions, including changes to
applicable tariffs and to the availability of government and economic
incentives, including tax credits, for electric vehicles, our market
opportunity, and our potential for growth, our production ramp and manufacturing
capacity expansion and anticipated production levels, the timeline for the
construction activity at the Georgia plant, the timeline for drawing on our
Department of Energy Loan, our expected future production and deliveries, our
expected future products and technology and product enhancements, including
enhanced performance features and pricing (including the timing of launches and
customer deliveries), our roadmap and timeline for the release of our next-
generation vehicle autonomy systems, hardware, and software architecture
underpinned by artificial intelligence, including LDM, Rivian Assistant,
Universal Hands-Free, RUI, and Point to Point, future revenue opportunities,
including with respect to the emerging autonomous driving market, our joint
venture with Volkswagen Group, including the expected benefits from the
partnership and future Volkswagen Group investments, our partnership with Uber
Technologies, Inc., including the expected benefits from the partnership and
future Uber investments, the achievement of certain milestones and regulatory
approvals, the expected benefits of the Third Dimension AI acquisition, and
expected benefits from partnerships with other third parties. These statements
are neither promises nor guarantees and involve known and unknown risks,
uncertainties, and other important factors that may cause our actual results,
performance, or achievements to be materially different from any future results,
performance, or achievements expressed or implied by the forward-looking
statements, including, but not limited to: our history of losses as a growth-
stage company and our limited operating history; we may underestimate or not
effectively manage the cost of revenues, operating expenses, and capital
expenditures associated with our business and operations; that we will require
additional financings to raise capital to support our business; our ability to
attract and retain a large number of consumers and maintain strong demand for
our vehicles, software and services; the highly competitive automotive and
software and services markets in which we operate; demand for and consumers’
willingness to adopt electric vehicles; that our long-term results depend upon
our ability to successfully introduce, integrate and market new products and
services; that we have experienced and may in the future experience significant
delays in the manufacture and delivery of our vehicles; risks associated with
the development of complex software and hardware in coordination with our joint
venture with Volkswagen Group and our other vendors and suppliers; risks
associated with our joint venture with Volkswagen Group; risks associated with
additional strategic alliances or acquisitions; we have experienced and could
experience in the future cost increases and disruptions in supply of raw
materials, components, or equipment used to produce our vehicles; our dependence
on establishing and maintaining relationships with vendors and suppliers; our
ability to accurately estimate the supply and demand for our vehicles and
predict our manufacturing requirements; our ability to scale our business and
manage future growth effectively; our ability to maintain our relationship with
one customer that has generated a significant portion of our revenues; that we
are highly dependent on the services and reputation of our Founder and Chief
Executive Officer; the unavailability, reduction or elimination of government
and economic incentives and credits for electric vehicles; that we may not be
able to obtain or agree on acceptable terms and conditions for all or a
significant portion of the government grants, loans, and other incentives,
including regulatory credits, for which we apply or are approved for; risks

associated with breaches in data security, failure of technology systems, cyber-
attacks or other security or privacy-related incidents; risk of intellectual
property infringement claims; effect of trade tariffs or other trade barriers;
effects of export and import control laws; risks related to motor vehicle safety
standards; delays, limitations and risks related to permits and other approvals
required to build, operate or expand operations including the construction and
development of facilities to support R2; and the other factors described in our
filings with the SEC. These factors could cause actual results to differ
materially from those indicated by the forward-looking statements made in this
press release. Any such forward-looking statements represent management’s
estimates as of the date of this press release. While we may elect to update
such forward-looking statements at some point in the future, except as may be
required by law, we disclaim any obligation to do so, even if subsequent events
cause our views to change.

*Non-GAAP Financial Measures

In addition to our results determined in accordance with generally accepted
accounting principles in the United States (“GAAP”), we review financial
measures that are not calculated and presented in accordance with GAAP (“non-
GAAP financial measures”). We believe our non-GAAP financial measures are useful
in evaluating our operating performance. We use the following non-GAAP financial
information, collectively, to evaluate our ongoing operations and for internal
planning and forecasting purposes. We believe that non-GAAP financial
information, when taken collectively, may be helpful to investors, because it
focuses on underlying operating results and trends, provides consistency and
comparability with past financial performance, and assists in comparisons with
other companies, some of which use similar non-GAAP financial information to
supplement their GAAP results. The non-GAAP financial information is presented
for supplemental informational purposes only, should not be considered a
substitute for financial information presented in accordance with GAAP, and may
be different from similarly titled non-GAAP measures used by other companies. A
reconciliation of each historical non-GAAP financial measure to the most
directly comparable financial measure stated in accordance with GAAP is provided
above. Reconciliations of forward- looking non-GAAP financial measures are not
provided because we are unable to provide such reconciliations without
unreasonable effort due to the uncertainty regarding, and potential variability
of, certain items, such as stock-based compensation expense and other costs and
expenses that may be incurred in the future. Investors are encouraged to review
the related GAAP financial measures and the reconciliation of these non-GAAP
financial measures to their most directly comparable GAAP financial measures.

Our non-GAAP financial measures include adjusted research and development
expenses, adjusted selling, general, and administrative expenses, total adjusted
operating expenses, adjusted EBITDA, adjusted net loss, adjusted net loss per
share, and free cash flow.

Adjusted research and development expenses is defined as total research and
development expenses, less R&D depreciation and amortization expenses and R&D
stock-based compensation expenses.

Adjusted selling, general, and administrative expenses is defined as total
selling, general, and administrative expenses, less SG&A depreciation and
amortization expenses and SG&A stock-based compensation expenses.

Adjusted operating expenses is defined as total operating expenses, less R&D
depreciation and amortization expenses, R&D stock-based compensation expenses,
SG&A depreciation and amortization expenses, and SG&A stock-based compensation
expenses.

Adjusted EBITDA is defined as net loss before interest expense (income), net,
provision for income taxes, depreciation and amortization, stock-based
compensation, other expense (income), net, and special items. Our management
team ordinarily excludes special items from its review of the results of the
ongoing operations. Special items is comprised of (i) cost of revenue efficiency
initiatives which include costs incurred as we transition between major vehicle
programs, cost incurred for negotiations with major suppliers regarding changing
demand forecasts or design modifications, and other costs for enhancing capital
and cost optimization of the Company (ii) restructuring expenses for significant
actions taken by the Company, (iii) significant asset impairments and write-
offs, and (iv) other items that we do not necessarily consider to be indicative
of earnings from ongoing operating activities, including fair value gain or loss
on convertible note, net, and joint venture formation expenses.

Adjusted net loss is defined as net loss before stock-based compensation
expense, other (expense) income, and special items. Our management team
ordinarily excludes special items from its review of the results of the ongoing
operations. Special items is comprised of (i) cost of revenue efficiency
initiatives which include costs incurred as we transition between major vehicle
programs, cost incurred for negotiations with major suppliers regarding changing
demand forecasts or design modifications, and other costs for enhancing capital
and cost optimization of the Company (ii) restructuring expenses for significant
actions taken by the Company, (iii) significant asset impairments and write-
offs, and (iv) other items that we do not necessarily consider to be indicative
of earnings from ongoing operating activities, including fair value gain or loss
on convertible note, net, and joint venture formation expenses.

Adjusted net loss per share is defined as adjusted net loss divided by the
weighted-average common shares outstanding.

Free cash flow is defined as net cash used in operating activities less capital
expenditures.

About Rivian:
                                                                                
  Rivian (NASDAQ: RIVN)                                                         
                                                                                
is an American automotive technology company that develops and manufactures
category-defining electric vehicles as well as vertically integrated
technologies and offers a suite of value-added services. Through innovation
across its electrical architecture, end-to-end software, autonomous driving
platform, artificial intelligence, and propulsion, the company creates vehicles
that excel at work and play with the goal of accelerating the global transition
to zero-emission transportation and energy. Rivian vehicles are manufactured in
the United States and are sold directly to consumer and commercial customers.
Whether taking families on new adventures or electrifying fleets at scale,
Rivian vehicles all share a common goal — preserving the natural world for
generations to come.

Contacts:

Investors: [email protected]

Media: Harry Porter, [email protected]

Sources

The 8-K item 2.02 filings (SEC EDGAR) and their EX-99 exhibits: the results release and, when filed, prepared remarks or the call transcript.

Also

Said vs did: the targets in these releases against what was then reported. Filings: every filing.

Work with it

Excel workbook · CSV. Google Sheet that stays up to date: paste =IMPORTDATA("https://tickdelta.com/company/RIVN/export.csv") into a cell.

Next:Presentations
Esc

Type a ticker such as AAPL, a name, an investor such as Buffett, or a topic such as tariffs. ↑ ↓ to move, Enter to open.