RPM International Inc RPM
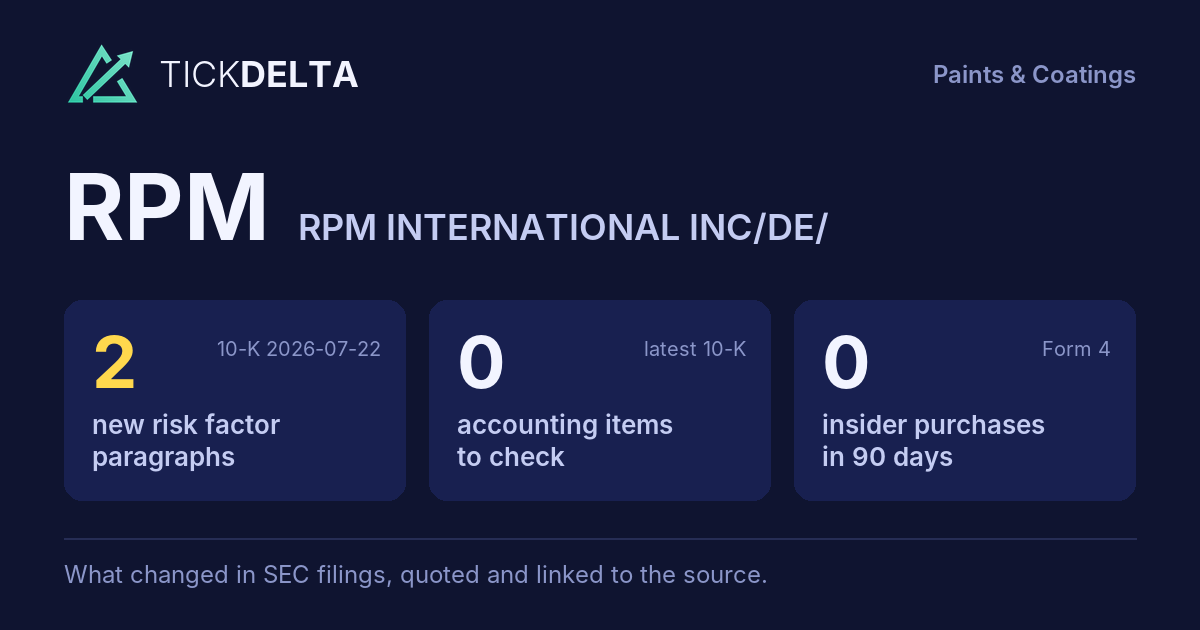
The biggest changes in the 10-K filed Jul 22, 2026, in management's words
10-K, Item 7This fiscal year against the last, and the sentences in the MD&A where management explains each change. Tickdelta picks sentences that name the line, a direction and a cause. It does not write explanations of its own.
Cash from operations
Big change, FY to May 31, 2026 vs May 31, 2025
The MD&A has no sentence that names a cause for this change.
Revenue
Change, FY to May 31, 2026 vs May 31, 2025
“Our PCG segment generated organic sales growth during fiscal 2026 when compared to the prior year, driven by growth in turnkey flooring solutions serving high-performance buildings, protective coatings, fireproofing coatings, food industry coatings and solutions, and specialty OEM coatings, along with strong demand in India and the Middle East.”
Read it in the 10-K
“Our Consumer segment experienced organic sales declines in fiscal 2026 due to softness in DIY and European markets, product rationalization, and weak demand in our Color Group, partially offset by improved pricing to recover cost inflation.”
Read it in the 10-K
Net income
Change, FY to May 31, 2026 vs May 31, 2025
The MD&A has no sentence that names a cause for this change.
Gross margin
Change, FY to May 31, 2026 vs May 31, 2025
The MD&A has no sentence that names a cause for this change.
What management said, year by year
The cause given in each 10-K, 2 fiscal years, newest first · MD&A (Item 7)
Each bar is how the line changed that year (from the same 10-K's XBRL). Under it, the sentence in that year's MD&A that names the line, a direction and a cause, word for word. A year with no sentence says so.
Revenue
2 of 2 years explained-
FY 2026 +6.7%
“Our PCG segment generated organic sales growth during fiscal 2026 when compared to the prior year, driven by growth in turnkey flooring solutions serving high-performance buildings, protective coatings, fireproofing coatings, food industry coatings and solutions, and specialty OEM coatings, along with strong demand in India and the Middle East.”
Read it in the FY 2026 10-K“Our Consumer segment experienced organic sales declines in fiscal 2026 due to softness in DIY and European markets, product rationalization, and weak demand in our Color Group, partially offset by improved pricing to recover cost inflation.”
Read it in the FY 2026 10-K -
FY 2025 +0.5%
“Our CPG segment generated organic sales growth during fiscal 2025, led by systems and turnkey roofing solutions serving high-performance buildings, which benefited from its restoration project focus, direct sales model, and high growth in the service business.”
Read it in the FY 2025 10-K“Our Consumer segment experienced organic sales declines in fiscal 2025 driven by reduced DIY takeaway at retail, customer destocking and the rationalization of certain lower-margin products.”
Read it in the FY 2025 10-K
Gross margin
1 of 2 years explained-
FY 2026 +0.1 pts
The FY 2026 MD&A has no sentence that names a cause for this change.
-
FY 2025 +0.3 pts
“This gross profit margin increase of approximately 30 basis points ("bps") resulted primarily from our MAP 2025 initiatives, which generated incremental savings in procurement, manufacturing and commercial excellence that favorably impacted our gross margin, partially offset by reduced fixed-cost absorption due to lower production volumes, and additional costs incurred due to MAP 2025-enabled plant consolidations; labor inflation, tariff-related impacts and unfavorable sales mix.”
Read it in the FY 2025 10-K
Net income
0 of 2 years explained-
FY 2026 -4.0%
The FY 2026 MD&A has no sentence that names a cause for this change.
-
FY 2025 +17.0%
The FY 2025 MD&A has no sentence that names a cause for this change.
Cash from operations
0 of 2 years explained-
FY 2026 +17.0%
The FY 2026 MD&A has no sentence that names a cause for this change.
-
FY 2025 -31.6%
The FY 2025 MD&A has no sentence that names a cause for this change.
Changes are computed from the XBRL figures in the same 10-K. Hover a number to see the line item. Open the 10-K
Sources
The Management's Discussion and Analysis (Item 7) of the latest 10-K, quoted word for word; the changes are computed from the same 10-K's XBRL.
Also
Financials: the numbers year by year.
Work with it
Excel workbook · CSV. Google Sheet that stays up to date: paste =IMPORTDATA("https://tickdelta.com/company/RPM/export.csv") into a cell.