Paragraph 82 · 45% changed
Every version of it
Screener
/
SEC EDGAR
/CIK 0000861884
/10-K filed Feb 26, 2026, compared with Feb 27, 2025
/Numbers from the XBRL of the 10-Ks
NYSE
Industrials · Metals Service Centers & of fices
Reliance, Inc. RS
The 10-K against last year's
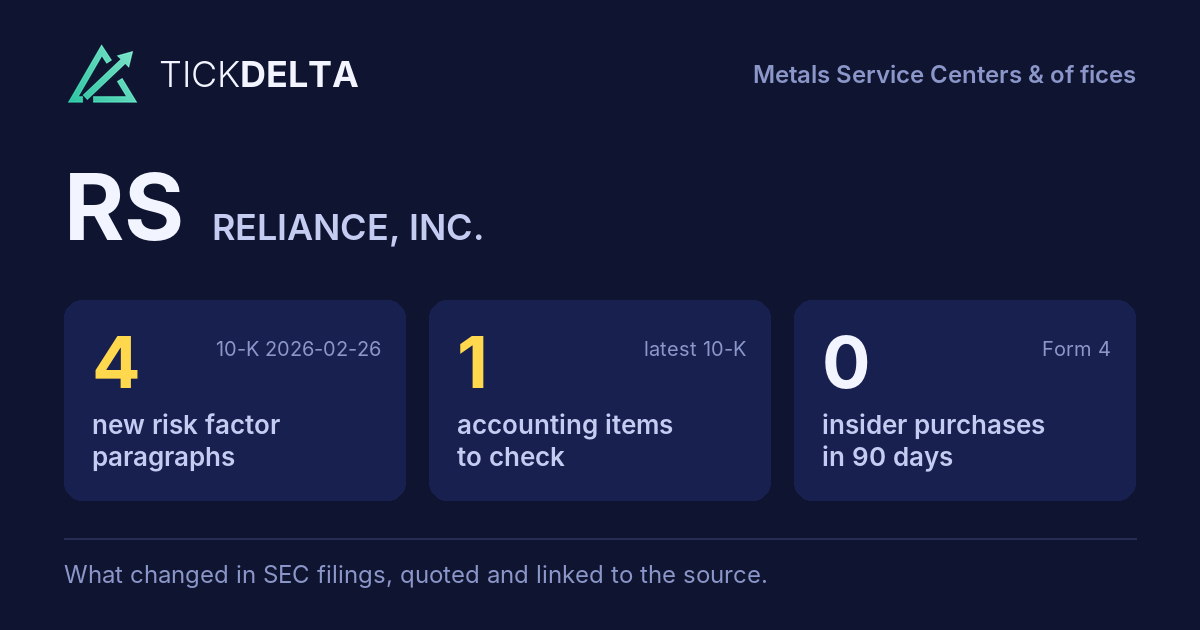
107 changes: 23 added, 33 removed, 51 reworded
10-K Feb 26, 2026 vs Feb 27, 2025
Risk Factors
12.9%
of the text changed · 7,500 words now · 4 new paragraphs, 6 gone
MD&A
39.3%
of the text changed · 4,329 words now · 19 new paragraphs, 27 gone
Legal Proceedings
4.2%
of the text changed · 412 words now
Accounting Policies
13.0%
of the text changed · 2,492 words now
10-K 0001104659-26-020651 (Feb 26, 2026) vs 10-K 0001558370-25-001806 (Feb 27, 2025)
Every paragraph, and how much of it changed
One bar per paragraph, in the order of the 10-K. Height and colour show the share of its words not in the closest paragraph a year earlier; the tallest bars are new paragraphs.
Risk Factors
96 paragraphs · 4 new · 30 reworded · 6 gone · 10-K Feb 26, 2026 against Feb 27, 2025
New paragraph
Reworded (5% of its words or more)
Same or nearly
Paragraph 96 · 44% changed
Every version of it
A substantial portion of our indebtedness bears interest at rates that fluctuate with changes in certain short-term prevailing interest rates based on the Secured Overnight Financing Rate (“SOFR”). SOFR tends to fluctuate based on changes in interest rate policy by the Federal Reserve. As of December 31, 2024, 2025, we had an insignificant amount a total of variable interest rate debt outstanding. However, as $677.0 million of December 31, 2024, we had approximately $1.5 billion available for borrowing on outstanding borrowings under our revolving credit facility and a term loan that bore interest at variable rates based on SOFR. Assuming the same level of variable-interest debt, a hypothetical 100-basis point increase in SOFR would result in approximately $6.8 million of additional interest rates. expense on an annual basis. We currently do not use derivative financial instruments to manage the potential impact of interest rate risk. Accordingly, if we borrow our interest expense for any particular period will generally fluctuate based on changes in SOFR and outstanding borrowings under our revolving credit facility, which can adversely impact our interest expense will fluctuate based on the Secured Overnight Financing Rate results of operations and other variable interest rates. profitability.
Paragraph 15 · 43% changed
Every version of it
Paragraph 2 · 33% changed
Every version of it
The costs that we pay for metals fluctuate due to a number of factors beyond our control, and such fluctuations could adversely affect our operating results, particularly decreases in periods in which metals prices. price increases are not supported by underlying demand and we are unable to fully pass our higher metal costs to our customers or during periods of declining metals prices and we are unable to quickly lower our inventory costs on hand.
Paragraph 67 · 33% changed
Every version of it
Paragraph 95 · 28% changed
Every version of it
Because all a substantial portion of our available borrowing capacity on our revolving credit facility indebtedness bears interest at rates that fluctuate with changes in certain prevailing short-term interest rates, if we increase our leverage in the future, we are vulnerable to increases in interest rates.
Paragraph 36 · 23% changed
Every version of it
In some circumstances we may be entitled to certain legal protections or indemnifications from our customers vendors through contractual provisions, laws, regulations or otherwise. However, these protections are not always available, are typically subject to certain terms or limitations, including the availability of funds, and may not be sufficient to cover all losses or liabilities incurred.
Paragraph 66 · 23% changed
Every version of it
Our operating results could be negatively affected by the global laws, rules and regulations, as well as political environments in the jurisdictions in which we operate. For example, we are subject to the FCPA, and similar worldwide anti-bribery laws in non-U.S. jurisdictions such as the United Kingdom’s Bribery Act 2010, which generally prohibit companies and their intermediaries from corruptly paying, offering to pay, or authorizing the payment of money, a gift, or anything of value, to a foreign official or foreign political party, for purposes of obtaining or retaining business. A company can be held liable under these anti-bribery laws not just for its own direct actions, but also for the actions of its foreign subsidiaries or other third parties, such as agents or distributors. In addition, we could be held liable for actions taken by employees or third parties on behalf of a company that we acquire. If we fail to comply with the requirements under these
Paragraph 82 · 45% changed
Every version of it
10-K Feb 27, 2025We review the recoverability of goodwill and indefinite-lived intangible assets annually or whenever significant events or changes in circumstances occur that might impair the recovery of recorded costs. Factors that may be considered a change in circumstances, indicating that the carrying value of our goodwill or indefinite-lived intangible assets may not be recoverable, include a decline in stock price and market capitalization, declines in the market conditions for our products, viability of end markets, loss of customers, reduced future cash flow estimates, and slower growth rates in our industry. If prices for the products our customers sell fall substantially or remain low for a sustained period, we may be (i) unable to realize a profit from businesses that service such customers, (ii) required to record additional impairments, or (iii) required to suspend or reorganize operations that service such customers. An impairment charge, if incurred, could be material.
10-K Feb 26, 2026
customers sell fall substantially or remain low for a sustained period, we may be (i) unable to operate businesses that service such customers profitably, (ii) required to record additional impairments, or (iii) required to suspend or reorganize operations that service such customers. An impairment charge, if incurred, could be material.
Paragraph 96 · 44% changed
Every version of it
10-K Feb 27, 2025
As of December 31, 2024, we had an insignificant amount of variable interest rate debt outstanding. However, as of December 31, 2024, we had approximately $1.5 billion available for borrowing on our revolving credit facility at variable interest rates. We currently do not use derivative financial instruments to manage the potential impact of interest rate risk. Accordingly, if we borrow on our revolving credit facility, our interest expense will fluctuate based on the Secured Overnight Financing Rate and other variable interest rates.
10-K Feb 26, 2026
A substantial portion of our indebtedness bears interest at rates that fluctuate with changes in certain short-term prevailing interest rates based on the Secured Overnight Financing Rate (“SOFR”). SOFR tends to fluctuate based on changes in interest rate policy by the Federal Reserve. As of December 31, 2025, we had a total of $677.0 million of outstanding borrowings under our revolving credit facility and a term loan that bore interest at variable rates based on SOFR. Assuming the same level of variable-interest debt, a hypothetical 100-basis point increase in SOFR would result in approximately $6.8 million of additional interest expense on an annual basis. We currently do not use derivative financial instruments to manage the potential impact of interest rate risk. Accordingly, our interest expense for any particular period will generally fluctuate based on changes in SOFR and outstanding borrowings under our revolving credit facility, which can adversely impact our results of operations and profitability.
Paragraph 15 · 43% changed
Every version of it
10-K Feb 27, 2025On February 1, 2025, the White House issued executive orders directing increased tariffs on imports from Canada, Mexico and China with a threat of further increases for any country that retaliates. The proposed tariffs on Canada and Mexico were deferred for 30 days. The 10% additional tariff on imports from China was effected and China retaliated with tariffs on certain products it imports from the US. On February 10, 2025, the White House issued executive orders reinstating a 25% tariff on all steel imports and an increase in aluminum tariffs from 10% to 25% effective on and after March 12, 2025. This expansion of 232 tariffs revokes previously negotiated country-specific exemptions and quota arrangements, and does not allow product exclusions at this time, established under the original Section 232 tariffs in 2018. The status of any such tariffs is fluid and the ultimate impact on our revenues, financial results and cash flows will be based on a number of variables that are not known at this time. The impact on our business will be based on the final tariffs imposed, which we are not able to predict at this time. The extent to which effected/deferred tariffs or other trade actions, or the threat of tariffs result in a decrease in international demand for steel and aluminum produced in the U.S., disruptions in customer buying patterns or otherwise negatively impact demand for our products, our business may be adversely impacted.
10-K Feb 26, 2026
The current system of tariffs is fluid and the ultimate impacts of such tariffs on our revenues, financial results and cash flows will be based on a number of variables that are not known at this time. The impact on our business will be based on the actual tariffs imposed as well as their duration, which we are not able to predict at this time. Our business may be adversely impacted to the extent to which the threat of tariffs or effected/deferred tariffs or other trade actions result in a decrease in international demand for steel and aluminum produced in the U.S. or disruptions in customer buying patterns.
Paragraph 2 · 33% changed
Every version of it
10-K Feb 27, 2025
The costs that we pay for metals fluctuate due to a number of factors beyond our control, and such fluctuations could adversely affect our operating results, particularly decreases in metals prices.
10-K Feb 26, 2026
The costs that we pay for metals fluctuate due to a number of factors beyond our control, and such fluctuations could adversely affect our operating results, particularly in periods in which metals price increases are not supported by underlying demand and we are unable to fully pass our higher metal costs to our customers or during periods of declining metals prices and we are unable to quickly lower our inventory costs on hand.
Paragraph 67 · 33% changed
Every version of it
10-K Feb 27, 2025Our operating results could be negatively affected by the global laws, rules and regulations, as well as political environments in the jurisdictions in which we operate. For example, we are subject to the FCPA, and similar worldwide anti-bribery laws in non-U.S. jurisdictions such as the United Kingdom’s Bribery Act 2010, which generally prohibit companies and their intermediaries from corruptly paying, offering to pay, or authorizing the payment of money, a gift, or anything of value, to a foreign official or foreign political party, for purposes of obtaining or retaining business. A company can be held liable under these anti-bribery laws not just for its own direct actions, but also for the actions of its foreign subsidiaries or other third parties, such as agents or distributors. In addition, we could be held liable for actions taken by employees or third parties on behalf of a company that we acquire. If we fail to comply with the requirements under these
10-K Feb 26, 2026
obtaining or retaining business. A company can be held liable under these anti-bribery laws not just for its own direct actions, but also for the actions of its foreign subsidiaries or other third parties, such as agents or distributors. In addition, we could be held liable for actions taken by employees or third parties on behalf of a company that we acquire. If we fail to comply with the requirements under these laws and regulations, we may face possible civil and/or criminal penalties, which could have a material adverse effect on our business or financial results.
Paragraph 95 · 28% changed
Every version of it
10-K Feb 27, 2025
Because all of our available borrowing capacity on our revolving credit facility bears interest at rates that fluctuate with changes in certain prevailing short-term interest rates, if we increase our leverage in the future, we are vulnerable to increases in interest rates.
10-K Feb 26, 2026
Because a substantial portion of our indebtedness bears interest at rates that fluctuate with changes in certain prevailing short-term interest rates, we are vulnerable to increases in interest rates.
Paragraph 36 · 23% changed
Every version of it
10-K Feb 27, 2025
In some circumstances we may be entitled to certain legal protections or indemnifications from our customers through contractual provisions, laws, regulations or otherwise. However, these protections are not always available, are typically
10-K Feb 26, 2026
In some circumstances we may be entitled to certain legal protections or indemnifications from our vendors through contractual provisions, laws, regulations or otherwise. However, these protections are not always available, are typically subject to certain terms or limitations, including the availability of funds, and may not be sufficient to cover all losses or liabilities incurred.
Paragraph 66 · 23% changed
Every version of it
10-K Feb 27, 2025
Our operating results could be negatively affected by the global laws, rules and regulations, as well as political environments in the jurisdictions in which we operate. For example, we are subject to the FCPA, and similar worldwide anti-bribery laws in non-U.S. jurisdictions such as the United Kingdom’s Bribery Act 2010, which generally prohibit companies and their intermediaries from corruptly paying, offering to pay, or authorizing the payment of money, a gift, or anything of value, to a foreign official or foreign political party, for purposes of obtaining or retaining business. A company can be held liable under these anti-bribery laws not just for its own direct actions, but also for the actions of its foreign subsidiaries or other third parties, such as agents or distributors. In addition, we could be held liable for actions taken by employees or third parties on behalf of a company that we acquire. If we fail to comply with the requirements under these
10-K Feb 26, 2026
Our operating results could be negatively affected by the global laws, rules and regulations, as well as political environments in the jurisdictions in which we operate. For example, we are subject to the FCPA, and similar worldwide anti-bribery laws in non-U.S. jurisdictions such as the United Kingdom’s Bribery Act 2010, which generally prohibit companies and their intermediaries from corruptly paying, offering to pay, or authorizing the payment of money, a gift, or anything of value, to a foreign official or foreign political party, for purposes of
MD&A
68 paragraphs · 19 new · 36 reworded · 27 gone · 10-K Feb 26, 2026 against Feb 27, 2025
New paragraph
Reworded (5% of its words or more)
Same or nearly
Paragraph 15 · 49% changed
Paragraph 42 · 48% changed
Net cash provided by operations of $831.4 million in 2025 decreased $598.4 million from $1.43 billion in 2024 decreased $241.5 million from $1.67 billion in 2023. 2024. The decrease was mainly due to a $462.1 $136.4 million decline in net income partially offset by lower and increased working capital investment. To manage our requirements. Higher tons sold volume and the rising metals pricing environment in 2025 required a greater working capital, we focus on our days sales outstanding capital investment (primarily accounts receivable and inventory turnover rate as receivables and inventory are the two most significant elements of our working capital. Our average days sales outstanding rates inventories) than in 2024 during which metals prices were 41.5 declining.
Paragraph 26 · 47% changed
Paragraph 41 · 31% changed
Paragraph 47 · 31% changed
We believe our primary sources of liquidity, including funds generated from operations, cash and cash equivalents and our $1.5 billion revolving credit facility, facility “Credit Agreement”), will be sufficient to satisfy our cash requirements and stockholder return activities over the next 12 months and beyond. As of December 31, 2024, we had $318.1 million in cash and cash equivalents and our net debt-to-total capital ratio (net debt-to-total capital is calculated as carrying amount of debt, net of cash, divided by total Reliance stockholders’ equity plus carrying amount of debt, net of cash) was 10.2%.
Paragraph 16 · 30% changed
Returns to stockholders totaled $848.8 million in 2024 totaled $1.34 billion, comprised 2025, consisting of a record $1.09 billion $594.1 million of share repurchases which reduced our outstanding common shares by six percent year-over-year, and $249.7 $254.7 million of cash dividends, which reflected reflecting a 10.0% 9.1% increase in our the regular quarterly dividend rate.
Paragraph 24 · 29% changed
We believe the increase in our level of orders that include value-added processing over time has provided stability to our gross profit margin during periods of declining metals prices and contributed to a higher sustainable gross profit margin level. We have made significant investments in capital expenditures in recent years that have expanded our value-added processing capabilities and increased the level of our sales orders that include value-added processing to at least 50%, approximately 50%. We believe we have industry leading gross profit margins based on our peer group of publicly traded metal service center companies. Our current processing and estimated sustainable gross profit margin level is significantly higher than what we believe to be our historical levels from over a decade ago, in which the percentage of our orders that included value-added processing was closer to 40% and our gross profit margin level was under 27%.
Paragraph 34 · 29% changed
See “Overview” for further discussion of the impact of tariff actions on LIFO expense and our gross profit margin. See “Net Sales” above for trends in both demand and costs of our products, and product pricing.
Paragraph 15 · 49% changed
10-K Feb 27, 2025Net cash used in investing activities of $803.7 million in 2024 increased $319.8 million compared to $483.9 million in 2023. The significant increase was mainly due to $364.6 million spent on acquisitions in 2024 compared to $24.0 million in 2023, partially offset by a $38.2 million decrease in capital expenditures. The majority of our capital expenditures in 2024 and 2023 were related to growth initiatives.
10-K Feb 26, 2026
Spending on growth-related activities decreased by $463.5 million in 2025 compared to 2024, primarily due to the absence of acquisition activity ($361.8 million) and a $101.7 million reduction in capital expenditures.
Paragraph 42 · 48% changed
10-K Feb 27, 2025
Net cash provided by operations of $1.43 billion in 2024 decreased $241.5 million from $1.67 billion in 2023. The decrease was mainly due to a $462.1 million decline in net income partially offset by lower working capital investment. To manage our working capital, we focus on our days sales outstanding and inventory turnover rate as receivables and inventory are the two most significant elements of our working capital. Our average days sales outstanding rates were 41.5
10-K Feb 26, 2026
Net cash provided by operations of $831.4 million in 2025 decreased $598.4 million from $1.43 billion in 2024. The decrease was mainly due to a $136.4 million decline in net income and increased working capital requirements. Higher tons sold volume and the rising metals pricing environment in 2025 required a greater working capital investment (primarily accounts receivable and inventories) than in 2024 during which metals prices were declining.
Paragraph 26 · 47% changed
10-K Feb 27, 2025We believe that our ability to make significant investments in processing equipment and facilities is a competitive advantage, as we can expand our services and provide higher quality product to our customers. We believe many metals service center company competitors do not have the ability to expand their processing services in response to their customers’ needs as quickly and at the same scale as Reliance.
10-K Feb 26, 2026
the ability to expand their processing services in response to their customers’ needs as quickly or at the same scale as Reliance.
Paragraph 41 · 31% changed
10-K Feb 27, 2025We believe our primary sources of liquidity, including funds generated from operations, cash and cash equivalents and our $1.5 billion revolving credit facility, will be sufficient to satisfy our cash requirements and stockholder return activities over the next 12 months and beyond. As of December 31, 2024, we had $318.1 million in cash and cash equivalents and our net debt-to-total capital ratio (net debt-to-total capital is calculated as carrying amount of debt, net of cash, divided by total Reliance stockholders’ equity plus carrying amount of debt, net of cash) was 10.2%.
10-K Feb 26, 2026
As of December 31, 2025, we had $216.6 million in cash and cash equivalents and our net debt-to-total capital ratio (net debt-to-total capital is calculated as carrying amount of debt, net of cash, divided by total Reliance stockholders’ equity plus carrying amount of debt, net of cash) was 14.4% compared to 10.2% as of December 31, 2024. The increase was primarily attributable to increased borrowings under our revolving credit facility.
Paragraph 47 · 31% changed
10-K Feb 27, 2025
We believe our primary sources of liquidity, including funds generated from operations, cash and cash equivalents and our $1.5 billion revolving credit facility, will be sufficient to satisfy our cash requirements and stockholder return activities over the next 12 months and beyond. As of December 31, 2024, we had $318.1 million in cash and cash equivalents and our net debt-to-total capital ratio (net debt-to-total capital is calculated as carrying amount of debt, net of cash, divided by total Reliance stockholders’ equity plus carrying amount of debt, net of cash) was 10.2%.
10-K Feb 26, 2026
We believe our primary sources of liquidity, including funds generated from operations, cash and cash equivalents and our $1.5 billion revolving credit facility “Credit Agreement”), will be sufficient to satisfy our cash requirements and stockholder return activities over the next 12 months and beyond.
Paragraph 16 · 30% changed
10-K Feb 27, 2025
Returns to stockholders in 2024 totaled $1.34 billion, comprised of a record $1.09 billion of share repurchases which reduced our outstanding common shares by six percent year-over-year, and $249.7 million of cash dividends, which reflected a 10.0% increase in our regular quarterly dividend rate.
10-K Feb 26, 2026
Returns to stockholders totaled $848.8 million in 2025, consisting of $594.1 million of share repurchases and $254.7 million of cash dividends, reflecting a 9.1% increase in the regular quarterly dividend rate.
Paragraph 24 · 29% changed
10-K Feb 27, 2025
We believe the increase in our level of orders that include value-added processing over time has provided stability to our gross profit margin during periods of declining metals prices and contributed to a higher sustainable gross profit margin level. We have made significant investments in capital expenditures in recent years that have expanded our value-added processing capabilities and increased the level of our sales orders that include value-added processing to at least 50%,
10-K Feb 26, 2026
We believe the increase in our level of orders that include value-added processing over time has provided stability to our gross profit margin during periods of declining metals prices and contributed to a higher sustainable gross profit margin level. We have made significant investments in capital expenditures in recent years that have expanded our value-added processing capabilities and increased the level of our sales orders that include value-added processing to approximately 50%. We believe we have industry leading gross profit margins based on our peer group of publicly traded metal service center companies. Our current processing and estimated sustainable gross profit margin level is significantly higher than what we believe to be our historical levels from over a decade ago, in which the percentage of our orders that included value-added processing was closer to 40% and our gross profit margin level was under 27%.
Paragraph 34 · 29% changed
10-K Feb 27, 2025
See “Net Sales” above for trends in both demand and costs of our products, and product pricing.
10-K Feb 26, 2026
See “Overview” for further discussion of the impact of tariff actions on LIFO expense and our gross profit margin. See “Net Sales” above for trends in both demand and costs of our products, and product pricing.
A paragraph is matched with the one last year that shares the most of its words; under half in common makes it new. The paragraphs shown are the 8 reworded the most in each section.
The paragraph that changed most in each section
The redline
Marked against last year's 10-K: cut words struck through, new words highlighted.
Risk Factors189 words changed in this paragraph; it is 46% similar to last year's version.
Source: Item 1A, 10-K 0001104659-26-020651 vs Item 1A, 10-K 0001558370-25-001806
MD&A125 words changed in this paragraph; it is 31% similar to last year's version.
Net cash used in financing investing activities of $1.38 billion in 2024 increased $94.1 million from $1.28 billion in 2023. The increase was mainly the result of increased share repurchases partially offset by decreased net debt repayments. Net debt repayments were $0.3 $321.8 million in 2024 2025 decreased $481.9 million compared to $508.3 $803.7 million in 2023, which included the redemption of $500.0 2024. $361.8 million of senior notes. In 2024, we repurchased a record $1.09 billion the decrease was due to the absence of acquisition activity in 2025 compared to four acquisitions completed in 2024. Our investments in capital expenditures also declined $101.7 million in 2025 compared to 2024. The majority of our common stock compared capital expenditures in 2025 and 2024 were related to $479.5 million in 2023. Our returns to stockholders also included a 10% increase in our quarterly dividend rate in February 2024 with total dividend payments of $249.7 million in 2024 compared to $238.1 million in 2023. growth initiatives.
Source: Item 7, 10-K 0001104659-26-020651 vs Item 7, 10-K 0001558370-25-001806
Accounting Policies97 words changed in this paragraph; it is 74% similar to last year's version.
Source: Item 8, Note 1 – SUMMARY OF SIGNIFICANT ACCOUNTING POLICIES, 10-K 0001104659-26-020651 vs Item 8, Note 1 – Summary of Significant Accounting Policies, 10-K 0001558370-25-001806
Legal Proceedings18 words changed in this paragraph; it is 84% similar to last year's version.
As of December 31, 2024, 2025, we had commitments to purchase minimum quantities of certain metals products, which we entered into to secure material for corresponding long-term sales commitments with our customers. The total amount of the minimum commitments based on current pricing is estimated at approximately $276.2 million, with amounts in 2025, 2026 and thereafter being $193.4 million, $57.2 million and $25.6 million, respectively. $182.2
Source: Item 3, via Note 17 – COMMITTMENTS AND CONTINGENCIES, 10-K 0001104659-26-020651 vs Item 3, via Note 17 – Commitments and Contingencies, 10-K 0001558370-25-001806
Sentences and paragraphs added, removed or reworded
Every change, by type
Sentences and paragraphs of RS's Risk Factors and MD&A, 10-K Feb 26, 2026 against 10-K Feb 27, 2025. Each links to the text at sec.gov.
Quiet changes are sentences kept from last year with one to four words changed, at least one of them a hedge, a modal or a qualifier (may, could, will, not, significant, material…). A year or date rolling forward is not counted.
The full word list
adverse, adversely, all, although, anticipate, anticipates, any, approximately, believe, believes, can, cannot, certain, could, expect, expects, generally, however, if, intend, intends, largely, likely, many, material, materially, may, might, most, must, never, no, not, possible, primarily, probable, should, significant, significantly, some, substantial, substantially, unlikely, will, would
AddedRisk Factors
In 2025, the U.S. government altered its approach to international trade policy, both generally and with respect to matters directly and indirectly affecting the metals industry, including by undertaking certain unilateral actions affecting trade, renegotiating existing bilateral and multilateral trade agreements, and entering into new agreements with foreign countries. For example, in early 2025, the U.S. government issued executive orders imposing Section 232 duties on steel and aluminum products from Canada and Mexico, eliminating the tariff rate quotas that had partially exempted imports from certain countries and eliminating product-specific exclusions. These executive actions also increased the aluminum tariffs from 10% to 25% effective on and after March 12, 2025. Subsequently, in June 2025, the Section 232 steel and aluminum tariffs were generally increased to 50%. The tariffs were also expanded to cover a range of additional “derivative” steel-containing articles.
Read it in 10-K Feb 26, 2026 at sec.gov
AddedRisk Factors
On February 20, 2026, the Supreme Court ruled that the president is not authorized to impose tariffs under the International Emergency Economic Powers Act. It is currently unclear what the overall impact of this ruling will be. The Supreme Court's ruling has no direct impact on the tariffs in place under Section 232, including tariffs on steel and aluminum.
Read it in 10-K Feb 26, 2026 at sec.gov
AddedRisk Factors
We have few long-term contracts to purchase metals. Therefore, our primary suppliers of aluminum, carbon, stainless and alloy steel or other metals could curtail or discontinue their delivery of these metals to us in the
Read it in 10-K Feb 26, 2026 at sec.gov
AddedRisk Factors
significant attention and financial resources to protect against physical or security incidents that could result in the misappropriation of our information or the information of our employees and customers.
Read it in 10-K Feb 26, 2026 at sec.gov
RemovedRisk Factors
RemovedRisk Factors
RemovedRisk Factors
RemovedRisk Factors
Show the other 50
RemovedRisk Factors
RemovedRisk Factors
RewordedRisk Factors
The costs that we pay for metals fluctuate due to a number of factors beyond our control, and such fluctuations could adversely affect our operating results, particularly decreases in periods in which metals prices. price increases are not supported by underlying demand and we are unable to fully pass our higher metal costs to our customers or during periods of declining metals prices and we are unable to quickly lower our inventory costs on hand.
Read it in 10-K Feb 26, 2026 at sec.gov
RewordedRisk Factors
RewordedRisk Factors
Consequently, during periods in which we sell this existing inventory, are selling inventory on hand that is costed above current replacement costs, the effects of changing metal prices could would adversely affect our operating results. results until our inventory costs on hand align with current replacement costs.
Read it in 10-K Feb 26, 2026 at sec.gov
RewordedRisk Factors
Changing market dynamics, global policy developments, and the increasing frequency and impact of extreme weather events on critical infrastructure in the U.S. and elsewhere have the potential to disrupt our business, the business of our third-party suppliers, and the business of our customers, and may cause us to experience higher attrition, losses and additional costs to maintain or resume operations.
Read it in 10-K Feb 26, 2026 at sec.gov
RewordedRisk Factors
A significant increase in minimum wage or overtime rates in jurisdictions where we have employees could have a significant impact on our operating costs and may require that we relocate those operations or take other steps to mitigate such increases, all of which may cause us to incur additional costs, expend resources responding to such increases and lower our profitability.
Read it in 10-K Feb 26, 2026 at sec.gov
RewordedRisk Factors
Because all a substantial portion of our available borrowing capacity on our revolving credit facility indebtedness bears interest at rates that fluctuate with changes in certain prevailing short-term interest rates, if we increase our leverage in the future, we are vulnerable to increases in interest rates.
Read it in 10-K Feb 26, 2026 at sec.gov
RewordedRisk Factors
Competition is based principally on price, inventory availability, timely delivery, customer service, quality quality, processing capability and processing capabilities. availability of products and services.
Read it in 10-K Feb 26, 2026 at sec.gov
RewordedRisk Factors
If we cannot identify suitable acquisition candidates or are otherwise unable to complete acquisitions, we may not be able to continue to grow our business as expected and, if we cannot successfully integrate recently acquired businesses, we may incur increased or redundant expenses. expenses or management’s attention may be distracted from other strategic priorities.
Read it in 10-K Feb 26, 2026 at sec.gov
RewordedRisk Factors
We purchase large quantities of carbon steel, aluminum, carbon, stainless and alloy steel steel, alloy, and other metals, metal products, which we sell to a variety of customers.
Read it in 10-K Feb 26, 2026 at sec.gov
RewordedRisk Factors
The status current system of any such tariffs is fluid and the ultimate impact impacts of such tariffs on our revenues, financial results and cash flows will be based on a number of variables that are not known at this time.
Read it in 10-K Feb 26, 2026 at sec.gov
RewordedRisk Factors
To compete for customer sales, we may lower prices or incur higher costs to offer increased services at a higher cost, services, which could reduce our profitability and cash flows.
Read it in 10-K Feb 26, 2026 at sec.gov
RewordedRisk Factors
The impact on our business will be based on the final actual tariffs imposed, imposed as well as their duration, which we are not able to predict at this time.
Read it in 10-K Feb 26, 2026 at sec.gov
AddedMD&A
Net sales were $14.29 billion in 2025, an increase of 3.3% compared to 2024, driven by record tons sold, which increased 6.2% and more than offset a 2.6% decline in average selling price per ton sold. Fourth quarter
Read it in 10-K Feb 26, 2026 at sec.gov
AddedMD&A
2025 net sales increased 11.9% year-over-year, with tons sold increasing 5.8%, representing the strongest fourth quarter growth since 2021. Shipments grew across most of the end markets we serve, with notably strong underlying demand in non-residential construction, our largest end market by tons.
Read it in 10-K Feb 26, 2026 at sec.gov
AddedMD&A
Operating results reported under our LIFO method of inventory accounting declined in 2025 due to temporary tariff-related pressure on gross profit margin and higher SG&A expense. However, excluding significant LIFO impacts in both 2025 and 2024, FIFO gross profit margin and profitability improved.
Read it in 10-K Feb 26, 2026 at sec.gov
AddedMD&A
Growth in tons sold during 2025 exceeded the industry-wide decline of 1.0% reported by the Metals Service Center Institute (“MSCI”) by more than 7 percentage points. We believe that our scale, diversified business model, and customer service capabilities, including next-day delivery and extensive value-added processing, enabled us to expand our market share despite a declining industry trend.
Read it in 10-K Feb 26, 2026 at sec.gov
AddedMD&A
Tariff-related carbon steel and aluminum cost increases during the first half of 2025 initially supported higher metals pricing following the declining pricing environment experienced throughout 2024. However, because these increases were not demand-driven, our gross profit margin softened beginning in the third quarter as higher metal costs were not fully passed through to customers, particularly for aluminum products amid soft demand and ample supply in the commercial aerospace and semiconductor markets.
Read it in 10-K Feb 26, 2026 at sec.gov
AddedMD&A
Our LIFO gross profit margin was 28.7% in 2025, down 100 basis points year-over-year, mainly due to a swing in LIFO inventory valuation adjustments—from $144.4 million of income in 2024 to $113.7 million of expense in 2025—driven in part by higher aluminum costs that had a disproportionate impact on LIFO expense. However, higher metal prices supported by tariff actions drove FIFO gross profit margin up 80 basis points to 29.5%.
Read it in 10-K Feb 26, 2026 at sec.gov
AddedMD&A
Same-store SG&A expense increased 4.2% while tons sold grew 5.3% in 2025 compared to 2024, resulting in a 1.0% decline in same-store SG&A expense per ton sold and demonstrating improved operating leverage. Increases in total and same-store SG&A expense reflected inflationary wage adjustments and higher variable warehousing and delivery costs associated with increased shipment volumes. Higher FIFO profitability also contributed to increased incentive-based compensation.
Read it in 10-K Feb 26, 2026 at sec.gov
AddedMD&A
Earnings per diluted share were $13.98 in 2025 compared to $15.56 in 2024, a decrease of 10.2%. The impacts of a lower average selling price per ton sold and tariff-related gross profit margin pressure on our earnings per share were partially mitigated by significant growth in tons sold, lower SG&A expense per ton sold, and a 4% reduction in outstanding shares resulting from share repurchases. However, profitability excluding the impacts of LIFO inventory valuation adjustments increased 14.5% year-over-year.
Read it in 10-K Feb 26, 2026 at sec.gov
AddedMD&A
Cash flow from operations was $831.4 million in 2025, a decrease of $598.4 million from $1.43 billion in 2024, which represented the third-highest level in our history. The decline in operating cash flow was driven primarily by higher working capital requirements related to higher tons sold volume and higher metals pricing.
Read it in 10-K Feb 26, 2026 at sec.gov
AddedMD&A
volume. While we can and do reduce certain variable expenses when volumes decline, we cannot easily reduce our fixed costs.
Read it in 10-K Feb 26, 2026 at sec.gov
AddedMD&A
We primarily purchase and sell inventory in the spot market, with the majority valued using the last-in, first-out (“LIFO”) method. Under this method, cost of sales reflects current inventory costs associated with the corresponding sales. During periods of fluctuating metals prices, we believe the LIFO method can provide stability in our reported gross profit margin as compared to the first-in, first-out (“FIFO”) method, which is used in our day-to-day operations and incentive-based compensation programs at many of our operating locations.
Read it in 10-K Feb 26, 2026 at sec.gov
AddedMD&A
With cash on hand, we acquired (i) Cooksey Iron & Metal Company on February 1, 2024; (ii) American Alloy Steel, Inc. on April 1, 2024; (iii) Mid-West Materials, Inc. on April 1, 2024; and (iv) certain assets of the FerrouSouth division of Ferragon Corporation on August 16, 2024. Included in our net sales for 2025 and 2024 were combined net sales of $389.2 million and $286.2 million, respectively, from our 2024 acquisitions.
Read it in 10-K Feb 26, 2026 at sec.gov
RemovedMD&A
RemovedMD&A
RemovedMD&A
RemovedMD&A
RemovedMD&A
RemovedMD&A
RemovedMD&A
RemovedMD&A
RemovedMD&A
RemovedMD&A
RemovedMD&A
RemovedMD&A
RewordedMD&A
Returns to stockholders totaled $848.8 million in 2024 totaled $1.34 billion, comprised 2025, consisting of a record $1.09 billion $594.1 million of share repurchases which reduced our outstanding common shares by six percent year-over-year, and $249.7 $254.7 million of cash dividends, which reflected reflecting a 10.0% 9.1% increase in our the regular quarterly dividend rate.
Read it in 10-K Feb 26, 2026 at sec.gov
RewordedMD&A
The total amount of minimum commitments under long-term inventory purchase agreements based on current pricing is estimated at approximately $276.2 $182.2 million, with amounts in 2025, 2026 2026, 2027 and thereafter being $193.4 $165.5 million, $57.2 $5.3 million and $25.6 $11.4 million, respectively.
Read it in 10-K Feb 26, 2026 at sec.gov
RewordedMD&A
As of December 31, 2024, 2025, we had $401.1 $400.7 million of debt obligations coming due before our $1.5 billion unsecured revolving credit facility matures on September 10, 2029, including consisting primarily of $400.0 million of senior notes outstanding under our Term Loan due in August 2025. 2028.
Read it in 10-K Feb 26, 2026 at sec.gov
RewordedMD&A
RewordedMD&A
(1) See Note 15—“Equity” 20—“Impairment and Restructuring Charges” to our consolidated financial statements in Part II, Item 8 "Financial 8, “Financial Statements and Supplementary Data" Data” for information on our share repurchases. impairment and restructuring charges.
Read it in 10-K Feb 26, 2026 at sec.gov
RewordedMD&A
See Note 15—“Equity” 20—“Impairment and Restructuring Charges” to our consolidated financial statements in Part II, Item 8 "Financial 8, “Financial Statements and Supplementary Data" Data” for further information on our share repurchases. impairment and restructuring charges.
Read it in 10-K Feb 26, 2026 at sec.gov
RewordedMD&A
Net cash provided by operations of $831.4 million in 2025 decreased $598.4 million from $1.43 billion in 2024 decreased $241.5 million from $1.67 billion in 2023. 2024.
Read it in 10-K Feb 26, 2026 at sec.gov
RewordedMD&A
Income taxes paid paid, net of $163.7 million in 2025 decreased from $244.9 million in 2024 decreased from $386.3 million in 2023, 2024, mainly due to our lower pretax income.
Read it in 10-K Feb 26, 2026 at sec.gov
RewordedMD&A
Net cash used in financing activities of $620.2 million in 2025 decreased $756.2 million from $1.38 billion in 2024 increased $94.1 million from $1.28 billion in 2023. 2024.
Read it in 10-K Feb 26, 2026 at sec.gov
RewordedMD&A
We have other contractual commitments under long-term service agreements, totaling $74.6 $69.5 million at as of December 31, 2024, 2025, with amounts in 2025, 2026 2026, 2027 and thereafter being $25.8 $32.8 million, $22.1 $23.7 million and $26.7 $13.0 million, respectively.
Read it in 10-K Feb 26, 2026 at sec.gov
RewordedMD&A
In 2024, 2025, we repurchased a record $1.09 billion $594.1 million of our common stock compared to $479.5 million a record $1.09 billion in 2023. 2024.
Read it in 10-K Feb 26, 2026 at sec.gov
RewordedMD&A
As of December 31, 2024, 2025, we had entered into contracts related to capital expenditures in the amount of $97.7 $38.3 million, of which $91.4 million that is expected to be paid over the next 12 months. in 2026.
Read it in 10-K Feb 26, 2026 at sec.gov
Sources
The two latest 10-Ks on EDGAR, section by section. Each change links to the text at sec.gov.
Also
New risk factors: paragraphs with nothing like them last year, quoted in full.
Work with it
Excel workbook · CSV. Google Sheet that stays up to date: paste =IMPORTDATA("https://tickdelta.com/company/RS/export.csv") into a cell.