Sanmina Corp SANM
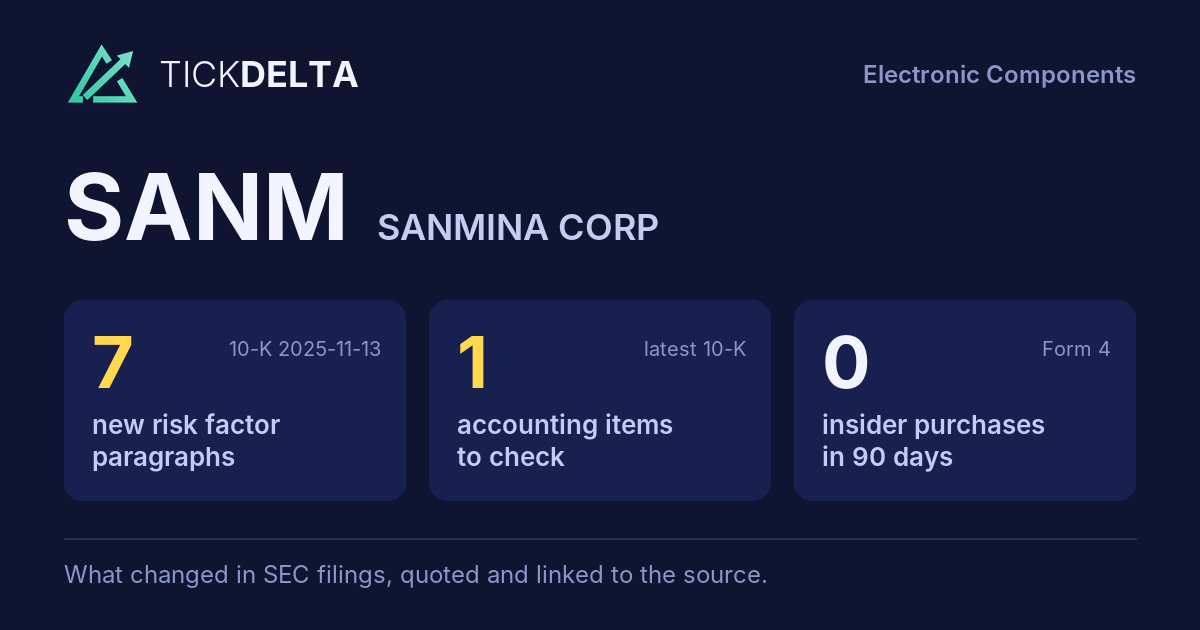
The biggest changes in the 10-K filed Nov 13, 2025, in management's words
10-K, Item 7This fiscal year against the last, and the sentences in the MD&A where management explains each change. Tickdelta picks sentences that name the line, a direction and a cause. It does not write explanations of its own.
Cash from operations
Big change, FY to Sep 27, 2025 vs Sep 28, 2024
The MD&A has no sentence that names a cause for this change.
Net income
Big change, FY to Sep 27, 2025 vs Sep 28, 2024
The MD&A has no sentence that names a cause for this change.
Revenue
Change, FY to Sep 27, 2025 vs Sep 28, 2024
“The increase in sales was primarily due to new program wins and program ramp-ups in our communications networks and cloud infrastructure, as well as our medical end markets.”
Read it in the 10-K
“The change in deferred revenue and customer advances is driven by increased customer deposits against raw material inventory purchases.”
Read it in the 10-K
Gross margin
Change, FY to Sep 27, 2025 vs Sep 28, 2024
“CPS gross margin increased to 13.9% in 2025 from 12.8% in 2024, primarily due to improved operating efficiencies partially offset by unfavorable product mix.”
Read it in the 10-K
Operating margin
Change, FY to Sep 27, 2025 vs Sep 28, 2024
The MD&A has no sentence that names a cause for this change.
What management said, year by year
The cause given in each 10-K, 2 fiscal years, newest first · MD&A (Item 7)
Each bar is how the line changed that year (from the same 10-K's XBRL). Under it, the sentence in that year's MD&A that names the line, a direction and a cause, word for word. A year with no sentence says so.
Revenue
2 of 2 years explained-
FY 2025 +7.4%
“The increase in sales was primarily due to new program wins and program ramp-ups in our communications networks and cloud infrastructure, as well as our medical end markets.”
Read it in the FY 2025 10-K“The change in deferred revenue and customer advances is driven by increased customer deposits against raw material inventory purchases.”
Read it in the FY 2025 10-K -
FY 2024 -15.3%
“The decrease in sales was primarily due to reduced demand caused by customers in some end markets, particularly communications networks, making adjustments to absorb their finished goods inventory.”
Read it in the FY 2024 10-K
Gross margin
2 of 2 years explained-
FY 2025 +0.4 pts
“CPS gross margin increased to 13.9% in 2025 from 12.8% in 2024, primarily due to improved operating efficiencies partially offset by unfavorable product mix.”
Read it in the FY 2025 10-K -
FY 2024 +0.1 pts
“CPS gross margin increased to 12.8% in 2024 from 11.6% in 2023, primarily due to significant losses recognized on certain fixed-price customer contracts in 2023 compared to 2024, the effect of which was partially offset by unfavorable product mix.”
Read it in the FY 2024 10-K
Operating margin
0 of 2 years explained-
FY 2025 -0.1 pts
The FY 2025 MD&A has no sentence that names a cause for this change.
-
FY 2024 -0.7 pts
The FY 2024 MD&A has no sentence that names a cause for this change.
Net income
0 of 2 years explained-
FY 2025 +10.5%
The FY 2025 MD&A has no sentence that names a cause for this change.
-
FY 2024 -28.2%
The FY 2024 MD&A has no sentence that names a cause for this change.
Cash from operations
0 of 2 years explained-
FY 2025 +82.4%
The FY 2025 MD&A has no sentence that names a cause for this change.
-
FY 2024 +44.7%
The FY 2024 MD&A has no sentence that names a cause for this change.
Changes are computed from the XBRL figures in the same 10-K. Hover a number to see the line item. Open the 10-K
Sources
The Management's Discussion and Analysis (Item 7) of the latest 10-K, quoted word for word; the changes are computed from the same 10-K's XBRL.
Also
Financials: the numbers year by year.
Work with it
Excel workbook · CSV. Google Sheet that stays up to date: paste =IMPORTDATA("https://tickdelta.com/company/SANM/export.csv") into a cell.