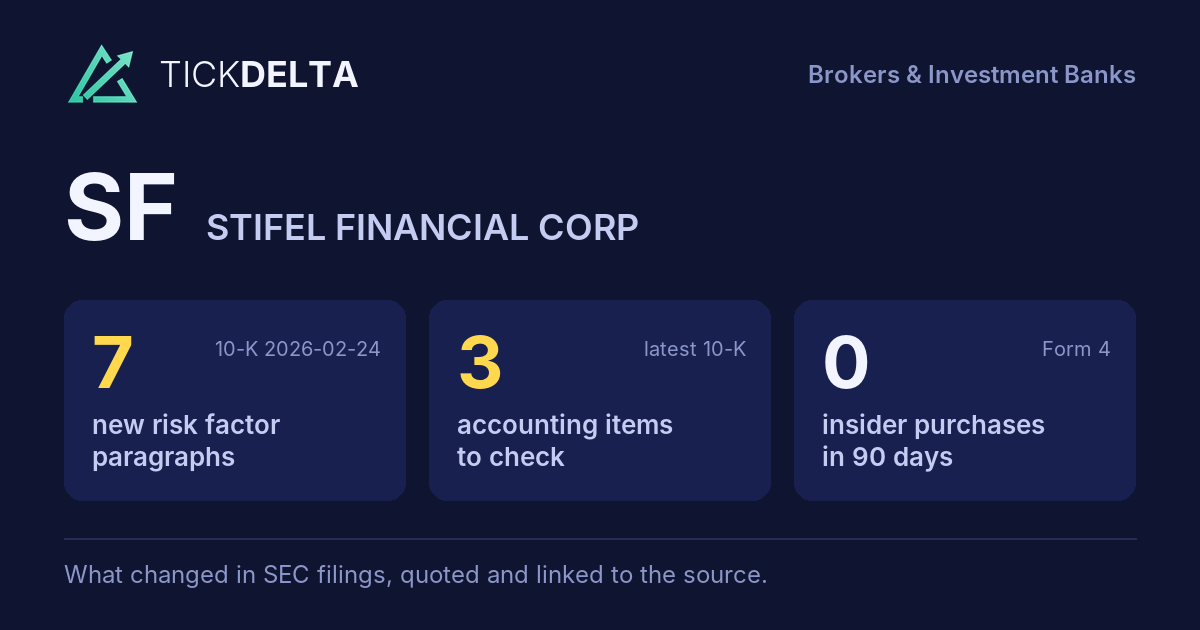
Screener / SEC EDGAR /CIK 0000720672 /10-K filed Feb 24, 2026, compared with Feb 26, 2025 /Numbers from the XBRL of the 10-Ks
NYSE Financials · Brokers & Investment Banks

Stifel Financial Corp SF

Compare with peers Embed
Earnings releases

Latest results release: Oct 21, 2026

8-K item 2.02, exhibit 99

What SF's management wrote with each quarter's results: the press release and, when the company files them, its prepared remarks or the call transcript. The call itself is not filed with SEC, so most quarters have the release only.

Adjusted vs GAAP earnings per share

In the company's own words · read from each release, never computed

In its release of Apr 23, 2025, SF reported −$1.16 per share under GAAP and $0.49 on its own adjusted basis.

ReleaseGAAP EPSAdjusted EPSGap
Apr 23, 2025 -1.16 0.49 –
The company's words, latest release
Net revenue 1,255 8% -8% Adjusted Net Income to Common Shareholders $183 Compensation expense 728 8% -8% 1 Impact to EPS of Legal -$1.16 Operating expense 259 3% -7% 2 Non-GAAP release
Common Shareholders $183 Compensation expense 728 8% -8% 1 Impact to EPS of Legal -$1.16 Operating expense 259 3% -7% 2 Non-GAAP EPS $0.49 12 128% 1% Provision for credit loss 3 release

Both numbers are read from the words of each release (usually the highlights), never computed by us; hover a number for its sentence. Quarters where the release gives them only in a table are not shown. The company decides what "adjusted" leaves out; the full reconciliation is in the release.

Read and search

Every release, in full · linked to sec.gov

Press release Oct 21, 2026 · EX-99.1

Reports Third Quarter 2026

Open on SEC

Exhibit 99.1 Stifel Reports Third Quarter 2026 Results ST. LOUIS, MO, October 21, 2026– Stifel Financial Corp. (NYSE: SF) today reported net revenues of $1.43 billion for the three months ended September 30, 2026, compared with $1.43 billion a year ago. Net income available to common shareholders was $224.8 million, or $1.40 per diluted common share, compared with $202.1 million, or $1.22 per diluted common share (1)for the third quarter of 2025. Non-GAAPnet income available to common shareholders was $234.1 million, or $1.46 per diluted common share for the third quarter of 2026. Ronald J. Kruszewski, Chairman and Chief Executive Officer, said “Stifel is on track for another record year, with year-to-date revenue of $4.3 billion up 9%, core earnings per share of $4.33 up 22%, and return on tangible common equity of 24.1%. The investments we’ve made in our business continued to drive operating efficiencies, as we delivered our highest ever third quarter earnings per share of $1.46, up 12% versus the prior year, on net revenue of $1.43 billion. I am optimistic about our outlook, as Stifel’s diversified business model, recurring revenue stream, and disciplined capital management position us to keep compounding value for shareholders.”

The Company reported net revenues of $1.43 billion, the second best third quarter in its history, driven by higher asset management revenues and net interest income.

Non-GAAP net income available to common shareholders of $1.46 per diluted common share, the best third quarter in its history.

Over the last twelve months, recruited trailing twelve-month production totaled approximately $19 million.

The Company repurchased $124.0 million, or 1.6 million shares, of its outstanding common stock during the third quarter at an average price of $76.95.

Media Contact: Neil Shapiro(212) 271-3447 | InvestorContact: Joel Jeffrey (212) 271-3610| www.stifel.com/investor-relations

Global Wealth Management Global Wealth Management reported record net revenues of $980.3 million for the three months ended September 30, 2026, compared with $907.4 million during the third quarter of 2025. Pre-taxnet income was $374.4 million compared with $342.7 million in the third quarter of 2025.

Client assets of $576.5 billion, up 6% over the year-ago quarter, which included $10.2 billion of client assets from the Stifel Independent Advisors business that was sold on February 2, 2026.

Fee-based client assets of $239.7 billion, up 9% over the year-ago quarter, which included $4.8 billion of client assets from the Stifel Independent Advisors business that was sold on February 2, 2026.

Over the last twelve months, recruited trailing twelve-month production totaled approximately $19 million.

Transactional revenues decreased 3% over the year-ago quarter, reflecting a decrease in client activity.

Asset management revenues increased 14% over the year-ago quarter, reflecting higher asset values due to improved market conditions and net new asset growth.

Net interest income increased 11% over the year-ago quarter primarily driven by balance sheet growth, partially offset by lower interest rates.

Compensation expense as a percentage of net revenues increased modestly to 48.8% primarily driven by higher revenue-related compensation, partially offset by revenue growth.

Provision for credit losses decreased from a year ago primarily as a result of a modest improvement in macroeconomic conditions, partially offset by loan growth in the retained portfolio and specific reserves on individual credits.

Non-compensation operating expenses as a percentage of net revenues decreased to 13.0% primarily attributable to lower litigation-related expenses, a decrease in the provision for credit losses, and revenue growth over the year-ago quarter.

Summary Results of Operations (000s) 3Q 2026 3Q 2025 Net revenues $980,293 $907,440 Transactional revenues 196,213 203,078 Asset management 492,123 431,363 Net interest income 284,583 257,327 Investment banking 6,731 6,529 Other 643 9,143 income Total expenses $605,885 $564,790 Compensation expense 478,877 441,626 Provision for credit losses 7,926 8,316 Non-comp. operating expenses 119,082 114,848 Pre-tax net income $374,408 $342,650 Compensation ratio 48.8% 48.7% Non-compensation ratio 13.0% 13.5% Pre-tax margin 38.2% 37.8%

Institutional Group Institutional Group reported net revenues of $430.3 million for the three months ended September 30, 2026, compared with $500.4 million during the third quarter of 2025. Pre-taxnet income was $76.3 million compared with $89.3 million in the third quarter of 2025.

Advisory revenues decreased 4% from the year-ago quarter, driven by lower levels of completed advisory transactions.

Equity capital raising revenues decreased 13% from the year-ago quarter, driven by lower volumes and smaller deal sizes.

Fixed income capital raising revenues decreased 2% over the year-ago quarter primarily driven by lower bond issuances.

Fixed income transactional revenues were impacted by widening credit spreads, increased market volatility, and lower realized trading gains during the quarter.

Equity transactional revenues were impacted by lower realized trading gains, a decline in trading volumes over the year-ago quarter and the restructuring of our European Equities business, which resulted in a $7 million reduction in equity transactional revenues year over year.

Compensation expense as a percentage of net revenues decreased to 58.7% primarily attributable to lower revenue-related compensation due to a decline in revenues from the year ago quarter.

Non-compensation operating expenses as a percentage of net revenues increased to 23.6% primarily attributable to a decline in revenues from the year ago quarter.

Over the last twelve months, the Company repurchased $564.4 million, or 7.3 million shares, of its outstanding common stock at an average price of $77.05.

Weighted average diluted shares outstanding decreased primarily due to share repurchases.

The Board of Directors declared a $0.34 quarterly dividend per share, payable on September 15, 2026, to common shareholders of record on September 1, 2026.

The Board of Directors declared a quarterly dividend on the outstanding shares of the Company’s preferred stock, payable on September 15, 2026, to shareholders of record on September 1, 2026. ──────────────────────────────────────────────────────────────────────────────

3Q 2026 3Q 2025 Common stock repurchases (1) Repurchases (000s) $124,005 $33,086 Number of shares (000s) 1,612 438 Average price $76.95 $75.57 Period end shares (000s) 150,061 152,922 Weighted average diluted shares 160,145 165,087 outstanding (000s) Effective tax 24.4% 26.1% rate Stifel Financial Corp. (10) Tier 1 common capital ratio `14.5% 14.8% Tier 1 risk-based capital ratio 17.0% 17.6% Tier 1 leverage capital ratio 10.8% 11.1% Tier 1 capital (MM) $4,665 $4,267 Risk weighted assets (MM) $27,450 $24,235 Average assets (MM) $43,060 $38,332 Quarter end $45,282 $41,687 assets (MM) Agency Rating Outlook Fitch Ratings BBB+ Stable S&P BBB Stable Global Ratings

Stifel Financial Corp. will host its third quarter 2026 financial results conference call on Wednesday, October21, 2026, at 9:30 a.m. Eastern Time.The conference call may include forward-looking statements.

All interested parties are invited to listen to Stifel’s Chairman and CEO, Ronald J. Kruszewski, by dialing(800) 330-6710 and referencing conference ID 9806728.A live audio webcast of the call, as well as a presentation highlighting the Company’s results, will be available through the Company’s web site, www.stifel.com. For those who cannot listen to the live broadcast, a replay of the broadcast will be available through the above-referenced web site beginning approximately one hour following the completion of the call.

Stifel Financial Corp. (NYSE: SF) is a diversified financial services firm providing wealth management, commercial and investment banking, trading, and research services to individuals, institutions, and municipalities. Founded in 1890 and headquartered in St. Louis, Missouri, the firm operates more than 400 offices across the United States and in major global financial centers. As a firm where success meets success, Stifel works closely with retail and institutional clients aiming to transform opportunities into achievement. To learn more about Stifel, please visit the Company’s website at www.stifel.com. For global disclosures, please visitwww.stifel.com/investor-relations/press- releases.

A financial summary follows. Financial, statistical and business-related information, as well as information regarding business and segment trends, is included in the financial supplement. Both the earnings release and the financial supplement are available online in the Investor Relations section at www.stifel.com/investor-relations.

The information provided herein and in the financial supplement, including information provided on the Company’s earnings conference calls, may include certain non-GAAP financial measures. The definition of such measures or reconciliation of such measures to the comparable U.S. GAAP figures are included in this earnings release and the financial supplement, both of which are available online in the Investor Relations section at www.stifel.com/investor-relations.

This earnings release contains certain statements that may be deemed to be “forward-looking statements” within the meaning of Section 27A of the Securities Act of 1933 and Section 21E of the Securities Exchange Act of 1934. All statements in this earnings release not dealing with historical results are forward-looking and are based on various assumptions. The forward-looking statements in this earnings release are subject to risks and uncertainties that could cause actual results to differ materially from those expressed in or implied by the statements. Factors that may cause actual results to differ materially from those contemplated by such forward-looking statements include, among other things, the following possibilities: the ability to successfully integrate acquired companies or the branch offices and financial advisors; a material adverse change in financial condition; the risk of borrower, depositor, and other customer attrition; a change in general business and economic conditions; changes in the interest rate environment, deposit flows, loan demand, real estate values, and competition; changes in accounting principles, policies, or guidelines; changes in legislation and regulation; other economic, competitive, governmental, regulatory, geopolitical, and technological factors affecting the companies’ operations, pricing, and services; and other risk factors referred to from time to time in filings made by Stifel Financial Corp. with the Securities and Exchange Commission. For information about the risks and important factors that could affect the Company’s future results, financial condition and liquidity, see “Risk Factors” in Part I, Item 1A of the Company’s Annual Report on Form 10-K for the year ended December 31, 2025. Forward-looking statements speak only as to the date they are made. The Company disclaims any intent or obligation to update forward-looking statements to reflect circumstances or events that occur after the date the forward-looking statements are made.

(1) All share and per share information has been retroactively adjusted to reflect the February 2026 three-for-two stock split.

Reconciliations of the Company’s GAAP results to these non-GAAP (3) measures are discussed within and under “Non-GAAP Financial Measures” and “GAAP to Non-GAAP Reconciliation.”

Non-GAAP pre-tax margin is calculated (4) by adding total merger-related expenses (non-GAAP adjustments) and dividing it by non-GAAP net revenues. See “Non-GAAP Financial Measures” and “GAAP to Non-GAAP Reconciliation.”

Return on average common equity (“ROCE”), a non-GAAP financial (5) measure, is calculated by dividing full year or annualized net income applicable to common shareholders by average common shareholders’ equity.

Return on average tangible common equity (“ROTCE”), a non-GAAP financial measure, is calculated by dividing full year or annualized net income applicable to common shareholders by average tangible common equity. Tangible common equity, also a non-GAAP financial measure, (6) equals total common shareholders’ equity less goodwill and identifiable intangible assets and the deferred taxes on goodwill and intangible assets. Average deferred taxes on goodwill and intangible assets were $95.0 million and $87.2 million as of September 30, 2026, and 2025, respectively.

Total client assets and fee-based client assets as of September 30, 2025, (7) include $10.2 billion and $4.8 billion, respectively, of client assets from the Stifel Independent Advisors business that was sold on February 2, 2026.

Tangible book value per common share, a non-GAAP financial measure, represents shareholders’ equity (excluding preferred stock) divided by period end (9) common shares outstanding. Tangible common shareholders’ equity equals total common shareholders’ equity less goodwill and identifiable intangible assets and the deferred taxes on goodwill and intangible assets.

(10) Capital ratios are estimates at the time of the Company’s earnings release, October 21, 2026.

The Company prepares its Consolidated Financial Statements using accounting principles generally accepted in the United States (U.S. GAAP). The Company may disclose certain “non-GAAP financial measures” during its earnings releases, earnings conference calls, financial presentations and otherwise. The Securities and Exchange Commission defines a “non-GAAP financial measure” as a numerical measure of historical or future financial performance, financial position, or cash flows that is subject to adjustments that effectively exclude, or include, amounts from the most directly comparable measure calculated and presented in accordance with U.S. GAAP. Non-GAAP financial measures disclosed by the Company are (11) provided as additional information to analysts, investors and other stakeholders in order to provide them with greater transparency about, or an alternative method for assessing the Company’s financial condition or operating results. These measures are not in accordance with, or a substitute for U.S. GAAP, and may be different from or inconsistent with non-GAAP financial measures used by other companies. Whenever the Company refers to a non-GAAP financial measure, it will also define it or present the most directly comparable financial measure calculated and presented in accordance with U.S. GAAP, along with a reconciliation of the differences between the non-GAAP financial measure it references and such comparable U.S. GAAP financial measure.

(12) Gain recognized on the sale of Stifel Independent Advisors, LLC during the first quarter of 2026.

Primarily related to charges attributable to integration-related activities, signing bonuses, amortization of restricted stock awards, debentures, and promissory notes issued as (14) retention, additional earn-out expense, and amortization of intangible assets acquired. These costs were directly related to acquisitions of certain businesses and are not representative of the costs of running the Company’s on-going business.

(15) The Company recorded severance costs associated with workforce reductions in certain of its foreign subsidiaries.

(16) Primarily represents the Company’s effective tax rate for the period applied to the non-GAAP adjustments.

Full text with the tables
Exhibit 99.1 Stifel
Reports Third Quarter 2026
Results ST. LOUIS, MO,
October 21, 2026– Stifel
Financial Corp. (NYSE: SF)
today reported net
revenues of $1.43 billion
for the three months ended
September 30, 2026,
compared with $1.43
billion a year ago. Net
income available to common
shareholders was $224.8
million, or $1.40 per
diluted common share,
compared with $202.1
million, or $1.22 per
diluted common share
(1)for the third quarter
of 2025. Non-GAAPnet
income available to common
shareholders was $234.1
million, or $1.46 per
diluted common share for
the third quarter of 2026.
Ronald J. Kruszewski,
Chairman and Chief
Executive Officer, said
“Stifel is on track for
another record year, with
year-to-date revenue of
$4.3 billion up 9%, core
earnings per share of
$4.33 up 22%, and return
on tangible common equity
of 24.1%. The investments
we’ve made in our business
continued to drive
operating efficiencies, as
we delivered our highest
ever third quarter
earnings per share of
$1.46, up 12% versus the
prior year, on net revenue
of $1.43 billion. I am
optimistic about our
outlook, as Stifel’s
diversified business
model, recurring revenue
stream, and disciplined
capital management
position us to keep
compounding value for
shareholders.”

Highlights
                                                                                
  The Company reported net revenues of $1.43 billion, the second best third     
  quarter in its history, driven by higher asset management                     
  revenues and net interest income.                                             
                                                                                
                                                                                
  Non-GAAP net income available to common shareholders of $1.46 per diluted     
  common                                                                        
  share, the best third quarter in its history.                                 
                                                                                
                                                    
  Asset management revenues increased 14% over the  
  year-ago quarter.                                 
                                                    
                                                      
  Net interest income increased 9% over the year ago  
  quarter.                                            
                                                      
                                              
  Bank loans increased 21% over the year ago  
  quarter.                                    
                                              
                                                   
  Client assets of $576.5 billion, up 6% over the  
  year-ago quarter.                                
                                                   
                                                     
  Over the last twelve months, recruited trailing    
  twelve-month production totaled approximately $19  
  million.                                           
                                                     
                                     
  Non-GAAP pre-tax margin of 22.5%.  
                                     
                                                              
  Annualized return on tangible common equity (ROTCE) (6) of  
  23.9%.                                                      
                                                              
                                                                   
  Tangible book value per common share (9) of $26.05, up 12% from  
  prior year.                                                      
                                                                   
                                                                                
  The Company repurchased $124.0 million, or 1.6 million shares, of its         
  outstanding common stock during the third                                     
  quarter at an average price of $76.95.                                        
                                                                                
                                          
  Announced strategic investment in Meow  
  Technologies.                           
                                          
                                                                                
  Fina…                                                                         
  Summ…                                                                         
  (Una…                                                                         
  (000…    3Q                3Q                9m                9m             
           2026              2025              2026              2025           
  GAAP                                                                          
  Fina…                                                                         
  High…                                                                         
  Net              $1,42…            $1,42…            $4,35…           $3,96…  
  reve…                                                                         
  Net                                                                           
  inco…            $224,…            $202,…            $684,…           $391,…  
  (2)                                                                           
  Dilu…                                                                         
  EPS               $1.40             $1.22             $4.23            $2.37  
  (1)                                                                           
  (2)                                                                           
  Comp.             57.0%             58.8%             57.3%            59.1%  
  ratio                                                                         
  Non-…             21.3%             21.2%             21.2%            26.7%  
  ratio                                                                         
  Pre-…             21.7%             20.0%             21.5%            14.2%  
  marg…                                                                         
  Non-…                                                                         
  Fina…                                                                         
  High…                                                                         
  Net              $1,42…            $1,42…            $4,32…           $3,96…  
  reve…                                                                         
  Net                                                                           
  inco…            $234,…            $214,…            $700,…           $454,…  
  (2)                                                                           
  (3)                                                                           
  Dilu…                                                                         
  EPS                                                                           
  (1)               $1.46             $1.30             $4.33            $2.76  
  (2)                                                                           
  (3)                                                                           
  Comp.                                                                         
  ratio             56.6%             58.0%             57.0%            58.0%  
  (3)                                                                           
  Non-…                                                                         
  ratio             20.9%             20.8%             20.9%            25.9%  
  (3)                                                                           
  Pre-…                                                                         
  marg…             22.5%             21.2%             22.1%            16.1%  
  (4)                                                                           
  ROCE              17.4%             17.0%             17.5%            12.2%  
  (5)                                                                           
  ROTCE             23.9%             24.3%             24.1%            17.3%  
  (6)                                                                           
  Glob…                                                                         
  Weal…                                                                         
  Mana…                                                                         
  (ass…                                                                         
  and                                                                           
  loans                                                                         
  in                                                                            
  mill…                                                                         
  Net              $980,…            $907,…            $2,86…           $2,60…  
  reve…                                                                         
  Pre-…                                                                         
  net              $374,…            $342,…            $1,06…           $775,…  
  inco…                                                                         
  Total                                                                         
  clie…            $576,…            $544,…                                     
  asse…                                                                         
  (7)                                                                           
  Fee-…                                                                         
  clie…            $239,…            $219,…                                     
  asse…                                                                         
  (7)                                                                           
  Bank                                                                          
  loans            $26,0…            $21,6…                                     
  (8)                                                                           
  Inst…                                                                         
  Group                                                                         
  Net              $430,…            $500,…            $1,40…           $1,30…  
  reve…                                                                         
  Equi…            $282,…            $296,…            $915,…           $753,…  
  Fixed            $147,…            $203,…            $490,…           $552,…  
  Inco…                                                                         
  Pre-…                                                                         
  net              $76,2…            $89,2…            $266,…           $177,…  
  inco…                                                                         
                                                                                
Media Contact: Neil Shapiro(212)
271-3447 | InvestorContact: Joel
Jeffrey (212) 271-3610|
www.stifel.com/investor-relations

Global Wealth Management Global Wealth
Management reported record net
revenues of $980.3 million for the
three months ended September 30, 2026,
compared with $907.4 million during
the third quarter of 2025. Pre-taxnet
income was $374.4 million compared
with $342.7 million in the third
quarter of 2025.

Highlights
                                                                                
  Client assets of $576.5 billion, up 6% over the year-ago quarter, which       
  included $10.2 billion of client assets from the Stifel Independent Advisors  
  business that was sold on February 2, 2026.                                   
                                                                                
                                                    
  Fee-based client assets of $239.7 billion, up 9%  
  over the year-ago quarter, which included $4.8    
  billion of client assets from the Stifel          
  Independent Advisors business that was sold on    
  February 2, 2026.                                 
                                                    
                                                     
  Over the last twelve months, recruited trailing    
  twelve-month production totaled approximately $19  
  million.                                           
                                                     
Net revenues increased 8% from a year
ago:
                                                                               
  Transactional revenues decreased 3% over the year-ago quarter, reflecting a  
  decrease in client activity.                                                 
                                                                               
                                                                                
  Asset management revenues increased 14% over the year-ago quarter,            
  reflecting                                                                    
  higher asset values due to improved market conditions and net new asset       
  growth.                                                                       
                                                                                
                                                                                
  Net interest income increased 11% over the year-ago quarter primarily driven  
  by                                                                            
  balance sheet growth, partially offset by lower interest rates.               
                                                                                
Total Expenses:
                                                                                
  Compensation expense as a percentage of net revenues increased modestly to    
  48.8% primarily driven by higher                                              
  revenue-related compensation, partially offset by revenue growth.             
                                                                                
                                                                                
  Provision for credit losses decreased from a year ago primarily as a result   
  of a modest improvement in macroeconomic                                      
  conditions, partially offset by loan growth in the retained portfolio and     
  specific reserves on individual credits.                                      
                                                                                
                                                                                
  Non-compensation operating expenses as a percentage of net revenues           
  decreased to                                                                  
  13.0% primarily attributable to lower litigation-related expenses, a          
  decrease in the provision for credit losses, and revenue growth over the      
  year-ago quarter.                                                             
                                                                                
                                                                          
  Summary                                                                 
  Results of Operations                                                   
  (000s)                          3Q 2026              3Q 2025            
  Net revenues                             $980,293             $907,440  
  Transactional revenues                    196,213              203,078  
  Asset management                          492,123              431,363  
  Net interest income                       284,583              257,327  
  Investment banking                          6,731                6,529  
  Other                                         643                9,143  
  income                                                                  
  Total expenses                           $605,885             $564,790  
  Compensation expense                      478,877              441,626  
  Provision for credit losses                 7,926                8,316  
  Non-comp. operating expenses              119,082              114,848  
  Pre-tax net income                       $374,408             $342,650  
  Compensation ratio                          48.8%                48.7%  
  Non-compensation ratio                      13.0%                13.5%  
  Pre-tax margin                              38.2%                37.8%  
                                                                          
Stifel Financial Corp. | Page 2

Institutional Group Institutional
Group reported net revenues of $430.3
million for the three months ended
September 30, 2026, compared with
$500.4 million during the third
quarter of 2025. Pre-taxnet income was
$76.3 million compared with $89.3
million in the third quarter of 2025.

Highlights Investment banking revenues
decreased 6% from a year ago:
                                                                                
  Advisory revenues decreased 4% from the year-ago quarter, driven by lower     
  levels                                                                        
  of completed advisory transactions.                                           
                                                                                
                                                                                
  Equity capital raising revenues decreased 13% from the year-ago quarter,      
  driven by                                                                     
  lower volumes and smaller deal sizes.                                         
                                                                                
                                                                                
  Fixed income capital raising revenues decreased 2% over the year-ago quarter  
  primarily driven by lower bond issuances.                                     
                                                                                
Fixed income transactional revenues
decreased 34% from a year ago:
                                                                                
  Fixed income transactional revenues were impacted by widening credit          
  spreads, increased market volatility, and lower                               
  realized trading gains during the quarter.                                    
                                                                                
Equity transactional revenues
decreased 29% from a year ago:
                                                      
  Equity transactional revenues were impacted by      
  lower realized trading gains, a decline in trading  
  volumes over the year-ago quarter and the           
  restructuring of our European Equities business,    
  which resulted in a $7 million reduction in equity  
  transactional revenues year over year.              
                                                      
Total Expenses:
                                                                                
  Compensation expense as a percentage of net revenues decreased to 58.7%       
  primarily attributable to lower revenue-related                               
  compensation due to a decline in revenues from the year ago quarter.          
                                                                                
                                                                                
  Non-compensation operating expenses as a percentage of net revenues           
  increased to                                                                  
  23.6% primarily attributable to a decline in revenues from the year ago       
  quarter.                                                                      
                                                                                
                                                                          
  Summary                                                                 
  Results of Operations                                                   
  (000s)                          3Q 2026              3Q 2025            
  Net revenues                             $430,281             $500,435  
  Investment banking                        299,472              316,954  
  Advisory                                  173,017              179,270  
  Equity capital raising                     68,556               78,765  
  Fixed income capital raising               57,899               58,919  
  Fixed income transactional                 80,472              122,567  
  Equity transactional                       41,195               58,306  
  Other                                       9,142                2,608  
  Total expenses                           $354,020             $411,144  
  Compensation expense                      252,656              297,106  
  Non-comp. operating expenses              101,364              114,038  
  Pre-tax net income                        $76,261              $89,291  
  Compensation ratio                          58.7%                59.4%  
  Non-compensation ratio                      23.6%                22.8%  
  Pre-tax margin                              17.7%                17.8%  
                                                                          
Stifel Financial Corp. | Page 3

Other Matters

Highlights
                                                    
  Total assets increased $3.6 billion, or 9%, from  
  the year-ago quarter.                             
                                                    
                                                                                
  Over the last twelve months, the Company repurchased $564.4 million, or 7.3   
  million shares, of its outstanding                                            
  common stock at an average price of $77.05.                                   
                                                                                
                                                 
  Weighted average diluted shares outstanding    
  decreased primarily due to share repurchases.  
                                                 
                                                                                
  The Board of Directors declared a $0.34 quarterly dividend per share,         
  payable on September 15, 2026, to common                                      
  shareholders of record on September 1, 2026.                                  
                                                                                
                                                                                
  The Board of Directors declared a quarterly dividend on the outstanding       
  shares of the Company’s preferred stock,                                      
  payable on September 15, 2026, to shareholders of record on September 1,      
  2026.                                                                         
 ────────────────────────────────────────────────────────────────────────────── 
                                                                                
                                                                            
                                     3Q 2026              3Q 2025           
  Common stock repurchases (1)                                              
  Repurchases (000s)                          $124,005             $33,086  
  Number of shares (000s)                        1,612                 438  
  Average price                                 $76.95              $75.57  
  Period end shares (000s)                     150,061             152,922  
  Weighted average diluted shares              160,145             165,087  
  outstanding (000s)                                                        
  Effective tax                                  24.4%               26.1%  
  rate                                                                      
  Stifel Financial Corp. (10)                                               
  Tier 1 common capital ratio                   `14.5%               14.8%  
  Tier 1 risk-based capital ratio                17.0%               17.6%  
  Tier 1 leverage capital ratio                  10.8%               11.1%  
  Tier 1 capital (MM)                           $4,665              $4,267  
  Risk weighted assets (MM)                    $27,450             $24,235  
  Average assets (MM)                          $43,060             $38,332  
  Quarter end                                  $45,282             $41,687  
  assets (MM)                                                               
  Agency                             Rating               Outlook           
  Fitch Ratings                                   BBB+              Stable  
  S&P                                              BBB              Stable  
  Global Ratings                                                            
                                                                            
Conference Call Information Stifel Financial Corp. | Page 4

Stifel Financial Corp. will host its third quarter 2026 financial results
conference call on Wednesday, October21, 2026, at 9:30 a.m. Eastern Time.The
conference call may include forward-looking statements.

All interested parties are invited to listen
to Stifel’s Chairman and CEO, Ronald J. Kruszewski, by dialing(800) 330-6710 and
referencing conference ID 9806728.A live audio webcast of the call, as well as a
presentation highlighting
the Company’s results, will be available through the Company’s web site,
www.stifel.com. For those who cannot listen to the live broadcast, a replay of
the broadcast will be available through the above-referenced web site beginning
approximately one hour following the completion of the call.

Company Information

Stifel Financial Corp. (NYSE: SF) is a diversified financial services firm
providing wealth management, commercial and investment banking,
trading, and research services to individuals, institutions, and municipalities.
Founded in 1890 and headquartered in St. Louis, Missouri, the firm operates more
than 400 offices across the United States and in major global financial centers.
As a
firm where success meets success, Stifel works closely with retail and
institutional clients aiming to transform opportunities into achievement. To
learn more about Stifel, please visit the Company’s website at www.stifel.com.
For global disclosures, please visitwww.stifel.com/investor-relations/press-
releases.

A financial summary follows. Financial, statistical and business-related
information, as well as information regarding business and segment trends, is
included in the financial supplement. Both the earnings release and the
financial supplement are available online in the Investor Relations section at
www.stifel.com/investor-relations.

The information provided herein and in the financial supplement, including
information provided on the Company’s earnings conference calls, may
include certain non-GAAP financial measures. The definition of such measures or
reconciliation of such measures to the comparable U.S. GAAP figures are included
in this earnings release and the financial
supplement, both of which are available online in the Investor Relations section
at www.stifel.com/investor-relations.

Cautionary Note Regarding Forward-Looking Statements

This earnings release contains certain statements that may be deemed to be
“forward-looking statements” within the meaning of
Section 27A of the Securities Act of 1933 and Section 21E of the Securities
Exchange Act of 1934. All statements in this earnings release not dealing with
historical results are forward-looking and are based on various assumptions. The
forward-looking statements in this earnings release are subject to risks and
uncertainties that could cause actual results to differ materially from those
expressed in or implied by the statements. Factors that may cause actual results
to differ
materially from those contemplated by such forward-looking statements include,
among other things, the following possibilities: the ability to successfully
integrate acquired companies or the branch offices and financial advisors; a
material adverse
change in financial condition; the risk of borrower, depositor, and other
customer attrition; a change in general business and economic conditions;
changes in the interest rate environment, deposit flows, loan demand, real
estate values, and
competition; changes in accounting principles, policies, or guidelines; changes
in legislation and regulation; other economic, competitive, governmental,
regulatory, geopolitical, and technological factors affecting the companies’
operations,
pricing, and services; and other risk factors referred to from time to time in
filings made by Stifel Financial Corp. with the Securities and Exchange
Commission. For information about the risks and important factors that could
affect the
Company’s future results, financial condition and liquidity, see “Risk Factors”
in Part I, Item 1A of the Company’s Annual Report on Form 10-K for the year
ended December 31, 2025.
Forward-looking statements speak only as to the date they are made. The Company
disclaims any intent or obligation to update forward-looking statements to
reflect circumstances or events that occur after the date the forward-looking
statements are
made.

Stifel Financial Corp. | Page 5

Summary Results of Operations (Unaudited)
                                                                                
       T…                                              …                        
       M…                                              …                        
       E…                                              …                        
  …                                                                             
  …                        %                  %                          %      
  …    9…        9…        C…        …        …        …        …        …      
  …                                                                             
  …                                                                             
  …                                                                             
  …         $         $        -…        $       -…        $        $       4…  
           2…        2…                 2…                6…       6…           
  …        1…        1…        -…       1…       -…       4…       4…       -…  
  …                                                                             
  …        3…        3…        -…       3…       -…       9…       7…       2…  
  …                                                                             
  …        4…        4…        1…       4…       7…       1…       1…       1…  
  …                                                                             
  …        8…        1…        -…       1…       -…       7…       2…       1…  
  …                                                                             
  …        1…        1…        -…       1…       -…       3…       3…       1…  
  …                                                                             
  …        5…        4…        6…       4…       7…       1…       1…       0…  
  …                                                                             
  …        1…        1…        0…       1…       -…       4…       4…       7…  
  …                                                                             
  …        2…        2…        1…       1…       1…       5…       6…       -…  
  …                                                                             
  …        1…        1…        -…       1…       -…       4…       3…       9…  
  …                                                                             
  …                                                                             
  …                                                                             
  …                                                                             
  …        8…        8…        -…       8…       -…       2…       2…       6…  
  …                                                                             
  …                                                                             
  …        3…        3…        -…       3…       -…       9…       1…       -…  
  …                                                                             
  …                                                                             
  …        1…        1…        -…       1…       -…       3…       3…       0…  
  …                                                                             
  …                                                                             
  …        3…        2…        8…       2…       3…       9…       5…       6…  
  …                                                                             
  …                                                                             
  …                                                                             
  …        7…        7…        1…       7…       3…       2…       1…       5…  
  …                                                                             
  …                                                                             
  …        2…        2…        1…       2…       3…       7…       4…       6…  
  …                                                                             
  …        9…        9…        0…       9…       -…       2…       2…       0…  
  …                                                                             
  …                                                                             
  …                                                                             
  …        $…        $…        1…       $…       3…       $…       $…       7…  
  …                                                                             
  …                                                                             
  …                                                                             
  …                                                                             
  …                                                                             
  …                                                                             
  …                                                                             
  …                                                                             
  …        $…        $…        1…       $…       5…       $…       $…       7…  
  …        $…        $…        1…       $…       4…       $…       $…       7…  
  …                                                                             
  …                                                                             
  …                                                                             
  …        $…        $…        9…       $…       0…       $…       $…       9…  
  …                                                                             
  …                                                                             
  …                                                                             
  …                                                                             
  …                                                                             
  …                                                                             
  …                                                                             
  …                                                                             
  …                                                                             
  …                                                                             
  …                                                                             
  …        1…        1…        -…       1…       -…       1…       1…       -…  
  …        1…        1…        -…       1…       -…       1…       1…       -…  
                                                                                
Stifel Financial Corp. | Page 6

Non-GAAPFinancial Measures (11)
                                                                                
           Three                               Nine                             
           Months                              Months                           
           Ended                               Ended                            
  (000…                                                                         
  exce…                                                                         
  per      9/30/…            9/30/…            9/30/…            9/30/…         
  share                                                                         
  amou…                                                                         
  GAAP                                                                          
  net              234,1…            $211,…            712,0…            $419…  
  inco…                                                                         
  Pref…             9,320             9,320            27,961            27,9…  
  divi…                                                                         
  Net                                                                           
  inco…                                                                         
  avai…            224,8…            202,0…            684,0…            391,…  
  to                                                                            
  comm…                                                                         
  shar…                                                                         
  Non-…                                                                         
  adju…                                                                         
  Net                                                                           
  reve…                                                                         
  adju…             2,866                 2            -31,2…               80  
  (12)                                                                          
  (13)                                                                          
  Merg…             8,219            12,676            50,090            45,6…  
  (14)                                                                          
  Rest…                                                                         
  and               1,174             4,065             3,504            31,1…  
  seve…                                                                         
  (15)                                                                          
  Prov…                                                                         
  for                                                                           
  inco…            -2,986            -4,375            -5,527            -13,…  
  taxes                                                                         
  (16)                                                                          
  Total                                                                         
  non-…             9,273            12,368            16,794            62,8…  
  adju…                                                                         
  Non-…                                                                         
  net                                                                           
  inco…                                                                         
  avai…            $234,…            $214,…            $700,…            $454…  
  to                                                                            
  comm…                                                                         
  shar…                                                                         
  Weig…                                                                         
  aver…                                                                         
  dilu…            160,1…            165,0…            161,7…            164,…  
  shar…                                                                         
  outs…                                                                         
  (1)                                                                           
  GAAP                                                                          
  earn…                                                                         
  per                                                                           
  dilu…             $1.46             $1.28             $4.41            $2.53  
  comm…                                                                         
  share                                                                         
  (1)                                                                           
  Non-…                                                                         
  adju…              0.06              0.08              0.10             0.39  
  (1)                                                                           
  Non-…                                                                         
  earn…                                                                         
  per                                                                           
  dilu…             $1.52             $1.36             $4.51            $2.92  
  comm…                                                                         
  share                                                                         
  (1)                                                                           
  GAAP                                                                          
  earn…                                                                         
  per                                                                           
  dilu…                                                                         
  comm…                                                                         
  share             $1.40             $1.22             $4.23            $2.37  
  avai…                                                                         
  to                                                                            
  comm…                                                                         
  shar…                                                                         
  (1)                                                                           
  Non-…                                                                         
  adju…              0.06              0.08              0.10             0.39  
  (1)                                                                           
  Non-…                                                                         
  earn…                                                                         
  per                                                                           
  dilu…                                                                         
  comm…                                                                         
  share             $1.46             $1.30             $4.33            $2.76  
  avai…                                                                         
  to                                                                            
  comm…                                                                         
  shar…                                                                         
  (1)                                                                           
                                                                                
Stifel Financial Corp. | Page 7

GAAP to Non-GAAPReconciliation (11)
                                                                                
           Three                               Nine                             
           Months                              Months                           
           Ended                               Ended                            
  (000…    9/30/…            9/30/…            9/30/…            9/30…          
  GAAP                                                                          
  net              $1,42…            $1,42…            $4,35…           $3,96…  
  reve…                                                                         
  Non-…                                                                         
  adju…                                                                         
  Gain                                                                          
  on                                                                            
  sale              2,866                 —            -44,4…                —  
  of                                                                            
  busi…                                                                         
  (12)                                                                          
  Liti…                                                                         
  and                   —                 2            13,145               80  
  other                                                                         
  (13)                                                                          
  Total                                                                         
  non-…             2,866                 2            -31,2…               80  
  adju…                                                                         
  Non-…                                                                         
  net              $1,42…            $1,42…            $4,32…           $3,96…  
  reve…                                                                         
  GAAP                                                                          
  comp…            $813,…            $839,…            $2,49…           $2,34…  
  and                                                                           
  bene…                                                                         
  As a                                                                          
  perc…                                                                         
  of                57.0%             58.8%             57.3%            59.1%  
  net                                                                           
  reve…                                                                         
  Non-…                                                                         
  adju…                                                                         
  Merg…            -3,463            -6,704            -25,2…           -13,7…  
  (14)                                                                          
  Rest…                                                                         
  and              -1,174            -4,065            -3,504           -31,1…  
  seve…                                                                         
  (15)                                                                          
  Total                                                                         
  non-…            -4,637            -10,7…            -28,7…           -44,8…  
  adju…                                                                         
  Non-…                                                                         
  comp…            $808,…            $829,…            $2,46…           $2,30…  
  and                                                                           
  bene…                                                                         
  As a                                                                          
  perc…                                                                         
  of                56.6%             58.0%             57.0%            58.0%  
  non-…                                                                         
  net                                                                           
  reve…                                                                         
  GAAP                                                                          
  non-…            $303,…            $303,…            $925,…           $1,05…  
  expe…                                                                         
  As a                                                                          
  perc…                                                                         
  of                21.3%             21.2%             21.2%            26.7%  
  net                                                                           
  reve…                                                                         
  Non-…                                                                         
  adju…                                                                         
  Merg…            -4,756            -5,972            -24,8…           -31,9…  
  (14)                                                                          
  Non-…                                                                         
  non-…            $298,…            $297,…            $900,…           $1,02…  
  expe…                                                                         
  As a                                                                          
  perc…                                                                         
  of                20.9%             20.8%             20.9%            25.9%  
  non-…                                                                         
  net                                                                           
  reve…                                                                         
  Total                                                                         
  adju…                                                                         
  befo…            $12,2…            $16,7…            $22,3…           $76,8…  
  inco…                                                                         
  taxes                                                                         
                                                                                
Stifel Financial Corp. | Page 8

Footnotes
                                                                                
  (1)  All share and per share information has been retroactively adjusted to   
       reflect the February 2026 three-for-two stock split.                     
                                                                                
                                                     
  (2)  Represents available to common shareholders.  
                                                     
                                                                                
       Reconciliations of the Company’s GAAP results to these non-GAAP          
  (3)  measures                                                                 
       are discussed within and under “Non-GAAP Financial Measures” and “GAAP   
       to Non-GAAP Reconciliation.”                                             
                                                                                
                                                                                
       Non-GAAP pre-tax margin is calculated                                    
  (4)  by adding total merger-related expenses (non-GAAP adjustments) and       
       dividing it by non-GAAP net revenues. See “Non-GAAP                      
       Financial Measures” and “GAAP to Non-GAAP Reconciliation.”               
                                                                                
                                                                                
       Return on average common equity (“ROCE”), a non-GAAP financial           
  (5)  measure, is calculated by dividing full year or annualized net income    
       applicable to common shareholders by average common shareholders’        
       equity.                                                                  
                                                                                
                                                                                
       Return on average tangible common equity (“ROTCE”), a non-GAAP           
       financial measure, is calculated by dividing full year or annualized     
       net income applicable to common shareholders by average tangible common  
       equity. Tangible common equity, also a non-GAAP financial measure,       
  (6)  equals total common shareholders’ equity less goodwill and identifiable  
       intangible assets and the deferred taxes on goodwill and intangible      
       assets. Average deferred taxes on goodwill and intangible assets were    
       $95.0 million and                                                        
       $87.2 million as of September 30, 2026, and 2025, respectively.          
                                                                                
                                                                                
       Total client assets and fee-based client assets as of September 30,      
       2025,                                                                    
  (7)  include $10.2 billion and $4.8 billion, respectively, of client assets   
       from the Stifel Independent Advisors business that was sold on February  
       2, 2026.                                                                 
                                                                                
                                      
  (8)  Includes loans held for sale.  
                                      
                                                                                
       Tangible book value per common share, a non-GAAP financial measure,      
       represents                                                               
       shareholders’ equity (excluding preferred stock) divided by period end   
  (9)  common shares outstanding. Tangible common shareholders’ equity equals   
       total common shareholders’ equity less goodwill and identifiable         
       intangible assets and                                                    
       the deferred taxes on goodwill and intangible assets.                    
                                                                                
                                                                                
  (10)  Capital ratios are estimates at the time of the Company’s earnings      
        release, October 21, 2026.                                              
                                                                                
                                                                                
        The Company prepares its Consolidated Financial Statements using        
        accounting principles generally accepted in the United                  
        States (U.S. GAAP). The Company may disclose certain “non-GAAP          
        financial measures” during its earnings releases, earnings conference   
        calls, financial presentations and otherwise. The Securities and        
        Exchange Commission defines a “non-GAAP financial measure” as a         
        numerical measure of historical or future financial performance,        
        financial position, or cash flows that is subject to adjustments        
        that effectively exclude, or include, amounts from the most directly    
        comparable measure calculated and presented in accordance with U.S.     
        GAAP. Non-GAAP financial measures disclosed by the Company are          
  (11)  provided                                                                
        as additional information to analysts, investors and other              
        stakeholders in order to provide them with greater transparency about,  
        or an alternative method for assessing the Company’s financial          
        condition or operating results. These measures are                      
        not in accordance with, or a substitute for U.S. GAAP, and may be       
        different from or inconsistent with non-GAAP financial measures used    
        by other companies. Whenever the Company refers to a non-GAAP           
        financial measure, it will also define it or present the most directly  
        comparable financial measure calculated and presented in accordance     
        with U.S. GAAP, along with a reconciliation of the differences          
        between the non-GAAP financial measure it references and such           
        comparable U.S. GAAP financial measure.                                 
                                                                                
                                                                                
  (12)  Gain recognized on the sale of Stifel Independent Advisors, LLC during  
        the first quarter of 2026.                                              
                                                                                
                                                                                
  (13)  Primarily related to prejudgment interest recognized on legal matters.  
                                                                                
                                                                                
        Primarily related to charges attributable to integration-related        
        activities, signing bonuses, amortization of                            
        restricted stock awards, debentures, and promissory notes issued as     
  (14)  retention, additional earn-out expense, and amortization of intangible  
        assets acquired. These costs were directly related to acquisitions of   
        certain businesses and are not representative of the costs of running   
        the Company’s on-going business.                                        
                                                                                
                                                                                
  (15)  The Company recorded severance costs associated with workforce          
        reductions in certain of its foreign subsidiaries.                      
                                                                                
                                                                                
  (16)  Primarily represents the Company’s effective tax rate for the period    
        applied to the non-GAAP adjustments.                                    
                                                                                
Stifel Financial Corp. | Page 9

Sources

The 8-K item 2.02 filings (SEC EDGAR) and their EX-99 exhibits: the results release and, when filed, prepared remarks or the call transcript.

Also

Said vs did: the targets in these releases against what was then reported. Filings: every filing.

Work with it

Excel workbook · CSV. Google Sheet that stays up to date: paste =IMPORTDATA("https://tickdelta.com/company/SF/export.csv") into a cell.

Next:Presentations
Esc

Type a ticker such as AAPL, a name, an investor such as Buffett, or a topic such as tariffs. ↑ ↓ to move, Enter to open.