Stryker Corporation SYK
- Employees
- 56,000
- Headquarters
- Portage, MI
- Next results
- around Jan 28, 2027
Where each dollar of revenue went, FY2025
Revenue of $25.1B through the costs to a net profit of $3.2B · income statement of the 10-K
SYK among Health care peers
Six ratios from the latest 10-K. Each corner is the share of 59 peers the company is above, not a score.
What changed
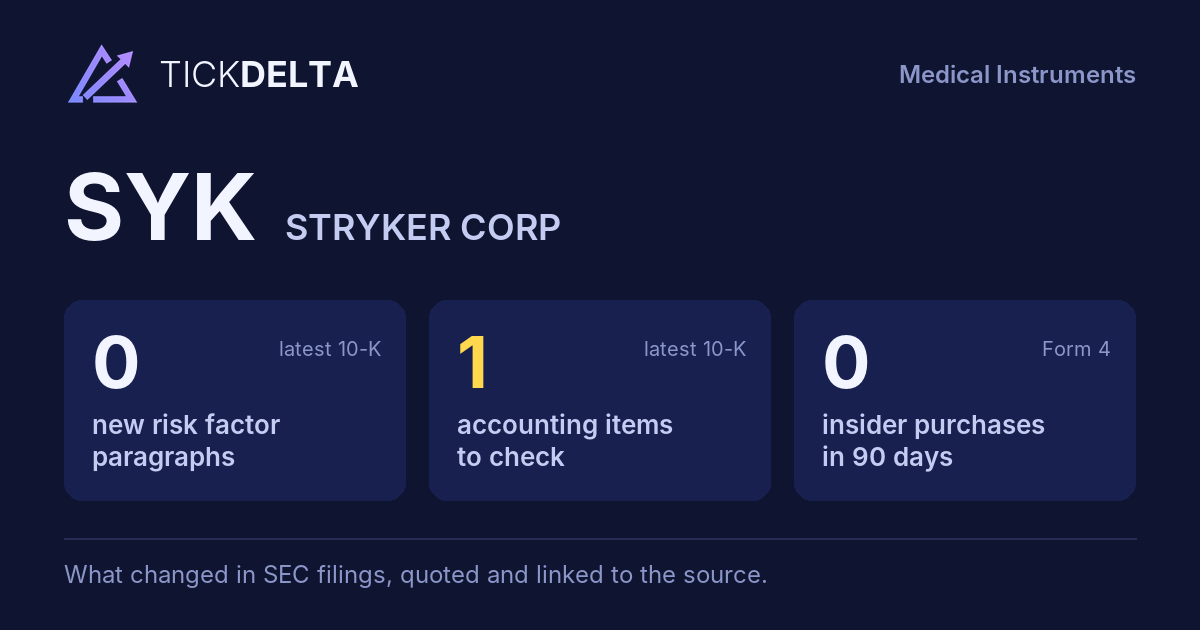
1 accounting fact worth reading about.
Each row opens the detail with the quote and the filing. A row is a change worth reading, not a verdict.
Accounting checks
11 checks on the latest 10-K. Checks, not verdicts.
1fact worth reading about the other 10 checks found nothing to note
-
Critical audit matters changedNew this year: Description As described in Note 11 to the consolidated financial statements, the Company is involved in various income tax matters; Auditing management’s evaluation of the uncertain tax positions associated with the FCTO tax assessments was; How We We obtained an understanding, evaluated the design and tested the operating effectiveness of controls over the; Addressed Company’s accounting process for uncertain tax positions. For example, we tested controls over management’s; Our audit procedures included, among others, evaluating the assumptions the Company used to assess its uncertain tax; Acquisitions; Description As described in Note 6 to the consolidated financial statements, in 2025 the Company completed the acquisition of Inari; How We We obtained an understanding, evaluated the design and tested the operating effectiveness of the controls over the; Addressed identification and measurement of developed technologies. For example, we tested controls over the valuation of; Our Audit To test the fair value measurement of developed technologies, we performed audit procedures that included, among. Same as last year: Uncertain Tax Positions
-
Receivables +1.3% vs revenue +11.2% (-9.9 pts)
9 more checks with nothing to note
-
Cash from operations $5.0B vs net income $3.2B (FY ending Dec 31, 2025)
-
Inventory +11.2% vs revenue +11.2% (+0.1 pts)
-
Same auditor in both 10-Ks: Ernst & Young LLP
-
No statement of substantial doubt about going concern
-
No 8-K item 4.02 in the last 2 years
-
No NT 10-K or NT 10-Q in the last 2 years
-
No sentence in the 10-K concludes that controls were not effective because of a material weakness
-
No 8-K item 2.06 in the last 2 years
-
No 8-K item 1.03 in the last 2 years
In their words
No new paragraphs in Risk Factors
No new paragraphs in Risk Factors, or fewer than two 10-Ks to compare.
Financial performance
Last 4 fiscal years · 10-K XBRL
| Metric | FY2022 | FY2023 | FY2024 | FY2025 |
|---|---|---|---|---|
| Revenue | $18.4B | $20.5B | $22.6B | $25.1B |
| Net income | $2.4B | $3.2B | $3.0B | $3.2B |
| Operating cash flow | $2.6B | $3.7B | $4.2B | $5.0B |
| Free cash flow | $2.0B | $3.1B | $3.5B | $4.3B |
Revenue, FY2016 to FY2025
Ten fiscal years, each from its own 10-K · XBRL · USD
$25.1B ▲ 11.2% in FY2025$3.2B ▲ 8.5% in FY2025$4.3B ▲ 22.8% in FY2025
Recent filings
5 filings in the last 30 days · SEC EDGAR
-
8-KNov 9, 2026Director or officer change, Regulation FD disclosure 8-K items 5.02, 7.01
-
Planned saleNov 5, 2026STRYKER RONDA E (Director) gave notice of a planned sale of 550,000 shares worth about $186.8M Form 144, approximate sale date Nov 6, 2026
-
OfferingNov 4, 2026Shelf registration: shares and other securities, amount not fixed S-3ASR · We may offer and sell from time to time, in one or more offerings, in amounts, at prices and on terms determined at the time of any such offering, (1) shares of our common stock, (2) shares of our preferred stock, which we may issue in one or more series, (3) debt securities, which may be senior deb
-
10-QOct 30, 2026Quarterly report (10-Q) period ended Sep 30, 2026
-
8-KOct 29, 2026Quarterly results 8-K item 2.02
About the company
Stryker Corporation, Portage, MI · from the 10-K filed Feb 11, 2026
Net Sales by Reportable Segment 2025 2024 2023 MedSurg and $15,647 62% $13,518 60% $12,163 59% Neurotechnology Orthopaedics 9,469 38 9,077 40 8,335 41 Total $25,116 100% $22,595 100% $20,498 100% Composition of MedSurg and Neurotechnology Net Sales 2025 2024 2023 Instruments $3,183 20% $2,834 21% $2,534 21% Endoscopy 3,807 24 3,389 25 3,068 25 Medical 4,204 27 3,852 28 3,459 28 Vascular 1,968 13 1,307 10 1,226 11 Neuro Cranial 2,485 16 2,136 16 1,876 15 Total $15,647 100% $13,518 100% $12,163 100%
- Headquarters
- Portage, MI
- Country
- United States
- Reports in
- USD
- Listed on
- NYSE
- Fiscal year ends
- December 31
- Last results
- Oct 29, 2026
- Incorporated in
- MI
Employees, at the top of the page: "On December 31, 2025 we had approximately 56,000 employees globally, with approximately 28,000 employees in the United States" (10-K). Address and exchange: SEC's company file.
Email alerts
Sources
Numbers from the XBRL of the 10-Ks; filings from SEC EDGAR.
Work with it: Excel workbook · CSV. Google Sheet that stays up to date: paste =IMPORTDATA("https://tickdelta.com/company/SYK/export.csv") into a cell.