Rest of the answer
The Wireless Test segment, similar to the Company’s other reporting units, develops its forecasts based on a combination of estimated market sizes, market share, historical performance, customer information, end product unit growth, development of new products, technology changes and industry reports. The Wireless Test business is driven by adoption of new wireless technology in the end products and end product unit volume growth. The wireless end products that are tested with our equipment include smartphones, tablets, access points, gateways and set-top boxes. Our forecasts take into account the volatile buying patterns of our largest Wireless Test segment customer who is extremely secretive with respect to its confidential product plans and forecasts. In addition, the overall test industry generally is highly volatile with short lead times. As a result, forecasts and actual revenue results may have significant swings from quarter to quarter.
2012-2014 Results
During
2012 and 2013, the Wireless Test segment had average annual revenue of approximately $270 million. During 2012 and 2013, average annual revenue from our largest Wireless Test segment customer was approximately $174 million or 64% in each year.
During 2014, the Wireless Test segment had $185 million of revenue of which $96 million or 52% was from the segment’s largest customer.
Q4 2014 Impairment Test and Charge
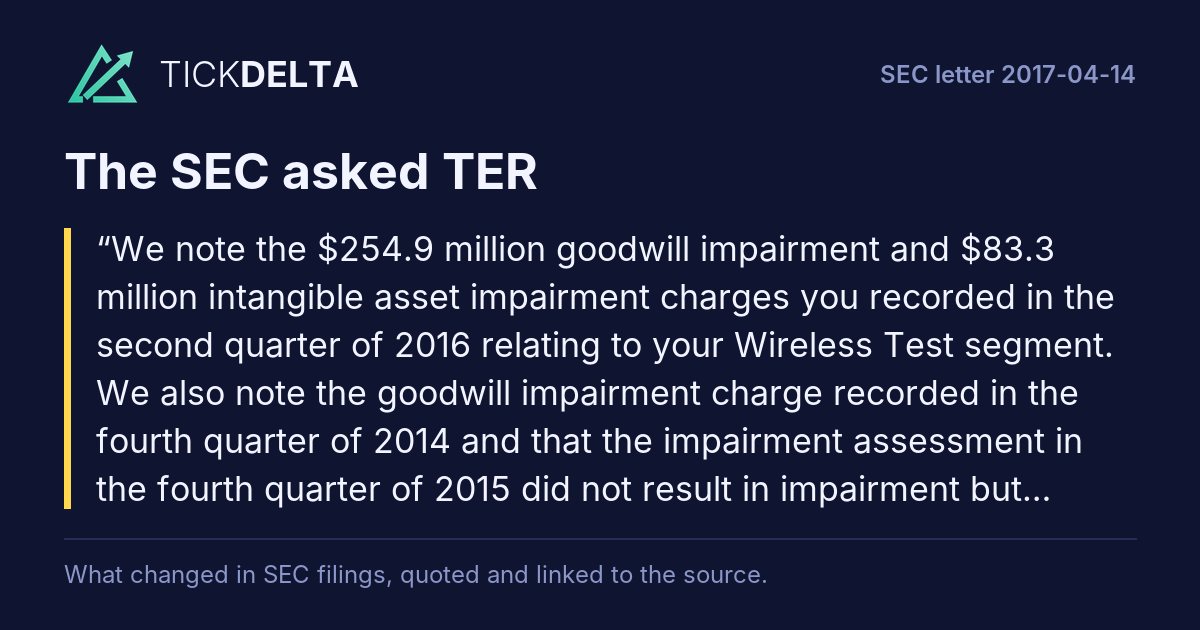
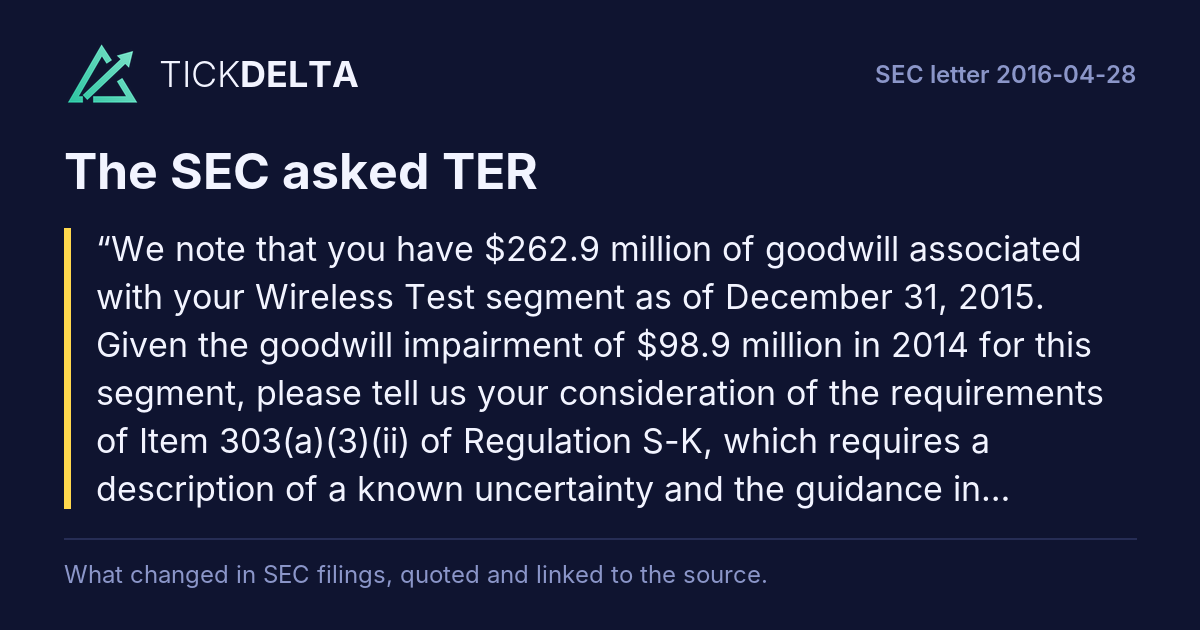
In Q4 2014, we performed our annual impairment test and recorded a goodwill impairment charge of approximately $99 million. The impairment charge was due to a forecasted lower future wireless test market as a result of re-use of previously purchased testers by our largest Wireless Test customer, price competition and customers planning to use new and different wireless testing techniques which we forecasted would reduce sales of our wireless testers.
2015 Forecasts and Results
In Q4 2014, our forecast for 2015 Wireless Test segment revenue was $197 million of which $97 million was forecasted revenue from our largest
Wireless Test segment customer,
GAAP loss before interest and taxes of ($21) million and non-GAAP profit before interest and taxes (“non-GAAP PBIT”) of $28 million1. Non-GAAP PBIT is GAAP profit or loss from operations excluding intangible asset amortization, restructuring and other charges, goodwill impairment charges, intangible asset impairment charges and pension actuarial gains or losses.
During Q1 2015, we received orders of $6 million from our largest Wireless Test customer.
During Q2 2015, however, our largest Wireless Test customer placed orders totaling $53 million of which $40 million were placed in June. The second quarter is the period when major orders are received for the fall launch of new phones and other wireless products. For the first half of 2015, Wireless Test segment revenue was $97 million compared to our fourth quarter 2014 forecast of $105 million for the first half of 2015.
For the full year of 2015, Wireless Test actual revenue was $185 million or 6% below our forecast of $197 million. Revenue from our largest
Wireless Test customer was $94 million compared to a forecast of $97 million. 2015 GAAP loss before interest and tax was ($14) million or $7 million lower than our forecasted loss of ($21) million. 2015 non-GAAP PBIT was $35 million which was $7 million higher than our forecast. The decrease in GAAP loss and increase in 2015 non-GAAP PBIT compared to our forecast was the result of lower headcount versus the forecast. We update our current year annual forecast on a quarterly basis. The chart below shows our FY 2015 annual forecasts for the Wireless Test segment as of different periods during the year.
FY 2015 Forecasted Wireless Test Revenue as of different periods
Period
Q4 2014
Q1 2015
Q2 2015
Q3 2015
Actual FY 2015
2015 Revenue from largest customer
$
97M
69M
86M
91M
94M
2015 Revenue from all other customers
100M
106M
101M
96M
Total Revenue
197M
175M
187M
185M
During 2015, we did not have a triggering event in any interim quarter requiring an interim goodwill impairment test.
Q4 2015 Impairment Test
In Q4 2015, we performed our annual goodwill impairment test for our Wireless Test segment. The estimated fair value of the Wireless Test segment was $411 million or 20% higher than the carrying value of $342 million. In preparing our revenue and profit forecast, we used similar methods to estimate market size and market share including customer information, historical performance, end product unit growth, forecasted technology changes, new product developments and industry reports. In Q4 2015, we forecasted 2016 Wireless Test segment revenue of $170 million of which $65 million was from our largest Wireless Test customer, and a forecasted GAAP loss before interest and taxes of ($24) million and non-GAAP PBIT of $24 million. Our long term forecast was based on holding our core market share flat at approximately 40% with a slight decline in the forecasted core market size with growth coming from new products addressing new markets resulting in an overall average annual revenue growth rate of approximately 9% which was consistent with industry data on unit
Attached as Exhibit A is a reconciliation of the non-GAAP measures included in this response letter.
growth (a third party industry report released in November 2015 forecasted smartphone average annual unit growth of approximately 8% from 2015 to 2019). We forecasted a decrease in FY 2016 revenue compared to FY 2015 as there were no forecasted major technology transitions in 2016. We did forecast, based on discussions with customers, technology transitions in 2017 that we estimated would increase revenue for 2017. In the Q4 2015 forecast, we reduced our overall forecasted revenue from new markets compared to the Q4 2014 forecast as a result of our decision to stop the development of certain new products and lower estimates. As of Q4 2015, we were developing a suite of products to address new and emerging markets and technologies. We estimated revenue from new markets to increase over time and to reach approximately $97 million in 2019. We also considered actual results for 2015 of $185 million of revenue which was 6% below the 2015 forecast of $197 million; actual GAAP loss before interest and taxes of ($14) million which was $7 million lower than forecasted; and actual non-GAAP PBIT of $35 million which was $7 million higher than forecasted.
As a result of the factors noted above, the forecast used in the Q4 2015 impairment test was lower than the forecast used in the Q4 2014 impairment test primarily due to lower revenue from our largest customer and revenue from new markets. We lowered 2016 forecasted revenue by 34%, 2017 forecasted revenue by 41% and 2018 forecasted revenue by 47% compared to our Q4 2014 forecast.
Despite the lowered forecasts, our annual goodwill impairment test for our Wireless Test segment resulted in an estimated fair value of the Wireless Test segment of $411 million which was 20% higher than the carrying value of $342 million so no goodwill impairment charge was recorded in Q4 2015.
Q1 2016 Results and Forecast
Revenue for the first quarter of 2016 was $20 million (including $4 million from our largest Wireless Test customer) or $9 million below our Q1 forecast of $29 million. Orders from our largest Wireless Test customer were $4 million in Q1 2016, not materially different from Q1 2015 orders of $6 million. As the second quarter is the period when major orders from our largest customer are received for the fall launch of new phones and other wireless products, including in 2015 when that customer had low first quarter orders and significant orders in June 2015, we did not reduce our long-term Wireless Test forecast as of March 2016.
We anticipated FY 2016 buying patterns to follow 2015 patterns. In addition, we considered a March 2016 third party industry report forecasting 2016 smartphone unit growth of 12% compared to 2015 and average annual smartphone unit growth of 8% from
2015 to 2019 consistent with the third party industry report released in November 2015. As a result, we did not consider the decrease in Q1 2016 revenue compared to our forecast a triggering event requiring an interim goodwill impairment test or a test for recoverability with respect to the Wireless Test intangible and long-lived assets.
Q2 2016 Triggering Event and Impairment
Charge
In early May 2016, we reduced our FY 2016 revenue forecast from $170 million to $130 million. The primary reason for the reduction was to remove forecasted revenue from our largest Wireless Test customer related to new technology testing because the customer did not implement the new technology. In early May 2016, we did not reduce our long-term forecast because the estimated amount of revenue associated with this new technology was not material in any year beyond 2016.
At the end of May 2016, we further reduced our FY 2016 revenue forecast to $85 million and our forecasted GAAP loss before interest and taxes to approximately ($78) million and non-GAAP loss before interest and taxes to approximately ($28) million. We lowered our 2016 forecasted revenue from our largest customer to $15 million (actual revenue and orders from our largest customer in the first half of 2016 were $8.8 million and $9.0 million, respectively). In addition, we lowered 2017 forecasted revenue by 62%, 2018 forecasted revenue by 57% and 2019 forecasted revenue by 60% compared to our Q4 2015 forecast. We reduced the near-term and long-term forecasts because of our lower estimated market sizes and market share assumptions due to:
(1) our expectation that our largest Wireless Test customer would not place significant orders in Q2 2016 (actual Q2 2016 orders from our largest customer were approximately $5 million);
(2) based on discussions with customers, the delay in the adoption of two new technologies in smart phones from 2017 to 2018 (60GHz WiFi 802.11ad and 6GHz WiFi 802.11ax) which would give our competitors more time to develop competitive products;
(3) forecasted reduction in future average annual smartphone unit growth;
(4) estimated increased test efficiency by our largest Wireless Test customer which would reduce estimated sales of our testers;
(5) estimated test time reduction due to capabilities built into certain chips which reduces sales of our testers;
(6) increased competition with respect to new markets and new products; and
(7) our plan to reduce funding for new products due to lower estimated return on investment.
In addition, the third party industry reports from May and April 2016 forecasted lower smartphone unit growth in 2016 compared to 2015 as well as lower forecasted average annual smartphone unit growth of 4% from 2015 to 2019.
The chart below shows our FY 2016 annual forecasts for the
Wireless Test segment as of different periods during the year.
FY 2016 Forecasted Wireless Test Revenue as of different periods
Q4 2015
Q1 2016
Early May 2016
End of May 2016
Q2 2016
Q3 2016
Actual FY 2016
2016 Revenue from largest customer
65M
60M
37M
15M
22M
23M
2016 Revenue from all other customers
105M
93M
70M
75M
73M
170M
153M
130M
85M
On June 8, 2016, due to the business outlook at that time, we implemented a headcount reduction of approximately 11% in our Wireless Test segment. This headcount reduction was driven by the significant reduction in our forecast at the end of May 2016 both in the near term and the long term. We considered the 11% headcount reduction and the significant reduction in our forecast to be a triggering event requiring an interim goodwill impairment test and a test for recoverability of the Wireless Test intangible and long-lived assets. We performed our interim goodwill impairment test and the intangible and long-lived recoverability test as of May 29,
2016, our month end date. As a result of the May 29, 2016 tests, we recorded a $255 million goodwill impairment charge and an $83 million intangible asset impairment charge.
In the third quarter of 2016, we had an additional headcount reduction of approximately 14%. The headcount reduction was the result of a decision to reduce the number of new products in development and to reduce operating expenses in light of the deteriorating business outlook at that time.