Tutor Perini Corp TPC
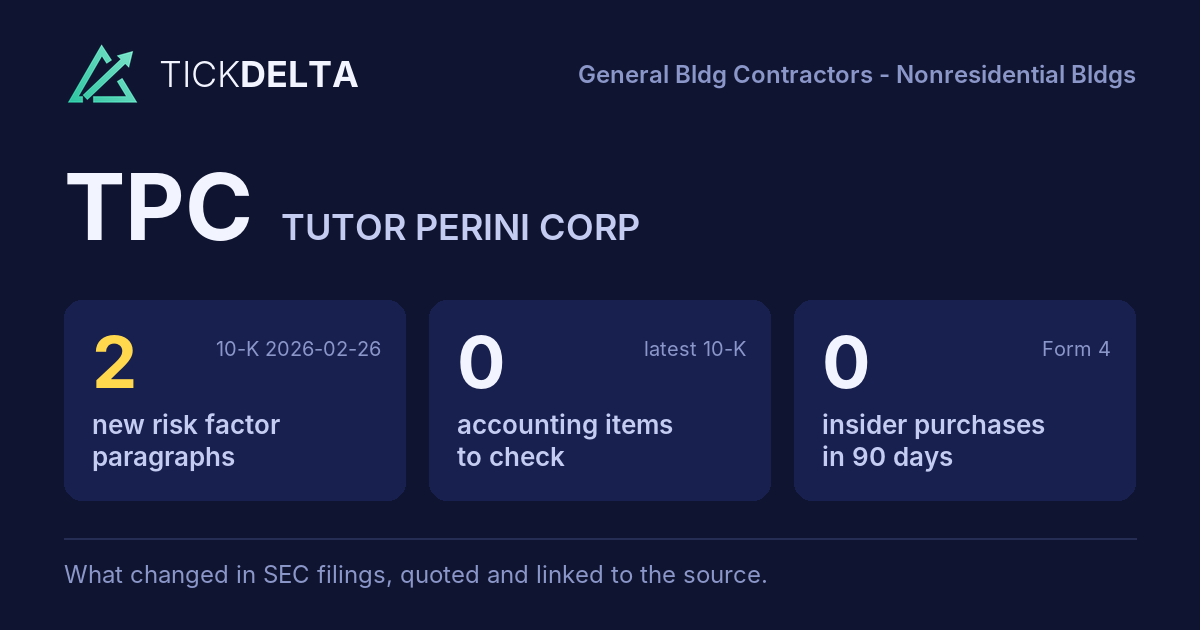
The biggest changes in the 10-K filed Feb 26, 2026, in management's words
10-K, Item 7This fiscal year against the last, and the sentences in the MD&A where management explains each change. Tickdelta picks sentences that name the line, a direction and a cause. It does not write explanations of its own.
Gross margin
Big change, FY to Dec 31, 2025 vs Dec 31, 2024
The MD&A has no sentence that names a cause for this change.
Operating margin
Big change, FY to Dec 31, 2025 vs Dec 31, 2024
“The increase in operating margin for 2025 was primarily due to the above-mentioned factors that drove the increases in revenue and income from construction operations.”
Read it in the 10-K
“The increase in operating margin was driven by the above-mentioned factors that drove the increases in revenue and income (loss) from construction operations.”
Read it in the 10-K
Cash from operations
Big change, FY to Dec 31, 2025 vs Dec 31, 2024
“The record operating cash flow in 2025 was primarily driven by strong collections on newer and ongoing projects, reflecting a significant increase in project execution and improved working capital management, with additional contributions from a reduction in costs and estimated earnings in excess of billings due to the resolution of certain legacy matters.”
Read it in the 10-K
“The increase in cash flow from operating activities primarily reflects higher cash generated by earning sources, partially offset by a smaller decrease in net project working capital in 2025 compared to 2024.”
Read it in the 10-K
Revenue
Big change, FY to Dec 31, 2025 vs Dec 31, 2024
“Revenue for 2025 increased 15% compared to 2024, primarily due to increased project execution activities on two large detention facility projects in New York and a large healthcare facility project in California, all of which have substantial scope of work remaining.”
Read it in the 10-K
“Revenue for 2025 increased 43% compared to 2024, primarily due to increased project execution activities on the electrical and mechanical components of various newer projects across diverse end markets, all with substantial scope of work remaining and driven by overall strong market demand.”
Read it in the 10-K
What management said, year by year
The cause given in each 10-K, 2 fiscal years, newest first · MD&A (Item 7)
Each bar is how the line changed that year (from the same 10-K's XBRL). Under it, the sentence in that year's MD&A that names the line, a direction and a cause, word for word. A year with no sentence says so.
Revenue
2 of 2 years explained-
FY 2025 +28.1%
“Revenue for 2025 increased 15% compared to 2024, primarily due to increased project execution activities on two large detention facility projects in New York and a large healthcare facility project in California, all of which have substantial scope of work remaining.”
Read it in the FY 2025 10-K“Revenue for 2025 increased 43% compared to 2024, primarily due to increased project execution activities on the electrical and mechanical components of various newer projects across diverse end markets, all with substantial scope of work remaining and driven by overall strong market demand.”
Read it in the FY 2025 10-K -
FY 2024 +11.5%
“Revenue for 2024 increased 12% compared to 2023, primarily due to a net increase in project execution activities driven by certain large mass-transit projects in California and Hawaii, two airport projects in the Northern Mariana Islands, and the tunneling component of an energy project in British Columbia, partially offset by reduced project execution activities on a mass-transit project in the Midwest that is nearing completion.”
Read it in the FY 2024 10-K“Revenue for 2024 increased 24% compared to 2023, with the growth driven by increased project execution activities on various healthcare and educational facility projects in California and a detention facility project in New York with substantial scope of work remaining, as well as the absence of a prior-year unfavorable adjustment related to an adverse legal ruling on a completed mixed-use project in New York.”
Read it in the FY 2024 10-K
Gross margin
0 of 2 years explained-
FY 2025 +7.1 pts
The FY 2025 MD&A has no sentence that names a cause for this change.
-
FY 2024 +0.9 pts
The FY 2024 MD&A has no sentence that names a cause for this change.
Operating margin
2 of 2 years explained-
FY 2025 +6.6 pts
“The increase in operating margin for 2025 was primarily due to the above-mentioned factors that drove the increases in revenue and income from construction operations.”
Read it in the FY 2025 10-K“The increase in operating margin was driven by the above-mentioned factors that drove the increases in revenue and income (loss) from construction operations.”
Read it in the FY 2025 10-K -
FY 2024 +0.6 pts
“The decrease in operating margin for 2024 was primarily due to the aforementioned unfavorable adjustment of $101.6 million related to the unexpected adverse arbitration decision on a legacy dispute related to a completed bridge project in California.”
Read it in the FY 2024 10-K“The change in operating margin was mainly attributable to the aforementioned factors that drove the lower loss from construction operations in 2024.”
Read it in the FY 2024 10-K
Cash from operations
2 of 2 years explained-
FY 2025 +48.6%
“The record operating cash flow in 2025 was primarily driven by strong collections on newer and ongoing projects, reflecting a significant increase in project execution and improved working capital management, with additional contributions from a reduction in costs and estimated earnings in excess of billings due to the resolution of certain legacy matters.”
Read it in the FY 2025 10-K“The increase in cash flow from operating activities primarily reflects higher cash generated by earning sources, partially offset by a smaller decrease in net project working capital in 2025 compared to 2024.”
Read it in the FY 2025 10-K -
FY 2024 +63.2%
“The record operating cash flow in 2024 was primarily due to a decrease in costs and estimated earnings in excess of billings (“CIE”) largely associated with the resolution of various legacy disputed matters, an increase in accounts payable resulting from the timing of payments to subcontractors and vendors, and an increase in billings in excess of costs and estimated earnings (“BIE”) primarily due to advanced payments on newer projects for mobilization and other initial project costs, partially offset by cash utilized by earnings sources.”
Read it in the FY 2024 10-K
Changes are computed from the XBRL figures in the same 10-K. Hover a number to see the line item. Open the 10-K
Sources
The Management's Discussion and Analysis (Item 7) of the latest 10-K, quoted word for word; the changes are computed from the same 10-K's XBRL.
Also
Financials: the numbers year by year.
Work with it
Excel workbook · CSV. Google Sheet that stays up to date: paste =IMPORTDATA("https://tickdelta.com/company/TPC/export.csv") into a cell.