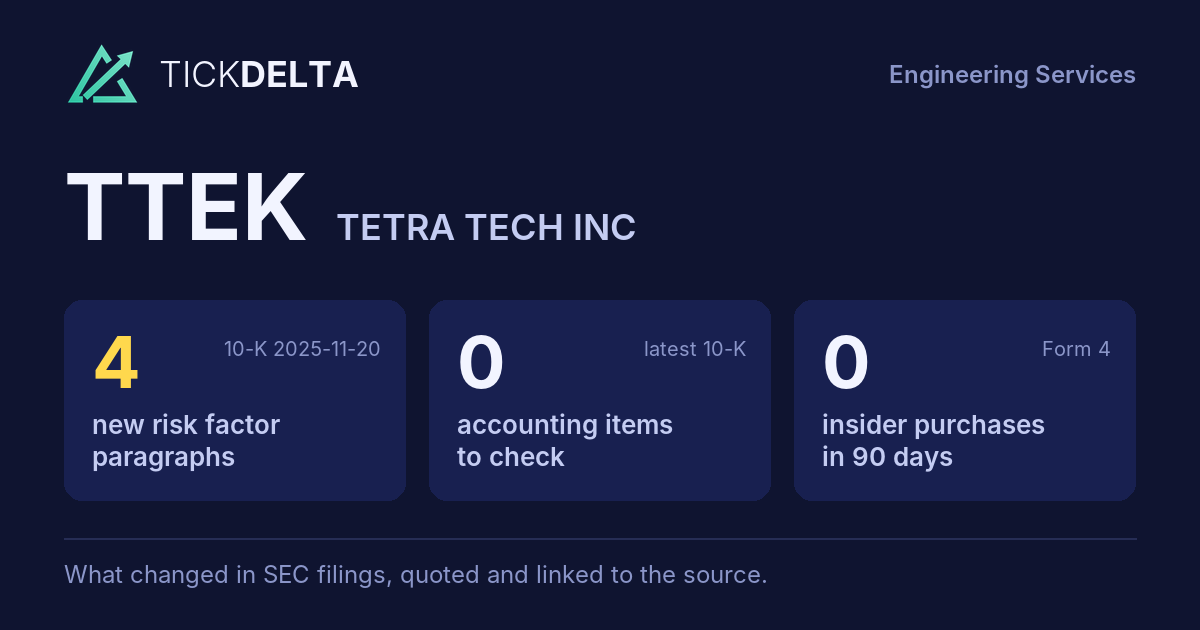
Screener / SEC EDGAR /CIK 0000831641 /10-K filed Nov 20, 2025, compared with Nov 19, 2024 /Numbers from the XBRL of the 10-Ks
Nasdaq Industrials · Engineering Services

Tetra Tech Inc TTEK

Compare with peers Embed
Earnings releases

Latest results release: Nov 12, 2026

8-K item 2.02, exhibit 99

What TTEK's management wrote with each quarter's results: the press release and, when the company files them, its prepared remarks or the call transcript. The call itself is not filed with SEC, so most quarters have the release only.

Adjusted vs GAAP earnings per share

In the company's own words · read from each release, never computed

In its release of Nov 12, 2026, TTEK reported $0.51 per share under GAAP and $0.49 on its own adjusted basis: the adjusted number is -4% below GAAP.

GAAP EPS $1.00, release Nov 15, 2023: GAAP EPS was $1.00. Adjusted EPS $1.78, release Nov 15, 2023: Adjusted EPS was $1.78, up 41% year-over year, which excluded the final RPS integration costs, including office consolidations and non-recurring tax charges. +78% 2023-11 GAAP EPS $1.23, release Nov 13, 2024: to $5.20 billion Net · Revenue1 increased 15% Y/Y to $4.32 billion · Operating Income increased 40% Y/Y to $501 million · EPS of $1.23 and Adjusted EPS1 of $1.26, both increa Adjusted EPS $1.26, release Nov 13, 2024: · Revenue1 increased 15% Y/Y to $4.32 billion · Operating Income increased 40% Y/Y to $501 million · EPS of $1.23 and Adjusted EPS1 of $1.26, both increased 21% Y/Y · Backlog incre +2% 2024-11 GAAP EPS $0.00, release Jan 30, 2025: adjusted Operating Income increased 24% Y/Y to $138 million · EPS $0.00 Adjusted EPS $0.35, release Jan 30, 2025: adjusted Operating Income increased 24% Y/Y to $138 million · EPS $0.00; adjusted EPS1 increased 25% Y/Y to $0.35 · Backlog increased 15% Y/Y to $5.44 bi 2025-01 GAAP EPS $0.02, release May 7, 2025: $ 1,322… $ 1,322… $ 2,742… $ 2,742… Net $ 1,103… $ 1,103… $ 2,301… $ 2,301… Reve… Oper… $ 39.6 $ 130.1 $ 62.1 $ 267.2 Inco… EPS $ 0.02 $ 0.33 $ 0.02 $ 0.68 Year to Date Highl Adjusted EPS $0.68, release May 7, 2025: Revenue increased 11% Y/Y to $2.30 billion ● Adjusted Operating Income increased 17% Y/Y to $267 million ● Adjusted EPS increased 21% Y/Y to $0.68 Second Quarter Highlights ● Revenue inc +3300% 2025-05 GAAP EPS $0.40, release Jan 28, 2026: EPS was $0.40 and adjusted EPS was $0.35. Adjusted EPS $0.35, release Jan 28, 2026: EPS was $0.40 and adjusted EPS was $0.35. -12% 2026-01 GAAP EPS $0.36, release Apr 29, 2026: EPS was $0.36 and adjusted EPS was $0.34. Adjusted EPS $0.34, release Apr 29, 2026: EPS was $0.36 and adjusted EPS was $0.34. -6% 2026-04 GAAP EPS $0.51, release Nov 12, 2026: EPS was $0.51 and adjusted EPS 1was $0.49, up 9% year-over-year. Adjusted EPS $0.49, release Nov 12, 2026: EPS was $0.51 and adjusted EPS 1was $0.49, up 9% year-over-year. -4% 2026-11
GAAP EPSAdjusted EPS, as the company defines itThe figure on top is how far adjusted is from GAAP. Click a bar for the sentence.
The company's words, latest release
EPS was $0.51 and adjusted EPS 1was $0.49, up 9% year-over-year. release

What the company says its adjusted numbers leave out:

The reported adjusted operating income and EPS exclude non-cash 1 goodwill impairment related to USAID in Q2-25 and legal contingency in Q1-25. release Jul 30, 2025

Both numbers are read from the words of each release (usually the highlights), never computed by us; hover a number for its sentence. Quarters where the release gives them only in a table are not shown. The company decides what "adjusted" leaves out; the full reconciliation is in the release.

Read and search

Every release, in full · linked to sec.gov

Press release Nov 12, 2026 · EX-99.1

Tetra Tech Reports Strong Fourth Quarter and Fiscal Year 2026 Results

Open on SEC

Pasadena, California. Tetra Tech, Inc. (NASDAQ: TTEK), a global provider of high-end technical and engineering services, Le ading with Science ® inwater, environment and sustainable infrastructure, today announced results for the fourth quarter and fiscal year ended September 27, 2026.

Revenue and revenue, net of subcontractor costs (net revenue) 1, in the fourth quarter totaled $1.34 billion and $1.15 billion, respectively. Net revenue increased 5% year-over-year excluding episodic disaster response. Operating income was $188 million and adjusted EBITDA 1was $194 million; adjusted EBITDA margin increased 90 basis points year-over-year. EPS was $0.51 and adjusted EPS 1was $0.49, up 9% year-over-year. Backlog was $4.67 billion at the end of the fourth quarter, up 13% year-over-year.

$1.4 · billion multiple-award blanket purchase agreement for enterprise logistics services for NASA

$145 · million multiple-award contract for engineering and technical consulting services for U.S. Navy

$141 · million single-award contract for water infrastructure assessment services for U.S. EPA

$85 · million multiple-award contracts for environmental services for USACE Europe District

$63 · million single-award contract for emergency preparedness and response services for U.S. EPA

$49 · million multiple-award contract for geospatial and engineering services for NOAA

$14 · million single-award contract for digital systems modernization for LA Metro

$12.7 · million single-award contracts for technical services for Millennium Challenge Corporation

Non-GAAP financial measures which the Company believes provide valuable 1 perspectives on its business results. Refer to Regulation G Information for reconciliations to the comparable GAAP metrics.

Executive Management Comments Roger Argus, Chief Executive Officer, commented, “We completed fiscal year 2026 with a strong fourth quarter driven by our global commercial and government businesses. We continue to see increasing demand for our differentiated Le ading with Science ® technicalservices for water and environmental programs, including digital automation for associated facilities. Our resilient infrastructure design services are growing globally with new contracts for water supply, coastal infrastructure, and defense modernization. These key client programs drove our backlog up by more than $530 million, an increase of 13% from last year. This strong momentum in backlog gives us confidence in continued revenue growth and further margin expansion.”

Steve Burdick, Chief Financial Officer, stated, “In fiscal year 2026, we continued to increase our profit margins with 90 basis points of EBITDA margin expansion from fiscal year 2025. The strength of our balance sheet and consistent cash flow generation position us to continue to invest in organic growth and strategic acquisitions.”

On November 9, 2026, Tetra Tech’s Board of Directors approved a quarterly dividend in the amount of $0.072 per share, an 11% increase year-over-year, payable on December 11, 2026, to stockholders of record as of December 2, 2026. This is the 46 thconsecutive double-digit increase in the Company’s quarterly dividend. In the fourth quarter of fiscal year 2026, Tetra Tech repurchased $100 million of common stock. Additionally, as of September 27, 2026, the Company had $798 million remaining under its share repurchase program. Fiscal Year Results Revenue for fiscal year 2026 was $5.08 billion and net revenue was $4.35 billion. For fiscal year 2026, net revenue increased 7% compared to last year excluding USAID / DOS and episodic disaster response. Operating income was $619 million, adjusted EBITDA was $660 million with margin up 90 basis points compared to last year, and EPS was $1.69. Cash flows generated from operations were up 14% year-over-year.

The following statements are based on current expectations. These statements are forward-looking, and the actual results could differ materially. These statements do not include the potential impact of transactions that may be completed or developments that become evident after the date of this release. The Business Outlook section should be read in conjunction with the information on forward-looking statements at the end of this release.

Tetra Tech expects EPS for the first quarter of fiscal year 2027 to range from $0.36 to $0.38 and net revenue 2to range from $1.04 billion to $1.08 billion. For fiscal year 2027, Tetra Tech expects EPS to range from $1.65 to $1.80, and net revenue to range from $4.425 billion to $4.625 billion.

Investors will have the opportunity to access a live audio-visual webcast and supplemental financial information concerning the fourth quarter and fiscal year 2026 results through a link posted on the Company’s website at tetratech.com on November 12, 2026, at 8:00 a.m. (PT).

Reconciliation of the net revenue guidance to the most directly comparable GAAP measure is not available without unreasonable efforts 2 because the Company cannot predict the magnitude and timing of all the components required to provide such reconciliation with sufficient precision.

Tetra Tech is the leader in water, environment and sustainable infrastructure, providing high-end technical and engineering services for projects worldwide. With more than 25,000 employees working together, Tetra Tech provides clear solutions to complex problems by Leading with Science ®to address the entire water cycle, protect and restore the environment, and design sustainable and resilient infrastructure.For more information about Tetra Tech, please visit tetratech.comor follow us on LinkedInand Facebook. CONTACTS: Jim Wu, Investor Relations Charlie MacPherson, Media & Public Relations (626) 470-2844 Forward-Looking Statements

This release contains forward-looking statements within the meaning of the Private Securities Litigation Reform Act of 1995. The use of words such as "anticipate," "expect," "could," "may," "intend," "plan" and "believe," among others, generally identify forward-looking statements. These forward-looking statements are based on current expectations and beliefs of Tetra Tech’s management and currently available operating, financial, economic and other information, and are subject to a number of risks and uncertainties. Readers are cautioned that these forward-looking statements are only predictions and may differ materially from actual future events or results. A variety of factors, many of which are beyond our control, could cause actual future results or events to differ materially from those projected in the forward-looking statements in this release, including but not limited to: continuing worldwide political and economic uncertainties; the U.S. Administration’s potential changes to fiscal policies; the cyclicality in demand for our overall services; the fluctuation in demand for oil and gas, and mining services; risks related to international operations; concentration of revenues from U.S. government agencies and potential funding disruptions by these agencies; dependence on winning or renewing U.S. government contracts; the delay or unavailability of public funding on U.S. government contracts; the U.S. government’s right to modify, delay, curtail or terminate contracts at its convenience; compliance with government procurement laws and regulations; the impact of global pandemics; credit risks associated with certain clients in certain geographic areas or industries; acquisition strategy and integration risks; goodwill or other intangible asset impairment; the failure to comply with worldwide anti- bribery laws; the failure to comply with domestic and international export laws; the failure to properly manage projects; the loss of key personnel or the inability to attract and retain qualified personnel; the ability of our employees to obtain government granted eligibility; the use of estimates and assumptions in the preparation of financial statements; the ability to maintain adequate workforce utilization; the use of the percentage-of-completion method of accounting; the inability to accurately estimate and control contract costs; the failure to adequately recover on our claims for additional contract costs; the failure to win or renew contracts with private and public sector clients; growth strategy management; backlog cancellation and adjustments; risks relating to cyber security breaches; the failure of partners to perform on joint projects; the failure of subcontractors to satisfy their obligations; requirements to pay liquidated damages based on contract performance; the adoption of new legal requirements; changes in resource management, environmental or infrastructure industry laws, regulations or programs; changes in bank and capital markets and the access to capital; credit agreement covenants; industry competition; liability related to legal proceedings, investigations, and disputes; the availability of third-party insurance coverage; the ability to obtain adequate bonding; employee, agent, or partner misconduct; employee risks related to international travel; safety programs; conflict of interest issues; liabilities relating to reports and opinions; liabilities relating to environmental laws and regulations; force majeure events; protection of intellectual property rights; stock price volatility; the ability to impede a business combination based on Delaware law and charter documents; and other risks and uncertainties as may be described in Tetra Tech’s periodic filings with the Securities and Exchange Commission, including those described in the “Risk Factors” section of Tetra Tech’s Annual Report on Form 10-K for the fiscal year ended September 28, 2025. Readers should not place undue reliance on forward-looking statements since such information speaks only as of the date of this release. Tetra Tech does not intend to update forward- looking statements and expressly disclaims any obligation to do so.

To supplement the financial results presented in accordance with generally accepted accounting principles in the United States (“GAAP”), we present certain non-GAAP financial measures within the meaning of Regulation G under the Securities Exchange Act of 1934, as amended. We provide these non-GAAP financial measures because we believe they provide a valuable perspective on our financial results. However, non-GAAP measures have limitations as analytical tools and should not be considered in isolation and are not in accordance with, or a substitute for, GAAP measures. In addition, other companies may define non-GAAP measures differently which limits the ability of investors to compare non-GAAP measures of Tetra Tech to those used by our peer companies. A reconciliation of these non-GAAP financial measures to the most directly comparable GAAP financial measures is set forth in this release. Tetra Tech, Inc.

Assets Current September 27, September 28, assets: 2026 2025 ────────────────────────────────────────────────────────────────────────────── Cash and cash $ 235,076 $ 167,459 equivalents Accounts receivable, 1,149,139 1,158,928 net Contract 144,924 138,232 assets Prepaid expenses and 112,440 83,434 other current assets Assets - 57,502 held-for-sale Income taxes 55,234 15,334 receivable Total current 1,696,813 1,620,889 assets Property and 65,507 66,148 equipment, net Right-of-use assets, 191,373 197,618 operating leases Goodwill 2,224,991 2,049,874 Intangible 116,417 121,160 assets, net Deferred tax 40,641 106,238 assets Other non-current 140,057 120,247 assets Total assets $ 4,475,799 $ 4,282,174 Liabilities and Equity Current liabilities: Accounts $ 223,810 $ 204,725 payable Accrued 325,294 346,912 compensation Contract 406,937 420,254 liabilities Short-term lease liabilities, 77,958 69,099 operating leases Current contingent 49,352 24,826 earn-out liabilities Liabilities - 25,115 held-for-sale Other current 259,113 288,113 liabilities Total current 1,342,464 1,379,044 liabilities Deferred tax 18,964 21,333 liabilities Long-term debt 891,957 763,363 Long-term lease liabilities, 134,999 154,695 operating leases Non-current contingent 43,581 32,135 earn-out liabilities Other non-current 159,503 151,440 liabilities Total 2,591,468 2,502,010 liabilities Equity: Preferred stock - authorized, 2,000 shares of $0.01 par value; no shares issued - - and outstanding at September 27, 2026 and September 28, 2025 Common stock - authorized, 750,000 shares of $0.01 par value; issued and outstanding, 2,533 2,614 253,284 and 261,418 shares at September 27, 2026 and September 28, 2025, respectively Accumulated other (96,442 ) (95,777 ) comprehensive loss Retained 1,977,557 1,872,948 earnings Tetra Tech stockholders' 1,883,648 1,779,785 equity Noncontrolling 683 379 interests Total stockholders' 1,884,331 1,780,164 equity Total liabilities and $ 4,475,799 $ 4,282,174 stockholders' equity

Fiscal Year Ended ────────────────────────────────────────────────────────────────────────────── September 27, September 28, 2026 2025 Cash flows from operating activities: Net income $ 440,729 $ 247,949 Adjustments to reconcile net income to net cash provided by operating activities: Depreciation and 56,294 58,276 amortization Amortization of stock-based 36,561 33,946 awards Deferred 64,254 (11,297 ) income taxes Provision for losses on 1,889 3,150 accounts receivables Impairment of - 92,416 goodwill Gain on sale of divested (12,361 ) - business Fair value adjustments to (14,421 ) (12,228 ) contingent consideration Other non-cash 2,936 9,024 items Changes in operating assets and liabilities, net of effects of business acquisitions and divestitures:

Accounts receivable and 45,087 (112,755 ) contract assets Prepaid expenses and (9,719 ) (30,563 ) other assets Accounts 10,118 2,398 payable Accrued (28,481 ) 18,879 compensation Contract (13,836 ) 73,489 liabilities Cash settled contingent - (11,170 ) earn-out liability Income taxes (40,765 ) 23,227 receivable/pa… Other (15,266 ) 72,944 liabilities Net cash provided by 523,019 457,685 operating activities Cash flows from investing activities: Payments for business acquisitions, (191,870 ) (97,263 ) net of cash acquired Capital (20,485 ) (18,633 ) expenditures Proceeds from sales of 915 919 assets Proceeds from company-owned life - 1,934 insurance policies Proceeds from divested 40,263 2,406 business, net Proceeds from loan repayment from - 3,883 divested business Net cash used in investing (171,177 ) (106,754 ) activities Cash flows from financing activities: Proceeds from 335,000 715,000 borrowings Repayments on (210,000 ) (771,027 ) long-term debt Payment of debt issuance - (2,738 ) costs Repurchases of (302,010 ) (249,984 ) common stock Shares repurchased for tax (12,568 ) (14,047 ) withholdings on share-based awards Payments of contingent (20,841 ) (15,055 ) earn-out liabilities Stock options 1,394 469 exercised Dividends paid (70,827 ) (65,039 ) Principal payments on (8,024 ) (7,823 ) finance leases Net cash used in financing (287,876 ) (410,244 ) activities Effect of exchange rate changes on 2,738 (5,004 ) cash and cash equivalents Net increase (decrease) in 66,704 (64,317 ) cash and cash equivalents Cash and cash equivalents at 168,372 232,689 beginning of year Cash and cash equivalents at $ 235,076 $ 168,372 end of year

Reconciliation of Revenue to Revenue, Net of Subcontractor Costs ("Net Revenue")

Full text with the tables
                                                                    Exhibit 99.1
                     
  NEWS               
  RELEASE            
  November 11, 2026  
 ─────────────────── 
                     
     Tetra Tech Reports Strong Fourth Quarter and Fiscal Year 2026 Results      
                                                                  
  ·  Fourth                                                       
     quarter revenue $1.34 billion and net revenue $1.15 billion  
                                                                  
                                                      
  ·  Record                                           
     fourth quarter EPS $0.51 and adjusted EPS $0.49  
                                                      
                                                   
  ·  Record                                        
     fiscal year EPS $1.69 and adjusted EPS $1.60  
                                                   
                                
  ·  Backlog                    
     $4.67 billion, up 13% Y/Y  
                                
Pasadena, California. Tetra Tech, Inc. (NASDAQ: TTEK), a global provider of
high-end technical and engineering services, Le ading with Science ® inwater,
environment and sustainable infrastructure, today announced results for the
fourth quarter and fiscal year ended September 27, 2026.

Fourth Quarter Results

Revenue and revenue, net of subcontractor costs (net revenue) 1, in the fourth
quarter totaled $1.34 billion and $1.15 billion, respectively. Net revenue
increased 5% year-over-year excluding episodic disaster response. Operating
income was $188 million and adjusted EBITDA 1was $194 million; adjusted EBITDA
margin increased 90 basis points year-over-year. EPS was $0.51 and adjusted EPS
1was $0.49, up 9% year-over-year. Backlog was $4.67 billion at the end of the
fourth quarter, up 13% year-over-year.

Recent Key Wins
                                                                                
     $1.4                                                                       
  ·  billion multiple-award blanket purchase agreement for enterprise           
     logistics services for                                                     
     NASA                                                                       
                                                                                
                                                                                
     $145                                                                       
  ·  million multiple-award contract for engineering and technical consulting   
     services for                                                               
     U.S. Navy                                                                  
                                                                                
                                                                                
     $141                                                                       
  ·  million single-award contract for water infrastructure assessment          
     services for U.S. EPA                                                      
                                                                                
                                                                                
     $85                                                                        
  ·  million multiple-award contracts for environmental services for USACE      
     Europe District                                                            
                                                                                
                                                                                
     $63                                                                        
  ·  million single-award contract for emergency preparedness and response      
     services for U.S.                                                          
     EPA                                                                        
                                                                                
                                                                                
     $49                                                                        
  ·  million multiple-award contract for geospatial and engineering services    
     for NOAA                                                                   
                                                                                
                                                                                
     $14                                                                        
  ·  million single-award contract for digital systems modernization for LA     
     Metro                                                                      
                                                                                
                                                                                
     $12.7                                                                      
  ·  million single-award contracts for technical services for Millennium       
     Challenge Corporation                                                      
                                                                                
                                                                                
     Non-GAAP                                                                   
     financial measures which the Company believes provide valuable             
  1  perspectives on its business                                               
     results. Refer to Regulation G Information for reconciliations to the      
     comparable GAAP metrics.                                                   
                                                                                
Executive Management Comments
Roger Argus, Chief Executive Officer, commented, “We completed fiscal year 2026
with a strong fourth quarter driven by our global commercial and government
businesses. We continue to see increasing demand for our differentiated Le ading
with Science ® technicalservices for water and environmental programs, including
digital automation for associated facilities. Our resilient infrastructure
design services are growing globally with new contracts for water supply,
coastal infrastructure, and defense modernization. These key client programs
drove our backlog up by more than $530 million, an increase of 13% from last
year. This strong momentum in backlog gives us confidence in continued revenue
growth and further margin expansion.”

Steve Burdick, Chief Financial Officer, stated, “In fiscal year 2026, we
continued to increase our profit margins with 90 basis points of EBITDA margin
expansion from fiscal year 2025. The strength of our balance sheet and
consistent cash flow generation position us to continue to invest in organic
growth and strategic acquisitions.”

Quarterly Dividend and Share Repurchase Program

On November 9, 2026, Tetra Tech’s Board of Directors approved a quarterly
dividend in the amount of $0.072 per share, an 11% increase year-over-year,
payable on December 11, 2026, to stockholders of record as of December 2, 2026.
This is the 46 thconsecutive double-digit increase in the Company’s quarterly
dividend. In the fourth quarter of fiscal year 2026, Tetra Tech repurchased $100
million of common stock. Additionally, as of September 27, 2026, the Company had
$798 million remaining under its share repurchase program.
Fiscal Year Results
Revenue for fiscal year 2026 was $5.08 billion and net revenue was $4.35
billion. For fiscal year 2026, net revenue increased 7% compared to last year
excluding USAID / DOS and episodic disaster response. Operating income was $619
million, adjusted EBITDA was $660 million with margin up 90 basis points
compared to last year, and EPS was $1.69. Cash flows generated from operations
were up 14% year-over-year.

Business Outlook

The following statements are based on current expectations. These statements are
forward-looking, and the actual results could differ materially. These
statements do not include the potential impact of transactions that may be
completed or developments that become evident after the date of this release.
The Business Outlook section should be read in conjunction with the information
on forward-looking statements at the end of this release.

Tetra Tech expects EPS for the first quarter of fiscal year 2027 to range from
$0.36 to $0.38 and net revenue 2to range from $1.04 billion to $1.08 billion.
For fiscal year 2027, Tetra Tech expects EPS to range from $1.65 to $1.80, and
net revenue to range from $4.425 billion to $4.625 billion.

Webcast

Investors will have the opportunity to access a live audio-visual webcast and
supplemental financial information concerning the fourth quarter and fiscal year
2026 results through a link posted on the Company’s website at tetratech.com on
November 12, 2026, at 8:00 a.m. (PT).
                                                                                
     Reconciliation of the net revenue guidance to the most directly            
     comparable GAAP measure is not available without unreasonable efforts      
  2  because the Company cannot predict the magnitude and timing of             
     all the components required to provide such reconciliation with            
     sufficient precision.                                                      
                                                                                
About Tetra Tech

Tetra Tech is the leader in water, environment and sustainable infrastructure,
providing high-end technical and engineering services for projects worldwide.
With more than 25,000 employees working together, Tetra Tech provides clear
solutions to complex problems by Leading with Science ®to address the entire
water cycle, protect and restore the environment, and design sustainable and
resilient infrastructure.For more information about Tetra Tech, please visit
tetratech.comor follow us on LinkedInand Facebook.
CONTACTS:
Jim Wu, Investor Relations
Charlie MacPherson, Media & Public Relations
(626) 470-2844
Forward-Looking Statements

This release contains forward-looking statements within the meaning of the
Private Securities Litigation Reform Act of 1995. The use of words such as
"anticipate," "expect," "could," "may," "intend," "plan" and "believe," among
others, generally identify forward-looking statements. These forward-looking
statements are based on current expectations and beliefs of Tetra Tech’s
management and currently available operating, financial, economic and other
information, and are subject to a number of risks and uncertainties. Readers are
cautioned that these forward-looking statements are only predictions and may
differ materially from actual future events or results. A variety of factors,
many of which are beyond our control, could cause actual future results or
events to differ materially from those projected in the forward-looking
statements in this release, including but not limited to: continuing worldwide
political and economic uncertainties; the U.S. Administration’s potential
changes to fiscal policies; the cyclicality in demand for our overall services;
the fluctuation in demand for oil and gas, and mining services; risks related to
international operations; concentration of revenues from U.S. government
agencies and potential funding disruptions by these agencies; dependence on
winning or renewing U.S. government contracts; the delay or unavailability of
public funding on U.S. government contracts; the U.S. government’s right to
modify, delay, curtail or terminate contracts at its convenience; compliance
with government procurement laws and regulations; the impact of global
pandemics; credit risks associated with certain clients in certain geographic
areas or industries; acquisition strategy and integration risks; goodwill or
other intangible asset impairment; the failure to comply with worldwide anti-
bribery laws; the failure to comply with domestic and international export laws;
the failure to properly manage projects; the loss of key personnel or the
inability to attract and retain qualified personnel; the ability of our
employees to obtain government granted eligibility; the use of estimates and
assumptions in the preparation of financial statements; the ability to maintain
adequate workforce utilization; the use of the percentage-of-completion method
of accounting; the inability to accurately estimate and control contract costs;
the failure to adequately recover on our claims for additional contract costs;
the failure to win or renew contracts with private and public sector clients;
growth strategy management; backlog cancellation and adjustments; risks relating
to cyber security breaches; the failure of partners to perform on joint
projects; the failure of subcontractors to satisfy their obligations;
requirements to pay liquidated damages based on contract performance; the
adoption of new legal requirements; changes in resource management,
environmental or infrastructure industry laws, regulations or programs; changes
in bank and capital markets and the access to capital; credit agreement
covenants; industry competition; liability related to legal proceedings,
investigations, and disputes; the availability of third-party insurance
coverage; the ability to obtain adequate bonding; employee, agent, or partner
misconduct; employee risks related to international travel; safety programs;
conflict of interest issues; liabilities relating to reports and opinions;
liabilities relating to environmental laws and regulations; force majeure
events; protection of intellectual property rights; stock price volatility; the
ability to impede a business combination based on Delaware law and charter
documents; and other risks and uncertainties as may be described in Tetra Tech’s
periodic filings with the Securities and Exchange Commission, including those
described in the “Risk Factors” section of Tetra Tech’s Annual Report on Form
10-K for the fiscal year ended September 28, 2025. Readers should not place
undue reliance on forward-looking statements since such information speaks only
as of the date of this release. Tetra Tech does not intend to update forward-
looking statements and expressly disclaims any obligation to do so.

Non-GAAP Financial Measures

To supplement the financial results presented in accordance with generally
accepted accounting principles in the United States (“GAAP”), we present certain
non-GAAP financial measures within the meaning of Regulation G under the
Securities Exchange Act of 1934, as amended. We provide these non-GAAP financial
measures because we believe they provide a valuable perspective on our financial
results. However, non-GAAP measures have limitations as analytical tools and
should not be considered in isolation and are not in accordance with, or a
substitute for, GAAP measures. In addition, other companies may define non-GAAP
measures differently which limits the ability of investors to compare non-GAAP
measures of Tetra Tech to those used by our peer companies. A reconciliation of
these non-GAAP financial measures to the most directly comparable GAAP financial
measures is set forth in this release.
                                Tetra Tech, Inc.                                
                                                                                
                          Consolidated Balance Sheets                           
                                                                                
                  (unaudited - in thousands, except par value)                  
                                                                                
  Assets                                                                        
  Current           September 27,                  September 28,                
  assets:           2026                           2025                         
 ────────────────────────────────────────────────────────────────────────────── 
  Cash and cash     $                235,076       $                167,459     
  equivalents                                                                   
  Accounts                                                                      
  receivable,                      1,149,139                      1,158,928     
  net                                                                           
  Contract                           144,924                        138,232     
  assets                                                                        
  Prepaid                                                                       
  expenses and                       112,440                         83,434     
  other current                                                                 
  assets                                                                        
  Assets                                   -                         57,502     
  held-for-sale                                                                 
  Income taxes                        55,234                         15,334     
  receivable                                                                    
  Total current                    1,696,813                      1,620,889     
  assets                                                                        
  Property and                        65,507                         66,148     
  equipment, net                                                                
  Right-of-use                                                                  
  assets,                            191,373                        197,618     
  operating                                                                     
  leases                                                                        
  Goodwill                         2,224,991                      2,049,874     
  Intangible                         116,417                        121,160     
  assets, net                                                                   
  Deferred tax                        40,641                        106,238     
  assets                                                                        
  Other                                                                         
  non-current                        140,057                        120,247     
  assets                                                                        
  Total assets      $              4,475,799       $              4,282,174     
  Liabilities                                                                   
  and Equity                                                                    
  Current                                                                       
  liabilities:                                                                  
  Accounts          $                223,810       $                204,725     
  payable                                                                       
  Accrued                            325,294                        346,912     
  compensation                                                                  
  Contract                           406,937                        420,254     
  liabilities                                                                   
  Short-term                                                                    
  lease                                                                         
  liabilities,                        77,958                         69,099     
  operating                                                                     
  leases                                                                        
  Current                                                                       
  contingent                          49,352                         24,826     
  earn-out                                                                      
  liabilities                                                                   
  Liabilities                              -                         25,115     
  held-for-sale                                                                 
  Other current                      259,113                        288,113     
  liabilities                                                                   
  Total current                    1,342,464                      1,379,044     
  liabilities                                                                   
  Deferred tax                        18,964                         21,333     
  liabilities                                                                   
  Long-term debt                     891,957                        763,363     
  Long-term                                                                     
  lease                                                                         
  liabilities,                       134,999                        154,695     
  operating                                                                     
  leases                                                                        
  Non-current                                                                   
  contingent                          43,581                         32,135     
  earn-out                                                                      
  liabilities                                                                   
  Other                                                                         
  non-current                        159,503                        151,440     
  liabilities                                                                   
  Total                            2,591,468                      2,502,010     
  liabilities                                                                   
  Equity:                                                                       
  Preferred                                                                     
  stock -                                                                       
  authorized,                                                                   
  2,000 shares                                                                  
  of $0.01 par                                                                  
  value; no                                                                     
  shares issued                            -                              -     
  and                                                                           
  outstanding at                                                                
  September 27,                                                                 
  2026 and                                                                      
  September 28,                                                                 
  2025                                                                          
  Common stock -                                                                
  authorized,                                                                   
  750,000 shares                                                                
  of $0.01 par                                                                  
  value; issued                                                                 
  and                                                                           
  outstanding,                         2,533                          2,614     
  253,284 and                                                                   
  261,418 shares                                                                
  at September                                                                  
  27, 2026 and                                                                  
  September 28,                                                                 
  2025,                                                                         
  respectively                                                                  
  Accumulated                                                                   
  other                              (96,442  )                     (95,777  )  
  comprehensive                                                                 
  loss                                                                          
  Retained                         1,977,557                      1,872,948     
  earnings                                                                      
  Tetra Tech                                                                    
  stockholders'                    1,883,648                      1,779,785     
  equity                                                                        
  Noncontrolling                         683                            379     
  interests                                                                     
  Total                                                                         
  stockholders'                    1,884,331                      1,780,164     
  equity                                                                        
  Total                                                                         
  liabilities                                                                   
  and               $              4,475,799       $              4,282,174     
  stockholders'                                                                 
  equity                                                                        
                                                                                
                                Tetra Tech, Inc.                                
                                                                                
                       Consolidated Statements of Income                        
                                                                                
               (unaudited - in thousands, except per share data)                
                                                                                
          Three                               Fisc…                             
          Mont…                                Year                             
          Ended                               Ended                             
 ────────────────────────────────────────────────────────────────────────────── 
          Sept…             Sept…             Sept…             Sept…           
            27,               28,               27,               28,           
           2026              2025              2026              2025           
  Rev…        $  1,3…           $  1,3…           $  5,0…           $  5,4…     
  Sub…           (18…  )           (16…  )           (72…  )           (82…  )  
  cos…                                                                          
  Oth…                                                                          
  cos…           (88…  )           (88…  )           (3,…  )           (3,…  )  
  of                                                                            
  rev…                                                                          
  Gro…           265…              274…              943…              961…     
  pro…                                                                          
  Sel…                                                                          
  gen…                                                                          
  and            (84…  )           (10…  )           (33…  )           (35…  )  
  adm…                                                                          
  exp…                                                                          
  Leg…                                                                          
  con…              -                 -                 -              (11…  )  
  cos…                                                                          
  Imp…                                                                          
  of                -                 -                 -              (92…  )  
  goo…                                                                          
  Con…                                                                          
  con…                                                                          
  -              6,9…              9,8…              14,…              12,…     
  fair                                                                          
  val…                                                                          
  adj…                                                                          
  Inc…                                                                          
  from           188…              181…              618…              408…     
  ope…                                                                          
  Int…                                                                          
  exp…           (7,…  )           (6,…  )           (30…  )           (30…  )  
  net                                                                           
  Oth…                                                                          
  non…              -                 -              12,…                 -     
  inc…                                                                          
  Inc…                                                                          
  bef…                                                                          
  inc…           181…              174…              600…              377…     
  tax                                                                           
  exp…                                                                          
  Inc…                                                                          
  tax            (49…  )           (46…  )           (16…  )           (12…  )  
  exp…                                                                          
  Net            131…              127…              440…              247…     
  inc…                                                                          
  Net                                                                           
  inc…                                                                          
  att…           (185  )           (131  )           (771  )           (225  )  
  to                                                                            
  non…                                                                          
  int…                                                                          
  Net                                                                           
  inc…                                                                          
  att…        $  131…           $  127…           $  439…           $  247…     
  to                                                                            
  Tet…                                                                          
  Tech                                                                          
  Ear…                                                                          
  per                                                                           
  sha…                                                                          
  att…                                                                          
  to                                                                            
  Tet…                                                                          
  Tec…                                                                          
  Bas…        $  0.52           $  0.49           $  1.70           $  0.94     
  Dil…        $  0.51           $  0.48           $  1.69           $  0.93     
  Wei…                                                                          
  com…                                                                          
  sha…                                                                          
  out…                                                                          
  Bas…           254…              262…              258…              264…     
  Dil…           256…              264…              260…              267…     
  Cash                                                                          
  div…                                                                          
  paid           0.0…              0.0…              0.2…              0.2…     
  per                                                                           
  sha…                                                                          
                                                                                
                                Tetra Tech, Inc.                                
                                                                                
                     Consolidated Statements of Cash Flows                      
                                                                                
                           (unaudited - in thousands)                           
                                                                                
                        Fiscal Year                                             
                              Ended                                             
 ────────────────────────────────────────────────────────────────────────────── 
                      September 27,                 September 28,               
                               2026                          2025               
  Cash flows                                                                    
  from operating                                                                
  activities:                                                                   
  Net income                      $   440,729                   $   247,949     
  Adjustments to                                                                
  reconcile net                                                                 
  income to                                                                     
  net cash                                                                      
  provided by                                                                   
  operating                                                                     
  activities:                                                                   
  Depreciation                                                                  
  and                                  56,294                        58,276     
  amortization                                                                  
  Amortization                                                                  
  of stock-based                       36,561                        33,946     
  awards                                                                        
  Deferred                             64,254                       (11,297  )  
  income taxes                                                                  
  Provision for                                                                 
  losses on                             1,889                         3,150     
  accounts                                                                      
  receivables                                                                   
  Impairment of                             -                        92,416     
  goodwill                                                                      
  Gain on sale                                                                  
  of divested                         (12,361  )                          -     
  business                                                                      
  Fair value                                                                    
  adjustments to                      (14,421  )                    (12,228  )  
  contingent                                                                    
  consideration                                                                 
  Other non-cash                        2,936                         9,024     
  items                                                                         
  Changes in                                                                    
  operating                                                                     
  assets and                                                                    
  liabilities,                                                                  
  net of effects                                                                
  of business                                                                   
  acquisitions                                                                  
  and                                                                           
  divestitures:                                                                 
                                                                                
  Accounts                                                                      
  receivable and                       45,087                      (112,755  )  
  contract                                                                      
  assets                                                                        
  Prepaid                                                                       
  expenses and                         (9,719  )                    (30,563  )  
  other assets                                                                  
  Accounts                             10,118                         2,398     
  payable                                                                       
  Accrued                             (28,481  )                     18,879     
  compensation                                                                  
  Contract                            (13,836  )                     73,489     
  liabilities                                                                   
  Cash settled                                                                  
  contingent                                -                       (11,170  )  
  earn-out                                                                      
  liability                                                                     
  Income taxes                        (40,765  )                     23,227     
  receivable/pa…                                                                
  Other                               (15,266  )                     72,944     
  liabilities                                                                   
  Net cash                                                                      
  provided by                         523,019                       457,685     
  operating                                                                     
  activities                                                                    
  Cash flows                                                                    
  from investing                                                                
  activities:                                                                   
  Payments for                                                                  
  business                                                                      
  acquisitions,                      (191,870  )                    (97,263  )  
  net                                                                           
  of cash                                                                       
  acquired                                                                      
  Capital                             (20,485  )                    (18,633  )  
  expenditures                                                                  
  Proceeds from                                                                 
  sales of                                915                           919     
  assets                                                                        
  Proceeds from                                                                 
  company-owned                                                                 
  life                                      -                         1,934     
  insurance                                                                     
  policies                                                                      
  Proceeds from                                                                 
  divested                             40,263                         2,406     
  business, net                                                                 
  Proceeds from                                                                 
  loan repayment                                                                
  from                                      -                         3,883     
  divested                                                                      
  business                                                                      
  Net cash used                                                                 
  in investing                       (171,177  )                   (106,754  )  
  activities                                                                    
  Cash flows                                                                    
  from financing                                                                
  activities:                                                                   
  Proceeds from                       335,000                       715,000     
  borrowings                                                                    
  Repayments on                      (210,000  )                   (771,027  )  
  long-term debt                                                                
  Payment of                                                                    
  debt issuance                             -                        (2,738  )  
  costs                                                                         
  Repurchases of                     (302,010  )                   (249,984  )  
  common stock                                                                  
  Shares                                                                        
  repurchased                                                                   
  for tax                             (12,568  )                    (14,047  )  
  withholdings                                                                  
  on share-based                                                                
  awards                                                                        
  Payments of                                                                   
  contingent                          (20,841  )                    (15,055  )  
  earn-out                                                                      
  liabilities                                                                   
  Stock options                         1,394                           469     
  exercised                                                                     
  Dividends paid                      (70,827  )                    (65,039  )  
  Principal                                                                     
  payments on                          (8,024  )                     (7,823  )  
  finance leases                                                                
  Net cash used                                                                 
  in financing                       (287,876  )                   (410,244  )  
  activities                                                                    
  Effect of                                                                     
  exchange rate                                                                 
  changes on                            2,738                        (5,004  )  
  cash                                                                          
  and cash                                                                      
  equivalents                                                                   
  Net increase                                                                  
  (decrease) in                        66,704                       (64,317  )  
  cash and cash                                                                 
  equivalents                                                                   
  Cash and cash                                                                 
  equivalents at                      168,372                       232,689     
  beginning                                                                     
  of year                                                                       
  Cash and cash                                                                 
  equivalents at                  $   235,076                   $   168,372     
  end of year                                                                   
                                                                                
Tetra Tech, Inc.

Regulation G Information

September 27, 2026

Reconciliation of Revenue to Revenue, Net of Subcontractor Costs ("Net Revenue")

(in millions)


Reconciliation of Net Income Attributable to Tetra Tech to Adjusted EBITDA

(in thousands)


1Includes write-off of deferred debt origination fees of $3.8M in fiscal 2023

2Includes lease impairment charge of $16.4M in fiscal 2023

Sources

The 8-K item 2.02 filings (SEC EDGAR) and their EX-99 exhibits: the results release and, when filed, prepared remarks or the call transcript.

Also

Said vs did: the targets in these releases against what was then reported. Filings: every filing.

Work with it

Excel workbook · CSV. Google Sheet that stays up to date: paste =IMPORTDATA("https://tickdelta.com/company/TTEK/export.csv") into a cell.

Next:Presentations
Esc

Type a ticker such as AAPL, a name, an investor such as Buffett, or a topic such as tariffs. ↑ ↓ to move, Enter to open.