Paragraph 39 · 42% changed
Every version of it
Screener
/
SEC EDGAR
/CIK 0000857855
/10-K filed Feb 17, 2026, compared with Feb 27, 2025
/Numbers from the XBRL of the 10-Ks
NYSE
Financials · Banks
United Community Banks Inc UCB
The 10-K against last year's
203 changes: 61 added, 62 removed, 80 reworded
10-K Feb 17, 2026 vs Feb 27, 2025
Risk Factors
13.3%
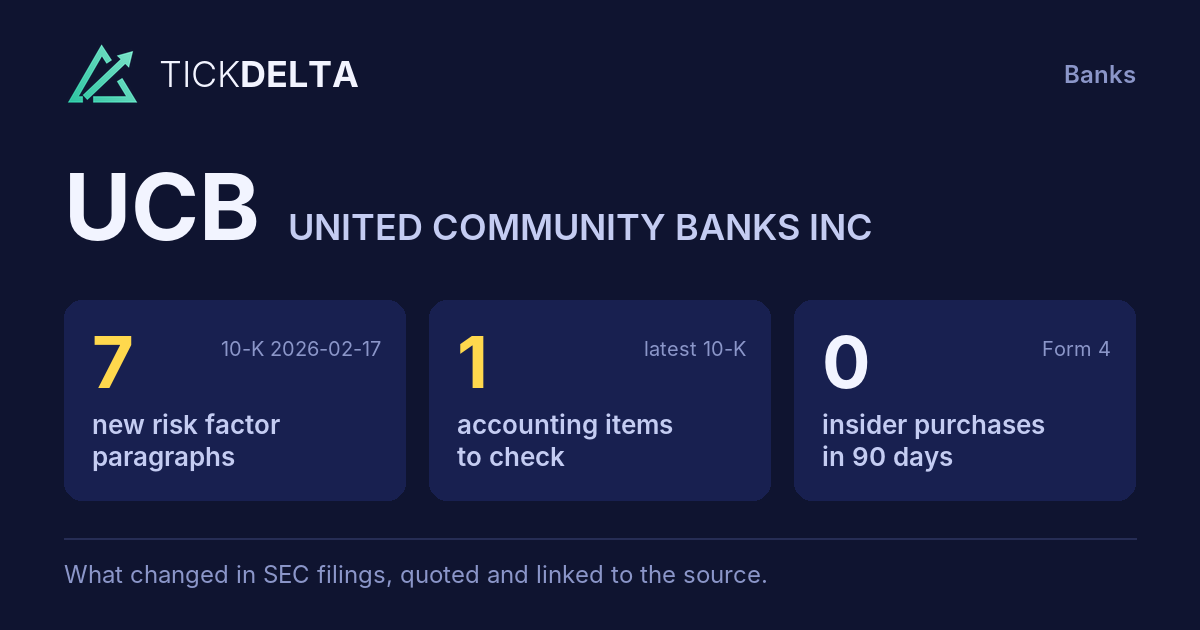
of the text changed · 10,873 words now · 7 new paragraphs, 5 gone
MD&A
50.5%
of the text changed · 9,224 words now · 54 new paragraphs, 57 gone
10-K 0000857855-26-000008 (Feb 17, 2026) vs 10-K 0000857855-25-000057 (Feb 27, 2025) Not compared: Legal Proceedings, Accounting Policies.
Every paragraph, and how much of it changed
One bar per paragraph, in the order of the 10-K. Height and colour show the share of its words not in the closest paragraph a year earlier; the tallest bars are new paragraphs.
Risk Factors
140 paragraphs · 7 new · 47 reworded · 5 gone · 10-K Feb 17, 2026 against Feb 27, 2025
New paragraph
Reworded (5% of its words or more)
Same or nearly
Paragraph 114 · 37% changed
Every version of it
Climate change presents both immediate and long-term risks to us and our customers and clients, with the risks expected to increase over time. Climate risks can arise from both physical risks and transition risks. The physical risk from climate change could result from increased frequency and/or severity of adverse weather events. Transition risks may arise from changes in regulations or market preferences toward a low-carbon economy, preferences, which in turn could have negative impacts on asset values, results of operations or our reputation or that of our customers and clients.
Paragraph 48 · 37% changed
Every version of it
Revenue growth in some of our lines of business depends upon top talent. In recent years, our cost of hiring and retaining top revenue-producing talent has increased, and that trend is likely to continue. We have assembled a management team which has substantial background and experience in banking and financial services in our markets. Moreover, much of our organic loan growth in recent years was the result of our ability to attract experienced financial services professionals who have been able to attract customers from other financial institutions. We anticipate deploying a similar hiring strategy in the future. It is also common for other financial institutions to deploy this strategy as well and there is a risk that teams of our employees may be recruited by other financial institutions. Additionally, operating our technology systems requires Loss of key employees with specialized skills that are not readily available in the general employee candidate pool. Inability extensive customer relationships may lead to retain these key personnel (including key personnel of the businesses we have acquired) or to continue to attract experienced lenders with established books of business could negatively affect our growth because of the loss of these individuals’ skills and customer relationships and/or the potential difficulty of promptly replacing them. Moreover, the higher costs we must pay business if customers were to hire and retain these experienced individuals could cause our noninterest expense levels follow that employee to rise and negatively impact our results of operations. another financial institution or otherwise choose to transition to another financial institution.
Paragraph 40 · 36% changed
Every version of it
We rely on may be adversely affected by disruptions in information technology and telecommunications systems and certain on which we rely, including those of third-party service providers, the operational functions of which may experience disruptions that could adversely affect us and over which providers where we may have limited or no control. control over operational functionality.
Paragraph 50 · 32% changed
Every version of it
The processes we use to estimate our expected credit losses and to measure the fair value of financial instruments, as well as the processes used to estimate the effects of changing interest rates and other market measures on our financial condition and results of operations, depend upon the use of analytical and forecasting models. These models reflect assumptions and rely on their design and other processes that may not be accurate, accurate or properly performed, particularly in times of market stress or other unforeseen circumstances. If the assumptions used in our model for measuring interest sensitivity and asset-liability management fail to appropriately anticipate customer response to changing interest rates, our earnings and / or liquidity position could be threatened. Although we model multiple scenarios assuming differing interest rate curves and economic events, it is not possible for our modeling to anticipate every scenario or how one assumption may be influenced by changes in another assumption.
Paragraph 101 · 30% changed
Every version of it
Uninsured deposits historically have been viewed by the FDIC as less stable than insured deposits. According to statements made by the FDIC staff and the leadership of the federal banking agencies, customers with larger uninsured deposit account balances often are small- and mid-sized businesses that rely upon deposit funds for payment of operational expenses and, as a result, are more likely to closely monitor the financial condition and performance of their depository institutions. As a result, in the event of financial distress, uninsured depositors historically have been more likely to withdraw their deposits.
Paragraph 110 · 25% changed
Every version of it
Maintaining and adapting our internal controls over financial reporting, disclosure controls and procedures and effective corporate governance policies and procedures (“controls and procedures”) is expensive and requires significant management attention. Moreover, as we continue to grow, our controls and procedures may become more complex and require additional resources to ensure they remain effective amid dynamic regulatory and other guidance. Failure to implement effective controls and procedures or circumvention of our controls and procedures could harm our business, results of operations and financial condition or cause us to fail to meet our public reporting obligations.
Paragraph 51 · 24% changed
Every version of it
Paragraph 39 · 42% changed
Every version of it
10-K Feb 27, 2025Cyber threats are rapidly evolving and we may not be able to anticipate or prevent all such attacks. Among other things, damage can occur due to outright theft or extortion of our funds, fraud or identity theft perpetrated on clients, or adverse publicity associated with a breach and its potential effects. Perpetrators potentially can be associates, clients, and certain vendors, all of whom legitimately have access to some portion of our systems, as well as outsiders with no legitimate access. These risks are heightened through the increasing use of digital and mobile solutions which allow for rapid money movement and increase the difficulty to detect and prevent fraudulent transactions. Additionally, as we grow through acquisitions and pursue new initiatives that improve our operations and cost structure, we are also expanding and improving our information technologies, resulting in a larger technological presence, utilization of “cloud” computing services, and corresponding exposure to cybersecurity risk. Certain new technologies, such as use of artificial intelligence, present new and significant cybersecurity safety risks that must be analyzed and addressed before implementation. If we fail to assess and identify cybersecurity risks associated with acquisitions and new initiatives, we may become increasingly vulnerable to such risks. We may be required to spend significant capital and other resources to protect against the threat of security breaches and computer viruses, or to alleviate problems caused by security breaches or viruses. To the extent that our activities or the activities of our customers involve the storage and transmission of confidential information, security breaches (including breaches of security of customer systems and networks) and viruses could expose us to claims, litigation and other possible liabilities. Any inability to prevent security breaches or computer viruses could also cause existing customers to lose confidence in our systems and could adversely affect our reputation, results of operations and ability to attract and maintain customers and businesses. In addition, a security breach could also subject us to additional regulatory scrutiny, expose us to civil litigation and possible financial liability and cause reputational damage.
10-K Feb 17, 2026
Certain new technologies, such as the use of artificial intelligence, present new and significant cybersecurity safety risks that must be analyzed and addressed before implementation. The emergence and maturation of artificial intelligence capabilities has led to new and/or more sophisticated methods of attack, including fraud that relies upon “deep fake” impersonation technology, or other forms of generative automation that have scaled up the effectiveness of cyber threat activity. Among other things, damage can occur due to theft or extortion of funds, fraud or identity theft perpetrated on clients, or adverse publicity associated with a breach and its potential effects. Perpetrators potentially can be associates, clients, and certain vendors, all of whom legitimately have access to some portion of our systems, as well as outsiders with no legitimate access. These risks are heightened through the increasing use of digital and mobile solutions which allow for rapid money movement and increase the difficulty to detect and prevent fraudulent transactions.
Paragraph 114 · 37% changed
Every version of it
10-K Feb 27, 2025
Transition risks may arise from changes in regulations or market preferences toward a low-carbon economy, which in turn could have negative impacts on asset values, results of operations or our reputation or that of our customers and clients.
10-K Feb 17, 2026
Climate change presents both immediate and long-term risks to us and our customers and clients, with the risks expected to increase over time. Climate risks can arise from both physical risks and transition risks. The physical risk from climate change could result from increased frequency and/or severity of adverse weather events. Transition risks may arise from changes in regulations or market preferences, which in turn could have negative impacts on asset values, results of operations or our reputation or that of our customers and clients.
Paragraph 48 · 37% changed
Every version of it
10-K Feb 27, 2025
In recent years, our cost of hiring and retaining top revenue-producing talent has increased, and that trend is likely to continue. We have assembled a management team which has substantial background and experience in banking and financial services in our markets. Moreover, much of our organic loan growth in recent years was the result of our ability to attract experienced financial services professionals who have been able to attract customers from other financial institutions. We anticipate deploying a similar hiring strategy in the future. It is also common for other financial institutions to deploy this strategy as well and there is a risk that teams of our employees may be recruited by other financial institutions. Additionally, operating our technology systems requires employees with specialized skills that are not readily available in the general employee candidate pool. Inability to retain these key personnel (including key personnel of the businesses we have acquired) or to continue to attract experienced lenders with established books of business could negatively affect our growth because of the loss of these individuals’ skills and customer relationships and/or the potential difficulty of promptly replacing them. Moreover, the higher costs we must pay to hire and retain these experienced individuals could cause our noninterest expense levels to rise and negatively impact our results of operations.
10-K Feb 17, 2026
Revenue growth in some of our lines of business depends upon top talent. In recent years, our cost of hiring and retaining top revenue-producing talent has increased, and that trend is likely to continue. Moreover, much of our organic loan growth in recent years was the result of our ability to attract experienced financial services professionals who have been able to attract customers from other financial institutions. It is also common for other financial institutions to deploy this strategy as well and there is a risk that teams of our employees may be recruited by other financial institutions. Loss of key employees with extensive customer relationships may lead to the loss of business if customers were to follow that employee to another financial institution or otherwise choose to transition to another financial institution.
Paragraph 40 · 36% changed
Every version of it
10-K Feb 27, 2025
We rely on information technology and telecommunications systems and certain third-party service providers, the operational functions of which may experience disruptions that could adversely affect us and over which we may have limited or no control.
10-K Feb 17, 2026
We may be adversely affected by disruptions in information technology and telecommunications systems on which we rely, including those of third-party service providers where we may have limited or no control over operational functionality.
Paragraph 50 · 32% changed
Every version of it
10-K Feb 27, 2025
The processes we use to estimate our expected credit losses and to measure the fair value of financial instruments, as well as the processes used to estimate the effects of changing interest rates and other market measures on our financial condition and results of operations, depend upon the use of analytical and forecasting models. These models reflect assumptions that may not be accurate, particularly in times of market stress or other unforeseen circumstances. If the assumptions used in our model for measuring interest sensitivity and asset-liability management fail to appropriately anticipate customer response to changing interest rates, our earnings and / or liquidity position could be threatened. Although we model multiple scenarios assuming differing interest rate curves and economic events, it is not possible for our modeling to anticipate every scenario or how one assumption may be influenced by changes in another assumption.
10-K Feb 17, 2026
The processes we use to estimate our expected credit losses and to measure the fair value of financial instruments, as well as the processes used to estimate the effects of changing interest rates and other market measures on our financial condition and results of operations, depend upon the use of analytical and forecasting models. These models reflect assumptions and rely on their design and other processes that may not be accurate or properly performed, particularly in times of market stress or other unforeseen circumstances.
Paragraph 101 · 30% changed
Every version of it
10-K Feb 27, 2025
Uninsured deposits historically have been viewed by the FDIC as less stable than insured deposits. According to statements made by the FDIC staff and the leadership of the federal banking agencies, customers with larger uninsured deposit account balances often are small- and mid-sized businesses that rely upon deposit funds for payment of operational expenses and, as a result, are more likely to closely monitor the financial condition and performance of their depository institutions. As a result, in the event of financial distress, uninsured depositors historically have been more likely to withdraw their deposits.
10-K Feb 17, 2026
Uninsured deposits historically have been viewed by the FDIC as less stable than insured deposits. According to statements made by the FDIC staff and the leadership of the federal banking agencies, customers with larger uninsured deposit account balances often are
Paragraph 110 · 25% changed
Every version of it
10-K Feb 27, 2025
Maintaining and adapting our internal controls over financial reporting, disclosure controls and procedures and effective corporate governance policies and procedures (“controls and procedures”) is expensive and requires significant management attention. Moreover, as we continue to grow, our controls and procedures may become more complex and require additional resources to ensure
10-K Feb 17, 2026
Maintaining and adapting our internal controls over financial reporting, disclosure controls and procedures and effective corporate governance policies and procedures (“controls and procedures”) is expensive and requires significant management attention. Moreover, as we continue to grow, our controls and procedures may become more complex and require additional resources to ensure they remain effective amid dynamic regulatory and other guidance. Failure to implement effective controls and procedures or circumvention of our controls and procedures could harm our business, results of operations and financial condition or cause us to fail to meet our public reporting obligations.
Paragraph 51 · 24% changed
Every version of it
10-K Feb 27, 2025The processes we use to estimate our expected credit losses and to measure the fair value of financial instruments, as well as the processes used to estimate the effects of changing interest rates and other market measures on our financial condition and results of operations, depend upon the use of analytical and forecasting models. These models reflect assumptions that may not be accurate, particularly in times of market stress or other unforeseen circumstances. If the assumptions used in our model for measuring interest sensitivity and asset-liability management fail to appropriately anticipate customer response to changing interest rates, our earnings and / or liquidity position could be threatened. Although we model multiple scenarios assuming differing interest rate curves and economic events, it is not possible for our modeling to anticipate every scenario or how one assumption may be influenced by changes in another assumption.
10-K Feb 17, 2026
If the assumptions used in our model for measuring interest sensitivity and asset-liability management fail to appropriately anticipate customer response to changing interest rates, our earnings and / or liquidity position could be threatened. Although we model multiple scenarios assuming differing interest rate curves and economic events, it is not possible for our modeling to anticipate every scenario or how one assumption may be influenced by changes in another assumption. Similarly, models used to estimate credit losses rely on various assumptions that may not ultimately result in accurate loss predictions.
MD&A
141 paragraphs · 54 new · 56 reworded · 57 gone · 10-K Feb 17, 2026 against Feb 27, 2025
New paragraph
Reworded (5% of its words or more)
Same or nearly
Paragraph 93 · 50% changed
recorded. At both December 31, 2025 and 2024, HTM debt securities had a fair value of $1.94 billion, indicating net unrealized losses of $424 million. Additional unrealized losses on HTM debt securities of $59.5 million (pre-tax) were included in AOCI as a result of there was no ACL related to the transfer of AFS debt securities to HTM in 2022. portfolio. Unrealized losses were at December 31, 2025 and 2024 primarily attributable to reflected the effect of changes in interest rates.
Paragraph 61 · 50% changed
The total ACL for loans at December 31, 2024 decreased by $1.07 2025 totaled $210 million compared to $207 million at December 31, 2023 2024 and the ACL for loans as a percentage of total loans remained constant. During decreased to 1.09% from 1.14%. The increase in ACL was primarily attributable to loan growth and the third quarter initial allowance established for ANB, partially offset by the full release of 2024, we established an additional the Hurricane Helene related allowance over the course of $9.89 2025. The initial ACL for ANB loans totaled $3.65 million, $1.25 million related of which was reclassified from the fair value of PCD loans with no impact to expected loan losses in nine counties in western North Carolina severely affected by earnings. The Hurricane Helene, which we maintained as of Helene reserve was $9.80 million at December 31, 2024 as we continue to monitor the impact of the hurricane and was gradually released throughout 2025 based on our borrowers. Over half assessment of this allowance was allocated to the residential mortgage portfolio. As of December 31, 2024, we had $27.9 million in loans with hurricane-related short-term payment deferrals. Additionally, there was an increase in the ACL for equipment financing loans driven mostly by potential storm-related loan growth and recent charge-off history. These increases were partly offset by the $9.89 million decrease in ACL for manufactured housing loans, as we sold substantially all of that portfolio during the third quarter of 2024. losses. Our ACL for unfunded commitments decreased totaled $15.1 million at December 31, 2025 compared to $10.4 million at December 31, 2024, mostly due to a decrease an increase in our construction commitments.
Paragraph 102 · 50% changed
Paragraph 92 · 48% changed
For AFS debt securities in an unrealized loss position, if we intend to sell, or if it is more likely than not that we will be required to sell the security before recovery of its amortized cost basis, the security's amortized cost basis is written down to fair value through income. Absent absent circumstances when an AFS security the securities would be sold, we evaluate whether the decline in fair value has resulted from credit losses or other factors. The evaluation considers factors such as the extent to which fair value is less than amortized cost, changes to the security’s rating, and adverse conditions specific to the security. If the evaluation indicates a credit loss exists, an ACL may be recorded, with such allowance limited to the amount by which fair value is below amortized cost. Any impairment unrelated to credit factors is recognized in OCI. At December 31, 2024, there was no ACL related to the AFS debt securities portfolio. Unrealized losses at December 31, 2024 primarily reflected the effect of changes in interest rates.
Paragraph 6 · 48% changed
•On May 1, 2025, we completed the acquisition of ANB, which was headquartered in Oakland Park, Florida where it operated one banking location. In the past two years, acquisition, we have continued to expand through acquisitions, which are described below. The acquired entities’ $301 million in loans and $374 million in deposits. ANB’s results are included in our consolidated results beginning on their respective acquisition dates. May 1, 2025. We continue to evaluate future potential transactions as opportunities arise.
Paragraph 27 · 47% changed
Wealth management fees for 2024 were flat decreased in 2025 compared to 2023. Our total 2024, which included nine months of fees from FinTrust prior to the sale of that business in October of 2024. However, our assets under management and advisement as of at December 31, 2025 increased to $3.40 billion from $3.15 billion at December 31, 2024 and 2023, were $3.15 billion and $5.29 billion, respectively. The decrease reflects the sale of FinTrust, which closed October 1, 2024. as we continue to grow our United Community Private Wealth division.
Paragraph 26 · 47% changed
The increase decrease in mortgage loan gains and related fees was primarily a result of an increase in mortgage loan gains of $6.42 million and an increase a decrease in mortgage servicing income, income of $2.39 million, which includes fair value adjustments to our mortgage servicing asset, of $2.52 million. The increase in mortgage loan gains resulted from higher sales volume as we sold a higher percentage of our mortgage production in 2024 compared to 2023. As reflected in the following table, mortgage origination and rate lock demand declined slightly, but remained relatively stable from 2023 to 2024 as mortgage interest rates remained elevated during 2024. asset.
Paragraph 35 · 46% changed
Paragraph 93 · 50% changed
10-K Feb 27, 2025
At December 31, 2024, HTM debt securities had a fair value of $1.94 billion, indicating net unrealized losses of $424 million. Additional unrealized losses on HTM debt securities of $59.5 million (pre-tax) were included in AOCI as a result of the transfer of AFS debt securities to HTM in 2022. Unrealized losses were primarily attributable to changes in interest rates.
10-K Feb 17, 2026
recorded. At both December 31, 2025 and 2024, there was no ACL related to the AFS debt securities portfolio. Unrealized losses at December 31, 2025 and 2024 primarily reflected the effect of changes in interest rates.
Paragraph 61 · 50% changed
10-K Feb 27, 2025
The total ACL for loans at December 31, 2024 decreased by $1.07 million compared to December 31, 2023 and the ACL for loans as a percentage of total loans remained constant. During the third quarter of 2024, we established an additional allowance of $9.89 million related to expected loan losses in nine counties in western North Carolina severely affected by Hurricane Helene, which we maintained as of December 31, 2024 as we continue to monitor the impact of the hurricane on our borrowers. Over half of this allowance was allocated to the residential mortgage portfolio. As of December 31, 2024, we had $27.9 million in loans with hurricane-related short-term payment deferrals. Additionally, there was an increase in the ACL for equipment financing loans driven mostly by loan growth and recent charge-off history. These increases were partly offset by the $9.89 million decrease in ACL for manufactured housing loans, as we sold substantially all of that portfolio during the third quarter of 2024. Our ACL for unfunded commitments decreased mostly due to a decrease in our construction commitments.
10-K Feb 17, 2026
The ACL for loans at December 31, 2025 totaled $210 million compared to $207 million at December 31, 2024 and the ACL for loans as a percentage of total loans decreased to 1.09% from 1.14%. The increase in ACL was primarily attributable to loan growth and the initial allowance established for ANB, partially offset by the full release of the Hurricane Helene related allowance over the course of 2025. The initial ACL for ANB loans totaled $3.65 million, $1.25 million of which was reclassified from the fair value of PCD loans with no impact to earnings. The Hurricane Helene reserve was $9.80 million at December 31, 2024 and was gradually released throughout 2025 based on our assessment of potential storm-related loan losses. Our ACL for unfunded commitments totaled $15.1 million at December 31, 2025 compared to $10.4 million at December 31, 2024, mostly due to an increase in construction commitments.
Paragraph 102 · 50% changed
10-K Feb 27, 2025The exposure to credit loss in the event of nonperformance by the other party to the commitments to extend credit, letters of credit and financial guarantees is represented by the contractual amount of these instruments. We use the same credit underwriting procedures for making commitments, letters of credit and financial guarantees as we use for underwriting on-balance sheet instruments. Management evaluates each customer’s creditworthiness on a case-by-case basis and the amount of the collateral, if deemed necessary, is based on the credit evaluation. Collateral held varies, but may include unimproved and improved real estate, certificates of deposit, personal property or other acceptable collateral.
10-K Feb 17, 2026
the credit evaluation. Collateral held varies, but may include unimproved and improved real estate, certificates of deposit, personal property or other acceptable collateral.
Paragraph 92 · 48% changed
10-K Feb 27, 2025
For AFS debt securities in an unrealized loss position, if we intend to sell, or if it is more likely than not that we will be required to sell the security before recovery of its amortized cost basis, the security's amortized cost basis is written down to fair value through income. Absent circumstances when an AFS security would be sold, we evaluate whether the decline in fair value has resulted from credit losses or other factors. The evaluation considers factors such as the extent to which fair value is less than amortized cost, changes to the security’s rating, and adverse conditions specific to the security. If the evaluation indicates a credit loss exists, an ACL may be recorded, with such allowance limited to the amount by which fair value is below amortized cost. Any impairment unrelated to credit factors is recognized in OCI. At December 31, 2024, there was no ACL related to the AFS debt securities portfolio. Unrealized losses at December 31, 2024 primarily reflected the effect of changes in interest rates.
10-K Feb 17, 2026
For AFS debt securities in an unrealized loss position, absent circumstances when the securities would be sold, we evaluate whether the decline in fair value has resulted from credit losses or other factors. If the evaluation indicates a credit loss exists, an ACL may be
Paragraph 6 · 48% changed
10-K Feb 27, 2025
In the past two years, we have continued to expand through acquisitions, which are described below. The acquired entities’ results are included in our consolidated results beginning on their respective acquisition dates. We continue to evaluate potential transactions as opportunities arise.
10-K Feb 17, 2026
•On May 1, 2025, we completed the acquisition of ANB, which was headquartered in Oakland Park, Florida where it operated one banking location. In the acquisition, we acquired $301 million in loans and $374 million in deposits. ANB’s results are included in our consolidated results beginning on May 1, 2025. We continue to evaluate future potential transactions as opportunities arise.
Paragraph 27 · 47% changed
10-K Feb 27, 2025
Wealth management fees for 2024 were flat compared to 2023. Our total assets under management and advisement as of December 31, 2024 and 2023, were $3.15 billion and $5.29 billion, respectively. The decrease reflects the sale of FinTrust, which closed October 1, 2024.
10-K Feb 17, 2026
Wealth management fees decreased in 2025 compared to 2024, which included nine months of fees from FinTrust prior to the sale of that business in October of 2024. However, our assets under management at December 31, 2025 increased to $3.40 billion from $3.15 billion at December 31, 2024 as we continue to grow our United Community Private Wealth division.
Paragraph 26 · 47% changed
10-K Feb 27, 2025
The increase in mortgage loan gains and related fees was primarily a result of an increase in mortgage loan gains of $6.42 million and an increase in mortgage servicing income, which includes fair value adjustments to our mortgage servicing asset, of $2.52 million. The increase in mortgage loan gains resulted from higher sales volume as we sold a higher percentage of our mortgage production in 2024 compared to 2023. As reflected in the following table, mortgage origination and rate lock demand declined slightly, but remained relatively stable from 2023 to 2024 as mortgage interest rates remained elevated during 2024.
10-K Feb 17, 2026
The decrease in mortgage loan gains and related fees was primarily a result of a decrease in mortgage servicing income of $2.39 million, which includes fair value adjustments to our mortgage servicing asset.
Paragraph 35 · 46% changed
10-K Feb 27, 2025Salaries and employee benefits for 2024 increased $21.6 million compared to 2023. The increase was driven by higher total compensation including merit increases along with higher group medical insurance costs. The increase in salaries was also driven by the inclusion of First Miami employees for the full year in 2024. Full time equivalent headcount totaled 2,979 at December 31, 2024, down 5% from 3,121 at December 31, 2023, which is partly attributable to the sale of FinTrust and reduction in staff dedicated to the manufactured housing loan portfolio.
10-K Feb 17, 2026
The increase in salaries and employee benefits was driven by higher total compensation, reflecting annual merit increases that went into effect on April 1, 2025, higher performance-related incentive compensation and the addition of ANB employees on May 1, 2025. Full time equivalent headcount totaled 3,070 at December 31, 2025, up 3% from 2,979 at December 31, 2024.
A paragraph is matched with the one last year that shares the most of its words; under half in common makes it new. The paragraphs shown are the 8 reworded the most in each section.
The paragraph that changed most in each section
The redline
Marked against last year's 10-K: cut words struck through, new words highlighted.
MD&A225 words changed in this paragraph; it is 31% similar to last year's version.
The total ACL for loans at December 31, 2024 decreased by $1.07 2025 totaled $210 million compared to $207 million at December 31, 2023 2024 and the ACL for loans as a percentage of total loans remained constant. During decreased to 1.09% from 1.14%. The increase in ACL was primarily attributable to loan growth and the third quarter initial allowance established for ANB, partially offset by the full release of 2024, we established an additional the Hurricane Helene related allowance over the course of $9.89 2025. The initial ACL for ANB loans totaled $3.65 million, $1.25 million related of which was reclassified from the fair value of PCD loans with no impact to expected loan losses in nine counties in western North Carolina severely affected by earnings. The Hurricane Helene, which we maintained as of Helene reserve was $9.80 million at December 31, 2024 as we continue to monitor the impact of the hurricane and was gradually released throughout 2025 based on our borrowers. Over half assessment of this allowance was allocated to the residential mortgage portfolio. As of December 31, 2024, we had $27.9 million in loans with hurricane-related short-term payment deferrals. Additionally, there was an increase in the ACL for equipment financing loans driven mostly by potential storm-related loan growth and recent charge-off history. These increases were partly offset by the $9.89 million decrease in ACL for manufactured housing loans, as we sold substantially all of that portfolio during the third quarter of 2024. losses. Our ACL for unfunded commitments decreased totaled $15.1 million at December 31, 2025 compared to $10.4 million at December 31, 2024, mostly due to a decrease an increase in our construction commitments.
Source: Item 7, 10-K 0000857855-26-000008 vs Item 7, 10-K 0000857855-25-000057
Risk Factors163 words changed in this paragraph; it is 53% similar to last year's version.
Revenue growth in some of our lines of business depends upon top talent. In recent years, our cost of hiring and retaining top revenue-producing talent has increased, and that trend is likely to continue. We have assembled a management team which has substantial background and experience in banking and financial services in our markets. Moreover, much of our organic loan growth in recent years was the result of our ability to attract experienced financial services professionals who have been able to attract customers from other financial institutions. We anticipate deploying a similar hiring strategy in the future. It is also common for other financial institutions to deploy this strategy as well and there is a risk that teams of our employees may be recruited by other financial institutions. Additionally, operating our technology systems requires Loss of key employees with specialized skills that are not readily available in the general employee candidate pool. Inability extensive customer relationships may lead to retain these key personnel (including key personnel of the businesses we have acquired) or to continue to attract experienced lenders with established books of business could negatively affect our growth because of the loss of these individuals’ skills and customer relationships and/or the potential difficulty of promptly replacing them. Moreover, the higher costs we must pay business if customers were to hire and retain these experienced individuals could cause our noninterest expense levels follow that employee to rise and negatively impact our results of operations. another financial institution or otherwise choose to transition to another financial institution.
Source: Item 1A, 10-K 0000857855-26-000008 vs Item 1A, 10-K 0000857855-25-000057
Sentences and paragraphs added, removed or reworded
Every change, by type
Sentences and paragraphs of UCB's Risk Factors and MD&A, 10-K Feb 17, 2026 against 10-K Feb 27, 2025. Each links to the text at sec.gov.
Quiet changes are sentences kept from last year with one to four words changed, at least one of them a hedge, a modal or a qualifier (may, could, will, not, significant, material…). A year or date rolling forward is not counted.
The full word list
adverse, adversely, all, although, anticipate, anticipates, any, approximately, believe, believes, can, cannot, certain, could, expect, expects, generally, however, if, intend, intends, largely, likely, many, material, materially, may, might, most, must, never, no, not, possible, primarily, probable, should, significant, significantly, some, substantial, substantially, unlikely, will, would
AddedRisk Factors
Cyberattacks are increasing in number and sophistication and we may be unable to anticipate or prevent such attacks.
Read it in 10-K Feb 17, 2026 at sec.gov
AddedRisk Factors
material adverse effect on our financial condition and results of operations. Our ability to recoup our losses may be limited legally or practically in many situations.
Read it in 10-K Feb 17, 2026 at sec.gov
AddedRisk Factors
We may not be able to attract and retain management-level and specialized talent.
Read it in 10-K Feb 17, 2026 at sec.gov
AddedRisk Factors
We have assembled a management team which has substantial background and experience in banking and financial services in our markets. Our success depends on our ability to retain a strong management team and key personnel in specialized knowledge areas because of their skills, knowledge of our markets, years of industry experience, and/or the difficulty of promptly finding qualified replacement personnel. The unexpected loss of one or more of these key personnel (including key personnel within any businesses we have acquired) could have a material adverse impact on our business.
Read it in 10-K Feb 17, 2026 at sec.gov
AddedRisk Factors
Our inability to retain and attract experienced bankers could negatively affect our growth.
Read it in 10-K Feb 17, 2026 at sec.gov
AddedRisk Factors
administration seeks to implement a regulatory reform agenda that potentially is significantly different than that of the prior administration, which will affect the rulemaking, supervision, examination and enforcement priorities of the federal banking agencies. While we do not specifically know what these changes will be, or what future administrations may seek to reverse, we may be required to implement different compliance procedures and modify our policies and activities to comply with changes set forth by the administration. This may cause us to incur additional costs and expenses, and dedicate additional resources, to achieve compliance with any changes from the administration, which can impact our financial condition and the results of our operations
Read it in 10-K Feb 17, 2026 at sec.gov
AddedRisk Factors
In addition, the current Presidential administration and Congress are expected to significantly change the priorities, scope, practices and/or staffing levels of various regulatory agencies, including the CFPB. As a result, state attorneys general and other state regulators may increase their enforcement activities to fill any actual or perceived “regulatory gap” at the federal level and seek to obtain remedies such as regulatory sanctions, customer rescission rights and civil money penalties. Such uncertainties may make it more difficult for us to comply with consumer protection laws, which may result in increased compliance costs and potential non-compliance and associated regulatory actions. Any regulatory actions against us could have a material adverse effect on our business, financial condition or results of operations.
Read it in 10-K Feb 17, 2026 at sec.gov
RemovedRisk Factors
Show the other 52
RemovedRisk Factors
RemovedRisk Factors
RemovedRisk Factors
RemovedRisk Factors
RewordedRisk Factors
Our financial performance generally, is highly dependent upon the economic landscape in the markets where we operate and in particular the United States as a whole and how it impacts borrowers’ ability of borrowers to pay interest on and repay principal of outstanding loans and loans, the value of underlying collateral securing those loans, as well as demand for loans and other products and services we offer, is highly dependent upon the business environment in the markets where we operate and in the United States as a whole. offer.
Read it in 10-K Feb 17, 2026 at sec.gov
RewordedRisk Factors
If sustained or repeated, a system failure or service denial could result in a deterioration of our ability to process new and renewed loans, gather deposits and provide customer service, compromise our ability to operate effectively, damage our reputation, result in a loss of customer business and/or subject us to additional regulatory scrutiny and possible financial liability, any of which could have a material adverse effect on our financial condition and results of operations. service.
Read it in 10-K Feb 17, 2026 at sec.gov
RewordedRisk Factors
RewordedRisk Factors
Additional information concerning these risks regarding the U.S. capital standards and our management of them, all of which is incorporated into this Item 1A by this reference, them appears: under the captions caption Capital Adequacy and Prompt Corrective Action in Item 1 of this report; under the caption “Capital Resources and Dividends” Risk Management” of Part II, Item 7.
Read it in 10-K Feb 17, 2026 at sec.gov
RewordedRisk Factors
According to statements made by the FDIC staff and the leadership of the federal banking agencies, customers with larger uninsured deposit account balances often are small- and mid-sized businesses that rely upon deposit funds for payment of operational expenses and, as a result, are more likely to closely monitor the financial condition and performance of their depository institutions.
Read it in 10-K Feb 17, 2026 at sec.gov
RewordedRisk Factors
This framework is comprised of various processes, systems and strategies, and is designed to identify, measure, assess, monitor, report and manage the types of risk to which we are subject, including, among others, credit risk, credit, capital, interest rate risk, liquidity risk, rate, liquidity, legal and regulatory risk, cybersecurity risk, compliance risk, strategic risk, regulatory, cybersecurity, compliance, strategic, reputational risk and operational risk risks related to its our employees, systems and vendors, among others.
Read it in 10-K Feb 17, 2026 at sec.gov
RewordedRisk Factors
Additionally, instruments, systems systems, controls and strategies used to hedge or otherwise understand and manage exposure to various types of interest rate, price, legal and regulatory compliance, credit, liquidity, operational and business the risks and enterprise-wide risk we are subject to could be less effective than anticipated.
Read it in 10-K Feb 17, 2026 at sec.gov
RewordedRisk Factors
If our risk management framework is not effective, we could suffer unexpected losses and become subject to litigation, negative regulatory consequences, or reputational damage among other adverse consequences, any of which could result in our business, financial condition, results of operations or prospects being materially adversely affected.
Read it in 10-K Feb 17, 2026 at sec.gov
RewordedRisk Factors
Additionally, the 2025 incoming current federal administration has deployed and may continue to deploy new trading strategies, such as tariffs on U.S. imports, which have created and may continue to create economic volatility.
Read it in 10-K Feb 17, 2026 at sec.gov
RewordedRisk Factors
Payments of the principal and interest on the senior subordinated debentures, subordinated debentures and the subordinated debentures including those accompanying the trust preferred securities and dividends on the preferred stock are senior to payments with respect to shares of our common stock.
Read it in 10-K Feb 17, 2026 at sec.gov
RewordedRisk Factors
These models reflect assumptions and rely on their design and other processes that may not be accurate, accurate or properly performed, particularly in times of market stress or other unforeseen circumstances.
Read it in 10-K Feb 17, 2026 at sec.gov
RewordedRisk Factors
AddedMD&A
•During 2025, we completed the following transactions in accordance with our ongoing capital management strategy:
Read it in 10-K Feb 17, 2026 at sec.gov
AddedMD&A
◦On September 15, 2025, we redeemed all outstanding shares of our Series I preferred stock, which had a carrying value of $88.3 million.
Read it in 10-K Feb 17, 2026 at sec.gov
AddedMD&A
◦We redeemed two series of senior debt instruments prior to maturity totaling $135 million.
Read it in 10-K Feb 17, 2026 at sec.gov
AddedMD&A
We reported net income and diluted earnings per common share of $328 million and $2.62, respectively, in 2025 compared to $252 million and $2.04, respectively, in 2024. Net income - operating and diluted earnings per common share - operating for 2025 were $336 million and $2.71, respectively, compared to $284 million and $2.30, respectively, for 2024. Net income - operating for 2025 excludes merger-related and other charges, while 2024 also excludes additional items, notably the loss on the sale of the manufactured housing loans of $27.2 million and the loss on the sale of FinTrust of $5.10 million. See Table 21 of MD&A for the Non-GAAP Performance Measures Reconciliation for further detail on operating net income and operating diluted earnings per share.
Read it in 10-K Feb 17, 2026 at sec.gov
AddedMD&A
In addition, noninterest income for 2025 increased $29.3 million, or 23%, compared to 2024, which is mostly due to the absence of the 2024 loss on the manufactured housing loan sale mentioned above. See Table 4 of MD&A for further detail on noninterest income.
Read it in 10-K Feb 17, 2026 at sec.gov
AddedMD&A
FTE net interest revenue for 2025 was $913 million, compared to $832 million for 2024. The net interest spread was 2.68% and 2.27% for 2025 and 2024, respectively, while the net interest margin was 3.52% and 3.29%, respectively. Improvement in the net interest spread and net interest margin resulted from reductions totaling 175 basis points in the federal funds rate beginning in September of 2024, which drove decreases in funding costs, and to a lesser extent, loan yields. The increase in net interest revenue also reflects eight months of net interest revenue from the loans and deposits acquired from ANB, which closed on May 1, 2025. Interest expense on deposits decreased $71.8 million, which was mostly driven by a decrease in interest rates paid on deposits, partially offset by deposit growth. In addition, during late 2024 and 2025 we redeemed several debt issuances, which was the primary driver of the reduction in interest expense on long-term debt of $6.31 million.
Read it in 10-K Feb 17, 2026 at sec.gov
AddedMD&A
The increase in other lending and loan servicing fees was mostly driven by an increase in equipment financing fee revenue.
Read it in 10-K Feb 17, 2026 at sec.gov
AddedMD&A
Customer derivative fees were up due to stronger loan growth and increased product demand, attributable to the lower interest rate environment compared to the same periods of 2024.
Read it in 10-K Feb 17, 2026 at sec.gov
AddedMD&A
Communications and equipment expense increased primarily due to new software contracts and incremental software contract costs on existing contracts, including volume based increases.
Read it in 10-K Feb 17, 2026 at sec.gov
AddedMD&A
FDIC assessments and other regulatory charges decreased for 2025 as the comparative period of 2024 included $1.74 million of FDIC special assessment expense.
Read it in 10-K Feb 17, 2026 at sec.gov
AddedMD&A
Other noninterest expense decreased for 2025 as the 2024 comparative period included a $5.39 million loss on the sale of FinTrust. In addition, during 2025, fraud losses declined compared to 2024.
Read it in 10-K Feb 17, 2026 at sec.gov
AddedMD&A
Our business purpose is to provide financial services and products to customers, which inherently comes with risk. We strive to manage, mitigate and optimize that risk appropriately. We maintain an enterprise risk framework that provides for the structure of the governance and oversight of our primary risk categories, which are outlined below.
Read it in 10-K Feb 17, 2026 at sec.gov
RemovedMD&A
RemovedMD&A
RemovedMD&A
RemovedMD&A
RemovedMD&A
RemovedMD&A
RemovedMD&A
RemovedMD&A
RemovedMD&A
RemovedMD&A
RemovedMD&A
RemovedMD&A
RewordedMD&A
Table 1 (Continued) 21 - Non-GAAP Performance Measures Reconciliation Selected Financial Information For the Years Ended December 31, (dollars in thousands, except per share data) 2025 2024 2023 2022 Noninterest income reconciliation Noninterest income (GAAP) $ 154,045 $ 124,756 $ 75,483 $ 137,707 Loss on sale of manufactured housing loans — 27,209 — — Gain on lease termination — (2,400) — — Bond portfolio restructuring loss — — 51,689 — Noninterest income - operating $ 154,045 $ 149,565 $ 127,172 $ 137,707 Noninterest expenses expense reconciliation Noninterest expenses expense (GAAP) $ 591,934 $ 578,167 $ 571,273 $ 470,149 Loss on FinTrust (goodwill impairment) including goodwill impairment — (5,100) — — FDIC special assessment — (1,736) (9,995) — Merger-related and other charges (10,204) (8,623) (27,210) (19,375) Noninterest expenses expense - operating $ 581,730 $ 562,708 $ 534,068 $ 450,774 Net income reconciliation Net income (GAAP) $ 328,095 $ 252,397 $ 187,544 $ 277,472 Loss on sale of manufactured housing loans — 27,209 — — Bond portfolio restructuring loss — — 51,689 — Gain on lease termination — (2,400) — — Loss on FinTrust (goodwill impairment) sale of FinTrust, including goodwill impairment — 5,100 — — FDIC special assessment — 1,736 9,995 — Merger-related and other charges 10,204 8,623 27,210 19,375 Income tax benefit of non-operating items (2,212) (8,702) (21,489) (4,246) Net income - operating $ 336,087 $ 283,963 $ 254,949 $ 292,601 Diluted income per common share reconciliation Diluted income per common share (GAAP) $ 2.62 $ 2.04 $ 1.54 $ 2.52 Loss on sale of manufactured housing loans — 0.18 — Deemed dividend on preferred stock redemption 0.03 — — Bond portfolio restructuring loss — — 0.33 — Gain on lease termination — (0.02) — — Loss on FinTrust (goodwill impairment) sale of FinTrust, including goodwill impairment — 0.03 — — FDIC special assessment — 0.01 0.06 — Merger-related and other charges 0.06 0.06 0.18 0.14 Diluted income per common share - operating $ 2.71 $ 2.30 $ 2.11 $ 2.66 Book value per common share reconciliation Book value per common share (GAAP) $ 30.17 $ 27.87 $ 26.52 $ 24.38 Effect of goodwill and other intangibles (7.93) (7.87) (8.13) (7.25) Tangible book value per common share $ 22.24 $ 20.00 $ 18.39 $ 17.13 Return on tangible common equity reconciliation Return on common equity (GAAP) 9.12 % 7.07 % 5.34 % 9.54 % Loss on sale of manufactured housing loans — 0.61 — Deemed dividend on preferred stock redemption 0.09 — — Bond portfolio restructuring loss — — 1.15 — Gain on lease termination — (0.05) — — Loss on FinTrust (goodwill impairment) sale of FinTrust, including goodwill impairment — 0.11 — — FDIC special assessment — 0.04 0.22 — Merger-related and other charges 0.23 0.19 0.62 0.53 Return on common equity - operating 9.44 7.97 7.33 10.07 Effect of goodwill and other intangibles 3.90 3.45 3.30 3.97 Return on tangible common equity - operating 13.34 % 11.42 % 10.63 % 14.04 %
Read it in 10-K Feb 17, 2026 at sec.gov
RewordedMD&A
Table 1 (Continued) 21 - Non-GAAP Performance Measures Reconciliation Selected Financial Information For the Years Ended December 31, (dollars in thousands, except per share data) 2025 2024 2023 2022 Return on assets reconciliation Return on assets (GAAP) 1.17% 0.90% 0.68% 1.13% Loss on sale of manufactured housing loans — 0.08 — — Bond portfolio restructuring loss — — 0.15 — Gain on lease termination — (0.01) — — Loss on FinTrust (goodwill impairment) sale of FinTrust, including goodwill impairment — 0.02 — — FDIC special assessment — 0.01 0.03 — Merger-related and other charges 0.03 0.02 0.08 0.06 Return on assets - operating 1.20% 1.02% 0.94% 1.19% Efficiency ratio reconciliation Efficiency ratio (GAAP) 55.46% 60.24% 60.09% 52.31% Loss on sale of manufactured housing loans — (1.63) — — Gain on lease termination — 0.15 — — Loss on FinTrust (goodwill impairment) sale of FinTrust, including goodwill impairment — (0.53) — — FDIC special assessment — (0.18) (1.05) — Merger-related and other charges (0.95) (0.90) (2.87) (2.15) Efficiency ratio - operating 54.51% 57.15% 56.17% 50.16% Tangible common equity to tangible assets reconciliation Equity to total assets (GAAP) 12.99% 12.38% 11.95% 11.25% Effect of goodwill and other intangibles (3.07) (3.09) (3.27) (2.97) Effect of preferred equity — (0.32) (0.32) (0.40) Tangible common equity to tangible assets 9.92% 8.97% 8.36% 7.88%
Read it in 10-K Feb 17, 2026 at sec.gov
RewordedMD&A
RewordedMD&A
RewordedMD&A
As of December 31, 2024, 2025, the average credit exposure of our 25 largest credit relationships consisted of loans and loan commitments ranging from $38.3 million to $79.2 was $51.5 million, with an aggregate total credit exposure of $1.19 $1.29 billion, including $282 million in unfunded commitments and $904 million $1.01 billion in balances outstanding, excluding participations sold.
Read it in 10-K Feb 17, 2026 at sec.gov
RewordedMD&A
The increase decrease in mortgage loan gains and related fees was primarily a result of an increase in mortgage loan gains of $6.42 million and an increase a decrease in mortgage servicing income, income of $2.39 million, which includes fair value adjustments to our mortgage servicing asset, of $2.52 million. asset.
Read it in 10-K Feb 17, 2026 at sec.gov
RewordedMD&A
RewordedMD&A
Operating performance measures include “noninterest income - operating”, “noninterest expenses expense - operating”, “net income – operating,” “diluted income per common share – operating,” “return on common equity – operating,” “return on tangible common equity – operating,”, “tangible book value per common share”, operating,” “return on assets – operating”, operating,” and “efficiency ratio – operating” and “tangible common equity to tangible assets. operating.
Read it in 10-K Feb 17, 2026 at sec.gov
RewordedMD&A
RewordedMD&A
Our ACL for unfunded commitments decreased totaled $15.1 million at December 31, 2025 compared to $10.4 million at December 31, 2024, mostly due to a decrease an increase in our construction commitments.
Read it in 10-K Feb 17, 2026 at sec.gov
RewordedMD&A
RewordedMD&A
Sources
The two latest 10-Ks on EDGAR, section by section. Each change links to the text at sec.gov.
Also
New risk factors: paragraphs with nothing like them last year, quoted in full.
Work with it
Excel workbook · CSV. Google Sheet that stays up to date: paste =IMPORTDATA("https://tickdelta.com/company/UCB/export.csv") into a cell.