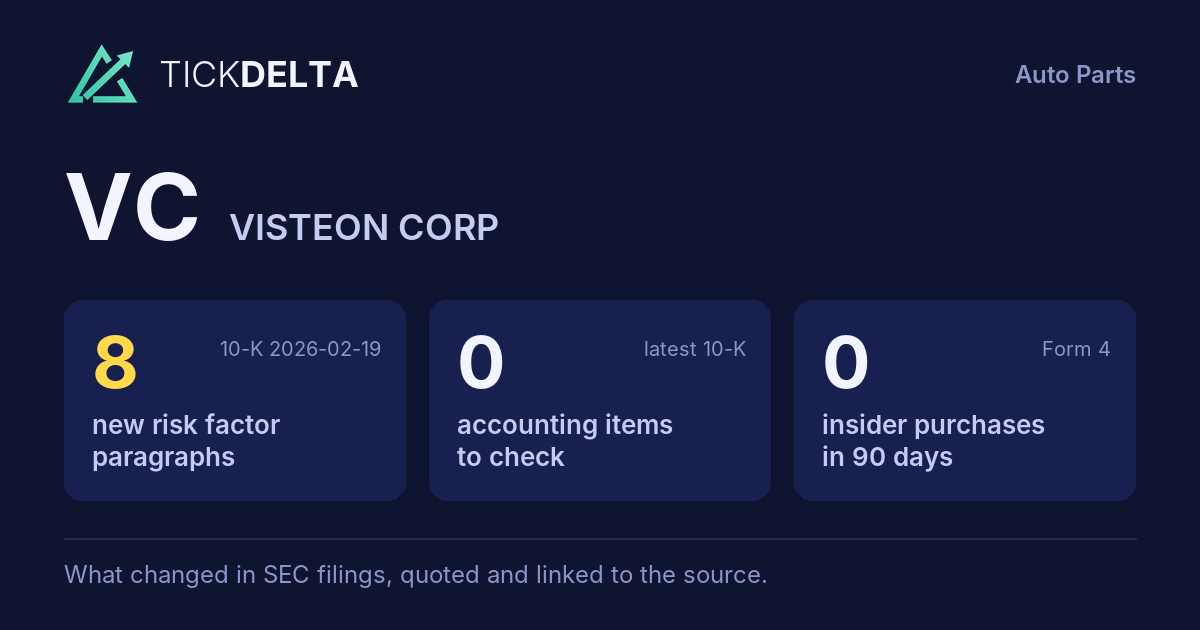
Paragraph 63 · 45% changed
Every version of it
Screener
/
SEC EDGAR
/CIK 0001111335
/10-K filed Feb 19, 2026, compared with Feb 18, 2025
/Numbers from the XBRL of the 10-Ks
Nasdaq
Consumer discretionary · Auto Parts
Visteon Corp VC
The 10-K against last year's
103 changes: 39 added, 14 removed, 50 reworded
10-K Feb 19, 2026 vs Feb 18, 2025
Risk Factors
21.2%
of the text changed · 5,516 words now · 8 new paragraphs, 1 gone
MD&A
38.2%
of the text changed · 8,620 words now · 31 new paragraphs, 13 gone
Legal Proceedings
0.6%
of the text changed · 794 words now
Accounting Policies
22.4%
of the text changed · 3,986 words now
10-K 0001111335-26-000006 (Feb 19, 2026) vs 10-K 0001111335-25-000006 (Feb 18, 2025)
Every paragraph, and how much of it changed
One bar per paragraph, in the order of the 10-K. Height and colour show the share of its words not in the closest paragraph a year earlier; the tallest bars are new paragraphs.
Risk Factors
68 paragraphs · 8 new · 24 reworded · 1 gone · 10-K Feb 19, 2026 against Feb 18, 2025
New paragraph
Reworded (5% of its words or more)
Same or nearly
Paragraph 15 · 43% changed
Every version of it
Existing free trade laws and regulations, such as the United States-Mexico-Canada Agreement, Agreement ("USMCA"), provide certain beneficial duties and tariffs for qualifying imports and exports, subject to compliance with the applicable classification and other requirements. Changes in laws or policies governing the terms of trade, and in particular increased trade restrictions, tariffs or taxes on imports from countries where the Company manufactures products, such as Mexico and China, could have a material adverse effect on its business and financial results. For example, The USMCA will be renegotiated in February 2025, 2026 and the U.S. government imposed or threatened to impose new tariffs on imported products from Mexico, Canada and China and reciprocal tariffs globally. The impact of these tariffs is subject to Company could be adversely impacted if there were a number of factors, including the effective date and duration of such tariffs, changes material reduction in the amount, scope and nature of benefits the tariffs in USMCA affords to the future, any retaliatory responses to such actions that Company. In addition the target countries may take and any mitigating actions that may become available. Despite recent trade negotiations between the U.S. and the Mexican, Canadian and Chinese governments, given the uncertainty regarding the scope and duration of any new tariffs, as well as the potential for additional tariffs or trade barriers by the U.S., Mexico, Canada, China or other countries, the Company can provide no assurance that any strategies it implements to mitigate the impact of such tariffs or other trade actions will be successful. Management continues to monitor the volatile geopolitical environment to identify, quantify and assess proposed or threatened duties, taxes or other business restrictions which could adversely affect our business and financial results.
Paragraph 44 · 43% changed
Every version of it
Paragraph 4 · 38% changed
Every version of it
Paragraph 3 · 31% changed
Every version of it
In an effort to manage and reduce the costs of purchased goods and services, the Company, like many automotive suppliers and automakers, has been consolidating its supply base. As a result, the Company is dependent on single or limited sources of supply for certain components used in the manufacture of its products including semiconductor chips, which are integral components of new vehicles and are embedded in multiple vehicle systems, including cockpit electronics. As a result of the semiconductor shortages in recent years, years including the developing DRAM shortages, the Company continues to work closely with its suppliers and customers to minimize any potential adverse impacts of the semiconductor and DRAM supply shortage and monitor the availability of semiconductor microchips and other component parts and raw materials, customer vehicle production schedules, and any other supply chain inefficiencies that may arise, due to this or any other issue. If shortages of semiconductors or other critical components from other suppliers develop, continue longer than anticipated, or worsen, it could impact the Company's ability to meet its production schedules for some of its key products or to ship such products to its customers in a timely fashion. Furthermore, unfavorable economic or industry conditions could result in financial distress within the Company's supply base, thereby increasing the risk of supply disruption.
Paragraph 16 · 27% changed
Every version of it
Paragraph 67 · 27% changed
Every version of it
Paragraph 14 · 26% changed
Every version of it
Additionally, the Company’s global operations may also be adversely affected by political events, domestic or international terrorist events, and hostilities or complications due to natural or other disasters. These or any further political or governmental developments or health concerns in Mexico, China, or other countries in which the Company operates or where its suppliers are located could result in social, economic, and labor instability. These uncertainties including difficulties in mapping full supply chains could have a material adverse effect on the continuity of the Company’s business, results of operations, and financial condition.
Paragraph 63 · 45% changed
Every version of it
10-K Feb 18, 2025The Company relies on the accuracy, capacity, and security of its infrastructure and information technology systems to conduct its business. The Company's systems have in the past and could in the future be breached, damaged, taken over, or otherwise interrupted by a system failure, cyberattack, malicious computer software (including malware or ransomware), unauthorized physical or electronic access, or other natural or man-made incidents or disasters. For example, on July 3, 2023, the Company experienced a disruption of certain IT services and assets at its third-party data center provider that resulted in some IT services experiencing interruptions and loss of data and on December 15, 2024 several servers at a single plant in China were encrypted but the Company’s response plans including back-up restoration negated any material impact to the Company. These types of events have occurred with more frequency within our industry and are expected to continue (and possibly increase) moving forward. Any of these events could result in, amongst other things, the following to the Company or its customers, suppliers, sub-suppliers, or other contract parties: (i) a business disruption, including plant operations, (ii) theft of intellectual property, including trade secrets, or (iii) unauthorized access to personal information, including employee or end consumer personal information. Although the Company has placed a high priority on cybersecurity and continues to enhance (through investments) our controls, processes and practices designed to protect our operational systems and products from a breach, the Company’s actions may not be quick enough to fully protect our operational systems and products against all vulnerabilities, including technologies developed to bypass our security measures. In addition, the company’s employees or customers may accidentally provide their access credentials or other sensitive information to bad actors who could gain access to our secure systems and networks. Nothing ensures that the Company’s actions or investments to improve its systems, products, processes and risk management framework or remediate vulnerabilities will be sufficient or deployed quickly enough to prevent or limit the impact of any breach. Undetected or unrecognized breaches also create a risk to the Company since it takes time to first discover the breach and then patch the vulnerability. The Company also cannot anticipate all the various methods of attacks and have defenses prepared in advance against these types of attacks, and it cannot predict the extent, frequency or impact these attacks may have. To the extent a breach occurs as noted above, or data is lost, destroyed, or inappropriately used or disclosed, such disruptions could lead to legal claims against the Company and adversely affect the Company’s competitive position, reputation, relationships with customers, financial condition, operating results, and cash flows and/or subject us to regulatory actions, including those contemplated by data privacy laws and regulations. Moreover, the Company may be required to incur significant costs to protect against the damage caused by these disruptions or security breaches in the future. The Company is also dependent on the security measures implemented by our customers, suppliers, and other third-party service providers to protect their own systems, infrastructures, and products. A breach that impacts any of these third-parties' systems could result in unauthorized access to the Company’s or its customers' or suppliers' sensitive data or the Company’s own information technology systems. It could also cause the Company to be non-compliant with applicable laws, subject us to legal claims, disrupt our operations, damage our reputation, or cause a loss of confidence in our products or services, any of which could adversely affect our financial condition, operating results, or cash flow. In addition, if the content, analyses, or recommendations that A.I. programs assist in producing are or are alleged to be deficient, inaccurate, or biased, then the Company’s business, financial condition, and results of operations and our reputation may be adversely affected.
10-K Feb 19, 2026
reputation, relationships with customers, financial condition, operating results, and cash flows and/or subject us to regulatory actions, including those contemplated by data privacy laws and regulations. Moreover, the Company may be required to incur significant costs to protect against the damage caused by these disruptions or security breaches in the future. The Company is also dependent on the security measures implemented by our customers, suppliers, and other third-party service providers to protect their own systems, infrastructures, and products. A breach that impacts any of these third-parties' systems could result in unauthorized access to the Company’s or its customers' or suppliers' sensitive data or the Company’s own information technology systems. It could also cause the Company to be non-compliant with applicable laws, subject us to legal claims, disrupt our operations, damage our reputation, or cause a loss of confidence in our products or services, any of which could adversely affect our financial condition, operating results, or cash flow. In addition, if the content, analyses, or recommendations that A.I. programs assist in producing are or are alleged to be deficient, inaccurate, or biased, then the Company’s business, financial condition, and results of operations and our reputation may be adversely affected.
Paragraph 15 · 43% changed
Every version of it
10-K Feb 18, 2025
Existing free trade laws and regulations, such as the United States-Mexico-Canada Agreement, provide certain beneficial duties and tariffs for qualifying imports and exports, subject to compliance with the applicable classification and other requirements. Changes in laws or policies governing the terms of trade, and in particular increased trade restrictions, tariffs or taxes on imports from countries where the Company manufactures products, such as Mexico and China, could have a material adverse effect on its business and financial results. For example, in February 2025, the U.S. government imposed or threatened to impose new tariffs on imported products from Mexico, Canada and China and reciprocal tariffs globally. The impact of these tariffs is subject to a number of factors, including the effective date and duration of such tariffs, changes in the amount, scope and nature of the tariffs in the future, any retaliatory responses to such actions that the target countries may take and any mitigating actions that may become available. Despite recent trade negotiations between the U.S. and the Mexican, Canadian and Chinese governments, given the uncertainty regarding the scope and duration of any new tariffs, as well as the potential for additional tariffs or trade barriers by the U.S., Mexico, Canada, China or other countries, the Company can provide no assurance that any strategies it implements to mitigate the impact of such tariffs or other trade actions will be successful. Management continues to monitor the volatile geopolitical environment to identify, quantify and assess proposed or threatened duties, taxes or other business restrictions which could adversely affect our business and financial results.
10-K Feb 19, 2026
Existing free trade laws and regulations, such as the United States-Mexico-Canada Agreement ("USMCA"), provide certain beneficial duties and tariffs for qualifying imports and exports, subject to compliance with the applicable classification and other requirements. Changes in laws or policies governing the terms of trade, and in particular increased trade restrictions, tariffs or taxes on imports from countries where the Company manufactures products, such as Mexico and China, could have a material adverse effect on its business and financial results. The USMCA will be renegotiated in 2026 and the Company could be adversely impacted if there were a material reduction in the benefits the USMCA affords to the Company. In addition the
Paragraph 44 · 43% changed
Every version of it
10-K Feb 18, 2025Developments or assertions by or against the Company relating to intellectual property rights could materially impact its business
10-K Feb 19, 2026
by or against the Company relating to intellectual property rights could have materially adverse effects on the Company’s business, operating results, financial condition, and cash flow.
Paragraph 4 · 38% changed
Every version of it
10-K Feb 18, 2025In an effort to manage and reduce the costs of purchased goods and services, the Company, like many automotive suppliers and automakers, has been consolidating its supply base. As a result, the Company is dependent on single or limited sources of supply for certain components used in the manufacture of its products including semiconductor chips, which are integral components of new vehicles and are embedded in multiple vehicle systems, including cockpit electronics. As a result of the semiconductor shortages in recent years, the Company continues to work closely with its suppliers and customers to minimize any potential adverse impacts of the semiconductor supply shortage and monitor the availability of semiconductor microchips and other component parts and raw materials, customer vehicle production schedules, and any other supply chain inefficiencies that may arise, due to this or any other issue. If shortages of semiconductors or other critical components from other suppliers develop, continue longer than anticipated, or worsen, it could impact the Company's ability to meet its production schedules for some of its key products or to ship such products to its customers in a timely fashion. Furthermore, unfavorable economic or industry conditions could result in financial distress within the Company's supply base, thereby increasing the risk of supply disruption.
10-K Feb 19, 2026
and monitor the availability of semiconductor microchips and other component parts and raw materials, customer vehicle production schedules, and any other supply chain inefficiencies that may arise, due to this or any other issue. If shortages of semiconductors (including DRAM) or other critical components from other suppliers develop, continue longer than anticipated, or worsen, it could impact the Company's ability to meet its production schedules for some of its key products or to ship such products to its customers in a timely fashion. Shortages of critical components, including semiconductors and DRAM, also result in increased prices and price volatility for such components and while the Company seeks to recover these increased costs from its customers failure to secure full reimbursement could negatively impact the Company’s financial performance.
Paragraph 3 · 31% changed
Every version of it
10-K Feb 18, 2025
In an effort to manage and reduce the costs of purchased goods and services, the Company, like many automotive suppliers and automakers, has been consolidating its supply base. As a result, the Company is dependent on single or limited sources of supply for certain components used in the manufacture of its products including semiconductor chips, which are integral components of new vehicles and are embedded in multiple vehicle systems, including cockpit electronics. As a result of the semiconductor shortages in recent years, the Company continues to work closely with its suppliers and customers to minimize any potential adverse impacts of the semiconductor supply shortage and monitor the availability of semiconductor microchips and other component parts and raw materials, customer vehicle production schedules, and any other supply chain inefficiencies that may arise, due to this or any other issue. If shortages of semiconductors or other critical components from other suppliers develop, continue longer than anticipated, or worsen, it could impact the Company's ability to meet its production schedules for some of its key products or to ship such products to its customers in a timely fashion. Furthermore, unfavorable economic or industry conditions could result in financial distress within the Company's supply base, thereby increasing the risk of supply disruption.
10-K Feb 19, 2026
In an effort to manage and reduce the costs of purchased goods and services, the Company, like many automotive suppliers and automakers, has been consolidating its supply base. As a result, the Company is dependent on single or limited sources of supply for certain components used in the manufacture of its products including semiconductor chips, which are integral components of new vehicles and are embedded in multiple vehicle systems, including cockpit electronics. As a result of the semiconductor shortages in recent years including the developing DRAM shortages, the Company continues to work closely with its suppliers and customers to minimize any potential adverse impacts of the semiconductor and DRAM supply shortages
Paragraph 16 · 27% changed
Every version of it
10-K Feb 18, 2025Existing free trade laws and regulations, such as the United States-Mexico-Canada Agreement, provide certain beneficial duties and tariffs for qualifying imports and exports, subject to compliance with the applicable classification and other requirements. Changes in laws or policies governing the terms of trade, and in particular increased trade restrictions, tariffs or taxes on imports from countries where the Company manufactures products, such as Mexico and China, could have a material adverse effect on its business and financial results. For example, in February 2025, the U.S. government imposed or threatened to impose new tariffs on imported products from Mexico, Canada and China and reciprocal tariffs globally. The impact of these tariffs is subject to a number of factors, including the effective date and duration of such tariffs, changes in the amount, scope and nature of the tariffs in the future, any retaliatory responses to such actions that the target countries may take and any mitigating actions that may become available. Despite recent trade negotiations between the U.S. and the Mexican, Canadian and Chinese governments, given the uncertainty regarding the scope and duration of any new tariffs, as well as the potential for additional tariffs or trade barriers by the U.S., Mexico, Canada, China or other countries, the Company can provide no assurance that any strategies it implements to mitigate the impact of such tariffs or other trade actions will be successful. Management continues to monitor the volatile geopolitical environment to identify, quantify and assess proposed or threatened duties, taxes or other business restrictions which could adversely affect our business and financial results.
10-K Feb 19, 2026
U.S. government increasingly imposes or threatens to impose new tariffs on imported products from Mexico, Canada, the European Union and China and reciprocal tariffs globally. The impact of these tariffs is subject to a number of factors, including the effective date and duration of such tariffs, changes in the amount, scope and nature of the tariffs in the future, any retaliatory responses to such actions that the target countries may take and any mitigating actions that may become available. The Company can provide no assurance that any strategies it implements to mitigate the impact of such tariffs or other trade actions will be successful. Management continues to monitor the volatile geopolitical environment to identify, quantify and assess proposed or threatened duties, taxes or other business restrictions which could adversely affect our business and financial results.
Paragraph 67 · 27% changed
Every version of it
10-K Feb 18, 2025Increased attention to climate change and its association with greenhouse gas emissions, expectations for companies to establish short and long-term emissions reduction targets, and changes in consumer preferences may result in increased costs, reduced profits, risks associated with new regulatory requirements, and the potential for increased litigation and governmental investigations. The U.S. federal government, certain U.S. states, and certain other countries and regions have adopted or are considering legislation or regulation imposing overall caps or taxes on greenhouse gas emissions from certain sectors including automotive. Failure to comply with any legislation or regulation could result in substantial fines, criminal sanctions, or operational changes. Moreover, even without such legislation or regulation, increased awareness of, or any adverse publicity regarding, the effects of greenhouse gases could harm the Company’s reputation or reduce customer demand for its products and services. Automakers have also started implementing climate-related initiatives and objectives each year with their suppliers, and such actions are expected to continue in the future. If the Company is unable to meet these new requirements in the future through improved operating efficiencies, new manufacturing processes, sourcing alternatives, and other sustainability initiatives, the Company’s business could be adversely affected.
10-K Feb 19, 2026
Climate‑related regulation, disclosure requirements, and stakeholder expectations in the United States and globally continue to evolve and may increase the Company’s costs, compliance obligations, and operational risks. Governments at the federal, state, and international levels have adopted, or are considering, laws and regulations addressing greenhouse gas emissions, climate‑related disclosures, energy use, and supply‑chain transparency. Failure to comply with any legislation or regulation could result in substantial fines, criminal sanctions, or operational changes. Moreover, even without such legislation or regulation, increased awareness of, or any adverse publicity regarding, the effects of greenhouse gases could harm the Company’s reputation or reduce customer demand for its products and services. Automakers have also started implementing climate-related initiatives and objectives each year with their suppliers, and such actions are expected to continue in the future. If the Company is unable to meet these new requirements in the future through improved operating efficiencies, new manufacturing processes, sourcing alternatives, and other sustainability initiatives, the Company’s business could be adversely affected.
Paragraph 14 · 26% changed
Every version of it
10-K Feb 18, 2025
Additionally, the Company’s global operations may also be adversely affected by political events, domestic or international terrorist events, and hostilities or complications due to natural or other disasters. These or any further political or governmental developments or health concerns in Mexico, China, or other countries in which the Company operates or where its suppliers are
10-K Feb 19, 2026
Additionally, the Company’s global operations may also be adversely affected by political events, domestic or international terrorist events, and hostilities or complications due to natural or other disasters. These or any further political or governmental developments in Mexico, China, or other countries in which the Company operates or where its suppliers are located could result in social, economic, and labor instability. These uncertainties including difficulties in mapping full supply chains could have a material adverse effect on the continuity of the Company’s business, results of operations, and financial condition.
MD&A
129 paragraphs · 31 new · 54 reworded · 13 gone · 10-K Feb 19, 2026 against Feb 18, 2025
New paragraph
Reworded (5% of its words or more)
Same or nearly
Paragraph 43 · 50% changed
Paragraph 33 · 49% changed
The Company's Company recorded an income tax provision for income taxes was $14 of $125 million for the year ended December 31, 2024, reflecting a $262 million increase 2025, compared to a $8 million income tax benefit in 2024. The year‑over‑year change of $133 million was driven primarily by changes in the $248 million benefit from income taxes in 2023. In the fourth quarter of 2023, the Company released $313 million from its deferred tax Company’s valuation allowance related to U.S. federal and certain state deferred tax assets. In 2024, the Company determined that additional U.S. deferred income tax assets were more likely than not to be realized resulting in a $49 million non-cash tax benefit. assessments.
Paragraph 35 · 46% changed
In 2024, the Company determined that additional U.S. deferred income tax assets in the U.S. and Germany were more likely than not to be realized realized, resulting in a $49 non‑cash tax benefits of $71 million non-cash and $7 million, respectively. The net year‑over‑year change in valuation allowance adjustments contributed $113 million to the increase in income tax benefit to Net income expense. The remaining $20 million increase is primarily attributable to Visteon Corporation or $1.76 per diluted share. 2023 includes a non-cash tax benefit to Net income attributable to Visteon Corporation of $313 million, or $11.10 per diluted share the overall increase in pretax income, including changes in the fourth quarter, mix of earnings and $10.98 per diluted share for the full year, related to a reduction in the valuation allowance against the U.S. deferred differing tax assets. rates between jurisdictions, withholding taxes, and uncertain tax positions.
Paragraph 26 · 44% changed
The Company recorded $32 $8 million and $5 $32 million of net restructuring expense for the years ended December 31, 2025 and 2024, respectively. These expenses are primarily related to employee severance. The decrease is primarily related to the non-recurrence of the third quarter 2024 and 2023, respectively. The increase is due to a 2024 global restructuring plan announced in September 2024 aimed at improving efficiency and further rationalize the Company’s footprint. program.
Paragraph 77 · 43% changed
The Company accrues for warranty obligations for products sold based on management estimates, with support from the Company’s sales, engineering, quality, and legal functions, of the amount that eventually will be required to settle such obligations. This accrual is based on These estimates consider several factors including contractual arrangements, past experience, current claims, production changes, industry developments, dealership repair practices, repair time and various other considerations. The Company accrues for product recall claims related to relevant information available at the time the estimate is made. Management applies a consistent estimation approach that reflects the most supportable amount within the range of potential financial participation in customer actions to provide remedies as a result of actual or threatened regulatory or court actions or the Company’s determination of the potential for such actions. The Company's accrual for recall claims is outcomes based on specific facts and circumstances underlying individual claims with support from the Company’s engineering, quality, and legal functions. Amounts accrued are based upon management’s best estimate of the amount that will ultimately be required to settle such claims. See Note 19, "Commitments and Contingencies" in the Company's consolidated financial statements included in Item 8 of this Annual Report on Form 10-K for additional information. information evaluated.
Paragraph 19 · 34% changed
Year Ended December 31, (In millions) 2025 2024 2023 Change Net sales $ 3,768 $ 3,866 $ 3,954 $ (88) (98) Cost of sales (3,236) (3,335) (3,467) 132 99 Gross margin 532 531 487 44 1 Selling, general and administrative expenses (202) (207) (207) — Restructuring and impairment 5 Restructuring, net (8) (32) (5) (27) 24 Interest income (expense), net 9 2 (7) 9 7 Equity in net (loss) income of non-consolidated affiliates 8 (3) (10) 7 11 Other income (expense), net (1) 7 (1) 8 (8) Income (loss) before income taxes 338 298 257 41 40 Benefit from (provision for) income taxes (14) 248 (262) taxes2 (125) 8 (133) Net income (loss) 284 505 (221) (loss)2 213 306 (93) Less: Net (income) loss attributable to non-controlling interests (12) (10) (19) 9 (2) Net income (loss) attributable to Visteon Corporation Corporation2 $ 274 201 $ 486 296 $ (212) (95) Adjusted EBITDA EBITDA1 $ 492 $ 474 $ 434 $ 40 18 1Adjusted EBITDA is a Non-GAAP financial measure, as defined below. 2Amounts shown reflect the change in accounting principle related to the method for assessing the realizability of U.S. deferred tax assets described in Note 1. "Summary of Significant Accounting Policies" within Part II, Item 8, “Financial Statements and Supplementary Data.”
Paragraph 45 · 33% changed
Year Ended December 31, (In millions) 2024 2023 Change Net sales $ 3,866 $ 3,954 $ (88) Cost of sales (3,335) (3,467) 132 Gross margin 531 487 44 Selling, general and administrative expenses (207) (207) — Restructuring and impairment Restructuring, net (32) (5) (27) Interest income (expense), net 2 (7) 9 Equity in net (loss) income of non-consolidated affiliates (3) (10) 7 Other income (expense), net 7 (1) 8 Income (loss) before income taxes 298 257 41 Benefit from (provision for) income taxes (14) 248 (262) taxes2 8 330 (322) Net income (loss) 284 505 (221) (loss)2 306 587 (281) Less: Net (income) loss attributable to non-controlling interests (10) (19) 9 Net income (loss) attributable to Visteon Corporation Corporation2 $ 274 296 $ 486 568 $ (212) (272) Adjusted EBITDA EBITDA1 $ 474 $ 434 $ 40 1Adjusted EBITDA is a Non-GAAP financial measure, as defined above. 2Amounts shown reflect the change in accounting principle related to the method for assessing the realizability of U.S. deferred tax assets described in Note 1, "Summary of Significant Accounting Policies" within Part II, Item 8, “Financial Statements and Supplementary Data.”
Paragraph 24 · 31% changed
Gross engineering costs relate to forward model program development and advanced engineering activities and exclude contractually reimbursable engineering costs. Gross services. Net engineering costs of $334 $364 million for the year ended December 31, 2024, where $4 2025, including the impacts of currency, were $29 million higher than the same period of 2023, and included the the acquisition of a German R&D services firm. Net engineering costs of $191 million for the year ended December 31, 2024, including the impacts of currency, were $19 million lower than the same period of 2023. This decrease 2024. The increase is primarily related due to recent engineering services acquisitions, partially offset by lower personnel cost and favorable timing of recoveries during 2024 compared to the prior period. impacts from currency.
Paragraph 43 · 50% changed
10-K Feb 18, 2025Management’s Discussion and Analysis (“MD&A”) is intended to help the reader understand the results of operations, financial condition, and cash flows of the Company. MD&A is provided as a supplement to, and should be read in conjunction with, the Company’s consolidated financial statements and related notes appearing in Item 8 of this Annual Report on Form 10-K “Financial Statements and Supplementary Data”. For discussion related to changes in financial condition and the results of operations for fiscal year 2023-related items, refer to Part II, Item 7. Management’s Discussion and Analysis of Financial Condition and Results of Operations in the Company's Annual Report on Form 10-K for fiscal year 2023, which was filed with the Securities and Exchange Commission on February 20, 2024.
10-K Feb 19, 2026
For a complete analysis of our financial condition and results of operations for fiscal year 2024, including the comparison to fiscal year 2023, refer to Part II, Item 7 of our Annual Report on Form 10‑K for the year ended December 31, 2024, filed with the Securities and Exchange Commission on February 18, 2025. The discussion presented below addresses only those sections with relevant updates resulting from the change in accounting principle.
Paragraph 33 · 49% changed
10-K Feb 18, 2025
The Company's provision for income taxes was $14 million for year ended December 31, 2024, reflecting a $262 million increase compared to the $248 million benefit from income taxes in 2023. In the fourth quarter of 2023, the Company released $313 million from its deferred tax valuation allowance related to U.S. federal and certain state deferred tax assets. In 2024, the Company determined that additional U.S. deferred income tax assets were more likely than not to be realized resulting in a $49 million non-cash tax benefit.
10-K Feb 19, 2026
The Company recorded an income tax provision of $125 million for the year ended December 31, 2025, compared to a $8 million income tax benefit in 2024. The year‑over‑year change of $133 million was driven primarily by changes in the Company’s valuation allowance assessments.
Paragraph 35 · 46% changed
10-K Feb 18, 2025
In 2024, the Company determined that additional U.S. deferred income tax assets were more likely than not to be realized resulting in a $49 million non-cash tax benefit to Net income attributable to Visteon Corporation or $1.76 per diluted share. 2023 includes a non-cash tax benefit to Net income attributable to Visteon Corporation of $313 million, or $11.10 per diluted share in the fourth quarter, and $10.98 per diluted share for the full year, related to a reduction in the valuation allowance against the U.S. deferred tax assets.
10-K Feb 19, 2026
In 2024, the Company determined that additional deferred tax assets in the U.S. and Germany were more likely than not to be realized, resulting in non‑cash tax benefits of $71 million and $7 million, respectively. The net year‑over‑year change in valuation allowance adjustments contributed $113 million to the increase in income tax expense. The remaining $20 million increase is primarily attributable to the overall increase in pretax income, including changes in the mix of earnings and differing tax rates between jurisdictions, withholding taxes, and uncertain tax positions.
Paragraph 26 · 44% changed
10-K Feb 18, 2025
The Company recorded $32 million and $5 million of net restructuring expense for the years ended December 31, 2024 and 2023, respectively. The increase is due to a 2024 global restructuring plan announced in September 2024 aimed at improving efficiency and further rationalize the Company’s footprint.
10-K Feb 19, 2026
The Company recorded $8 million and $32 million of net restructuring expense for the years ended December 31, 2025 and 2024, respectively. These expenses are primarily related to employee severance. The decrease is primarily related to the non-recurrence of the third quarter 2024 restructuring program.
Paragraph 77 · 43% changed
10-K Feb 18, 2025
The Company accrues for warranty obligations for products sold based on management estimates, with support from the Company’s sales, engineering, quality, and legal functions, of the amount that eventually will be required to settle such obligations. This accrual is based on several factors including contractual arrangements, past experience, current claims, production changes, industry developments, and various other considerations. The Company accrues for product recall claims related to potential financial participation in customer actions to provide remedies as a result of actual or threatened regulatory or court actions or the Company’s determination of the potential for such actions. The Company's accrual for recall claims is based on specific facts and circumstances underlying individual claims with support from the Company’s engineering, quality, and legal functions. Amounts accrued are based upon management’s best estimate of the amount that will ultimately be required to settle such claims. See Note 19, "Commitments and Contingencies" in the Company's consolidated financial statements included in Item 8 of this Annual Report on Form 10-K for additional information.
10-K Feb 19, 2026
The Company accrues for warranty obligations for products sold based on management estimates, with support from the Company’s sales, engineering, quality, and legal functions, of the amount that eventually will be required to settle such obligations. These estimates consider several factors including contractual arrangements, past experience, current claims, production changes, industry developments, dealership repair practices, repair time and other relevant information available at the time the estimate is made. Management applies a consistent estimation approach that reflects the most supportable amount within the range of potential outcomes based on the information evaluated.
Paragraph 19 · 34% changed
10-K Feb 18, 2025
Year Ended December 31, (In millions) 2024 2023 Change Net sales $ 3,866 $ 3,954 $ (88) Cost of sales (3,335) (3,467) 132 Gross margin 531 487 44 Selling, general and administrative expenses (207) (207) — Restructuring and impairment (32) (5) (27) Interest income (expense), net 2 (7) 9 Equity in net (loss) income of non-consolidated affiliates (3) (10) 7 Other income (expense), net 7 (1) 8 Income (loss) before income taxes 298 257 41 Benefit from (provision for) income taxes (14) 248 (262) Net income (loss) 284 505 (221) Less: Net (income) loss attributable to non-controlling interests (10) (19) 9 Net income (loss) attributable to Visteon Corporation $ 274 $ 486 $ (212) Adjusted EBITDA $ 474 $ 434 $ 40
10-K Feb 19, 2026
Year Ended December 31, (In millions) 2025 2024 Change Net sales $ 3,768 $ 3,866 $ (98) Cost of sales (3,236) (3,335) 99 Gross margin 532 531 1 Selling, general and administrative expenses (202) (207) 5 Restructuring, net (8) (32) 24 Interest income (expense), net 9 2 7 Equity in net (loss) income of non-consolidated affiliates 8 (3) 11 Other income (expense), net (1) 7 (8) Income (loss) before income taxes 338 298 40 Benefit from (provision for) income taxes2 (125) 8 (133) Net income (loss)2 213 306 (93) Less: Net (income) loss attributable to non-controlling interests (12) (10) (2) Net income (loss) attributable to Visteon Corporation2 $ 201 $ 296 $ (95) Adjusted EBITDA1 $ 492 $ 474 $ 18 1Adjusted EBITDA is a Non-GAAP financial measure, as defined below. 2Amounts shown reflect the change in accounting principle related to the method for assessing the realizability of U.S. deferred tax assets described in Note 1. "Summary of Significant Accounting Policies" within Part II, Item 8, “Financial Statements and Supplementary Data.”
Paragraph 45 · 33% changed
10-K Feb 18, 2025
Year Ended December 31, (In millions) 2024 2023 Change Net sales $ 3,866 $ 3,954 $ (88) Cost of sales (3,335) (3,467) 132 Gross margin 531 487 44 Selling, general and administrative expenses (207) (207) — Restructuring and impairment (32) (5) (27) Interest income (expense), net 2 (7) 9 Equity in net (loss) income of non-consolidated affiliates (3) (10) 7 Other income (expense), net 7 (1) 8 Income (loss) before income taxes 298 257 41 Benefit from (provision for) income taxes (14) 248 (262) Net income (loss) 284 505 (221) Less: Net (income) loss attributable to non-controlling interests (10) (19) 9 Net income (loss) attributable to Visteon Corporation $ 274 $ 486 $ (212) Adjusted EBITDA $ 474 $ 434 $ 40
10-K Feb 19, 2026
Year Ended December 31, (In millions) 2024 2023 Change Net sales $ 3,866 $ 3,954 $ (88) Cost of sales (3,335) (3,467) 132 Gross margin 531 487 44 Selling, general and administrative expenses (207) (207) — Restructuring, net (32) (5) (27) Interest income (expense), net 2 (7) 9 Equity in net (loss) income of non-consolidated affiliates (3) (10) 7 Other income (expense), net 7 (1) 8 Income (loss) before income taxes 298 257 41 Benefit from (provision for) income taxes2 8 330 (322) Net income (loss)2 306 587 (281) Less: Net (income) loss attributable to non-controlling interests (10) (19) 9 Net income (loss) attributable to Visteon Corporation2 $ 296 $ 568 $ (272) Adjusted EBITDA1 $ 474 $ 434 $ 40 1Adjusted EBITDA is a Non-GAAP financial measure, as defined above. 2Amounts shown reflect the change in accounting principle related to the method for assessing the realizability of U.S. deferred tax assets described in Note 1, "Summary of Significant Accounting Policies" within Part II, Item 8, “Financial Statements and Supplementary Data.”
Paragraph 24 · 31% changed
10-K Feb 18, 2025
Gross engineering costs relate to forward model program development and advanced engineering activities and exclude contractually reimbursable engineering costs. Gross engineering costs of $334 million for the year ended December 31, 2024, where $4 million higher than the same period of 2023, and included the the acquisition of a German R&D services firm. Net engineering costs of $191 million for the year ended December 31, 2024, including the impacts of currency, were $19 million lower than the same period of 2023. This decrease is primarily related to favorable timing of recoveries during 2024 compared to the prior period.
10-K Feb 19, 2026
Gross engineering costs relate to forward model program development and advanced engineering activities and services. Net engineering costs of $364 million for the year ended December 31, 2025, including the impacts of currency, were $29 million higher than the same period of 2024. The increase is primarily due to recent engineering services acquisitions, partially offset by lower personnel cost and favorable impacts from currency.
A paragraph is matched with the one last year that shares the most of its words; under half in common makes it new. The paragraphs shown are the 8 reworded the most in each section.
The paragraph that changed most in each section
The redline
Marked against last year's 10-K: cut words struck through, new words highlighted.
Risk Factors202 words changed in this paragraph; it is 81% similar to last year's version.
The Company relies on the accuracy, capacity, and security of its infrastructure and information technology systems to conduct its business. The Company's systems have in the past prior years and could in the future be breached, damaged, taken over, or otherwise interrupted by a system failure, cyberattack, malicious computer software (including malware or ransomware), unauthorized physical or electronic access, or other natural or man-made incidents or disasters. For example, on July 3, 2023, the Company experienced a disruption of certain IT services and assets at its third-party data center provider that resulted in some IT services experiencing interruptions and loss of data and on December 15, 2024 2024, several servers at a single plant in China were encrypted but the Company’s response plans including back-up restoration negated any material impact to the Company. These types of events have occurred with more frequency within our industry and are expected to continue (and possibly increase) moving forward. Any of these events could result in, amongst other things, the following to the Company or its customers, suppliers, sub-suppliers, or other contract parties: (i) a business disruption, including plant operations, (ii) theft of intellectual property, including trade secrets, or (iii) unauthorized access to personal information, including employee or end consumer personal information. Although the Company has placed a high priority on cybersecurity and continues to enhance (through investments) our controls, processes and practices designed to protect our operational systems and products from a breach, the Company’s actions may not be quick enough to fully protect our operational systems and products against all vulnerabilities, including technologies developed to bypass our security measures. In addition, the company’s employees or customers may accidentally provide their access credentials or other sensitive information to bad actors who could gain access to our secure systems and networks. Nothing ensures that the Company’s actions or investments to improve its systems, products, processes and risk management framework or remediate vulnerabilities will be sufficient or deployed quickly enough to prevent or limit the impact of any breach. Undetected or unrecognized breaches also create a risk to the Company since it takes time to first discover the breach and then patch the vulnerability. The Company also cannot anticipate all the various methods of attacks and have defenses prepared in advance against these types of attacks, and it cannot predict the extent, frequency or impact these attacks may have. To the extent a breach occurs as noted above, or data is lost, destroyed, or inappropriately used or disclosed, such disruptions could lead to legal claims against the Company and adversely affect the Company’s competitive position, reputation, relationships with customers, financial condition, operating results, and cash flows and/or subject us to regulatory actions, including those contemplated by data privacy laws and regulations. Moreover, the Company may be required to incur significant costs to protect against the damage caused by these disruptions or security breaches in the future. The Company is also dependent on the security measures implemented by our customers, suppliers, and other third-party service providers to protect their own systems, infrastructures, and products. A breach that impacts any of these third-parties' systems could result in unauthorized access to the Company’s or its customers' or suppliers' sensitive data or the Company’s own information technology systems. It could also cause the Company to be non-compliant with applicable laws, subject us to legal claims, disrupt our operations, damage our reputation, or cause a loss of confidence in our products or services, any of which could adversely affect our financial condition, operating results, or cash flow. In addition, if the content, analyses, or recommendations that A.I. programs assist in producing are or are alleged to be deficient, inaccurate, or biased, then the Company’s business, financial condition, and results of operations and our reputation may be adversely affected.
Source: Item 1A, 10-K 0001111335-26-000006 vs Item 1A, 10-K 0001111335-25-000006
Accounting Policies183 words changed in this paragraph; it is 34% similar to last year's version.
Goodwill: The Company performs either a qualitative or quantitative assessment of goodwill Goodwill is tested for impairment on an annual basis. annually as of October 1, or more frequently if events or changes in circumstances indicate a potential impairment. Goodwill impairment is tested annually on October 1 and when occasions warrant a review. Goodwill impairment testing is performed at the reporting unit level. The Management performs a qualitative assessment that considers several factors at the reporting unit level relevant factors, including the excess of fair value over carrying value as of the last quantitative impairment test, the length of time since the last fair value measurement, the current carrying value, overall financial performance, market and industry metrics, actual performance compared to forecast performance, conditions, and the Company's current outlook on the business. Company’s market capitalization relative to carrying value. If the qualitative this assessment indicates it is more likely than not that goodwill is impaired, the reporting unit is quantitatively tested for impairment. To quantitatively test goodwill for impairment, the unit’s fair value of is less than its carrying amount, the Company performs a quantitative impairment test. Under the quantitative test, the reporting unit unit’s fair value is determined and compared to the its carrying value. An value, and an impairment charge loss is recognized for the amount by which the reporting unit's any excess of carrying value exceeds its over fair value.
Source: Item 8, Note 1 – Summary of Significant Accounting Policies, 10-K 0001111335-26-000006 vs Item 8, Note 1 – Summary of Significant Accounting Policies, 10-K 0001111335-25-000006
MD&A149 words changed in this paragraph; it is 43% similar to last year's version.
The Company accrues for warranty obligations for products sold based on management estimates, with support from the Company’s sales, engineering, quality, and legal functions, of the amount that eventually will be required to settle such obligations. This accrual is based on These estimates consider several factors including contractual arrangements, past experience, current claims, production changes, industry developments, dealership repair practices, repair time and various other considerations. The Company accrues for product recall claims related to relevant information available at the time the estimate is made. Management applies a consistent estimation approach that reflects the most supportable amount within the range of potential financial participation in customer actions to provide remedies as a result of actual or threatened regulatory or court actions or the Company’s determination of the potential for such actions. The Company's accrual for recall claims is outcomes based on specific facts and circumstances underlying individual claims with support from the Company’s engineering, quality, and legal functions. Amounts accrued are based upon management’s best estimate of the amount that will ultimately be required to settle such claims. See Note 19, "Commitments and Contingencies" in the Company's consolidated financial statements included in Item 8 of this Annual Report on Form 10-K for additional information. information evaluated.
Source: Item 7, 10-K 0001111335-26-000006 vs Item 7, 10-K 0001111335-25-000006
Legal Proceedings9 words changed in this paragraph; it is 88% similar to last year's version.
Year Ended December 31, (In millions) 2025 2024 2023 Beginning balance $ 80 $ 71 $ 51 Provisions 47 33 32 Change in estimates 6 2 4 Currency/other 4 (4) 1 Settlements (30) (22) (17) Ending balance $ 107 $ 80 $ 71
Source: Item 3, via Note 19 – Commitments and Contingencies, 10-K 0001111335-26-000006 vs Item 3, via Note 19 – Commitments and Contingencies, 10-K 0001111335-25-000006
Sentences and paragraphs added, removed or reworded
Every change, by type
Sentences and paragraphs of VC's Risk Factors and MD&A, 10-K Feb 19, 2026 against 10-K Feb 18, 2025. Each links to the text at sec.gov.
Quiet changes are sentences kept from last year with one to four words changed, at least one of them a hedge, a modal or a qualifier (may, could, will, not, significant, material…). A year or date rolling forward is not counted.
The full word list
adverse, adversely, all, although, anticipate, anticipates, any, approximately, believe, believes, can, cannot, certain, could, expect, expects, generally, however, if, intend, intends, largely, likely, many, material, materially, may, might, most, must, never, no, not, possible, primarily, probable, should, significant, significantly, some, substantial, substantially, unlikely, will, would
AddedRisk Factors
•export and import restrictions, including restrictions of certain products or materials or increases in border tariffs;
Read it in 10-K Feb 19, 2026 at sec.gov
AddedRisk Factors
Domestic Chinese Suppliers are becoming stronger competitors outside of China and Chinese OEMs for which the Company has less product content are increasingly expanding their market share outside of China, both of which in turn may negatively impact the Company’s financial performance
Read it in 10-K Feb 19, 2026 at sec.gov
AddedRisk Factors
Domestic Chinese suppliers are increasingly seeking to supply customers outside of China and domestic Chinese OEMs such as BYD, Xiomei, and Chery are expanding their sales outside of China including in Europe, South America, and Asia. While the Company is making efforts to compete with the Chinese suppliers and to supply parts to these OEMs, its product content for the Chinese OEMs is less than with more traditional European and North American OEMs. As the domestic Chinese OEMs gain market share outside of China, the Company’s sales opportunities may be limited and financial condition and cash flow negatively impacted.
Read it in 10-K Feb 19, 2026 at sec.gov
AddedRisk Factors
We are subject to income taxes in the United States and in numerous foreign jurisdictions, and our tax expense is dependent on the application of complex tax laws and regulations in these jurisdictions. Changes in tax laws or tax rates, the interpretation or enforcement of existing tax laws, or the outcome of audits by tax authorities could adversely affect our effective tax rate, results of operations, and cash flows. Our effective tax rate may fluctuate due to a variety of factors, including changes in the geographic mix of earnings, the availability of tax credits and deductions, changes in applicable tax rates, modifications to tariff or cross‑border tax regimes, changes in accounting principles, or unfavorable resolutions of tax examinations.
Read it in 10-K Feb 19, 2026 at sec.gov
AddedRisk Factors
We also maintain deferred tax assets, the realization of which depends on future taxable income and the continued availability of underlying tax attributes. Changes in applicable tax laws or regulations, or changes in our business performance, could affect our ability to realize these deferred tax assets and could result in additional valuation allowances.
Read it in 10-K Feb 19, 2026 at sec.gov
AddedRisk Factors
In the ordinary course of business, we are subject to examination by tax authorities in multiple jurisdictions, and additional audits may be initiated or existing audits expanded. The outcomes of these examinations are uncertain and could result in increases to our tax liabilities.
Read it in 10-K Feb 19, 2026 at sec.gov
AddedRisk Factors
Recent and ongoing legislative developments may also create uncertainty in our future tax position. The enactment of the One Big Beautiful Bill Act (the “Act”) in 2025 introduced revisions affecting the utilization of foreign tax credits, requiring us to reassess the realizability of related carryforwards following our change in accounting method for assessing deferred tax assets
Read it in 10-K Feb 19, 2026 at sec.gov
AddedRisk Factors
from an incremental cash‑tax‑savings approach to the tax‑law‑ordering approach. This reassessment resulted in the recognition of an additional valuation allowance during 2025. Global tax reform initiatives, including the OECD’s implementation of a 15% global minimum tax, continue to evolve, and the timing, scope, and application of these rules to U.S.-based multinational corporations remain uncertain. As jurisdictions adopt and interpret these rules, our effective tax rate, tax liabilities, and cash tax obligations could be adversely affected. For example, the enactment of local Qualified Domestic Minimum Top‑Up Taxes (QDMTT) in Brazil and the application of its 15% minimum tax framework in 2025 led us to forego excluding certain tax incentives from the tax base to facilitate the tax‑efficient repatriation of earnings from a Brazilian affiliate, which resulted in a higher effective tax rate in that jurisdiction.
Read it in 10-K Feb 19, 2026 at sec.gov
Show the other 49
RemovedRisk Factors
RewordedRisk Factors
RewordedRisk Factors
As a result of the semiconductor shortages in recent years, years including the developing DRAM shortages, the Company continues to work closely with its suppliers and customers to minimize any potential adverse impacts of the semiconductor and DRAM supply shortage and monitor the availability of semiconductor microchips and other component parts and raw materials, customer vehicle production schedules, and any other supply chain inefficiencies that may arise, due to this or any other issue. shortages
Read it in 10-K Feb 19, 2026 at sec.gov
RewordedRisk Factors
Failure by the Company or its suppliers to obtain the right to use third-party intellectual property could preclude the Company from selling certain products, and developments or assertions by or against the Company relating to intellectual property rights, could have materially adverse effects on the Company’s business, operating results, financial condition, and cash flow.
Read it in 10-K Feb 19, 2026 at sec.gov
RewordedRisk Factors
To the extent a breach occurs as noted above, or data is lost, destroyed, or inappropriately used or disclosed, such disruptions could lead to legal claims against the Company and adversely affect the Company’s competitive position, reputation, relationships with customers, financial condition, operating results, and cash flows and/or subject us to regulatory actions, including those contemplated by data privacy laws and regulations.
Read it in 10-K Feb 19, 2026 at sec.gov
RewordedRisk Factors
RewordedRisk Factors
RewordedRisk Factors
The Company is highly dependent on Ford Motor Company and decreases in this customer’s vehicle production volumes would adversely affect the Company General Motors.
Read it in 10-K Feb 19, 2026 at sec.gov
RewordedRisk Factors
These or any further political or governmental developments or health concerns in Mexico, China, or other countries in which the Company operates or where its suppliers are located could result in social, economic, and labor instability.
Read it in 10-K Feb 19, 2026 at sec.gov
RewordedRisk Factors
RewordedRisk Factors
RewordedRisk Factors
Failure of the Company’s products or services to effectively protect against these vulnerabilities can damage its reputation and adversely affect its business, operating results. results, financial condition, and cash flow.
Read it in 10-K Feb 19, 2026 at sec.gov
RewordedRisk Factors
If actual production orders from its customers are not consistent with the projections used by the Company in calculating the amount of its awarded business, new business wins, the Company could realize substantially less revenue over the life of these projects than the projected estimate.
Read it in 10-K Feb 19, 2026 at sec.gov
AddedMD&A
Global light-vehicle production rose approximately 4% in 2025, based on January 2026 S&P Global data, while production volumes for the Company’s key customers decreased around 1%. In North America, retail demand remained resilient with U.S. seasonally adjusted retail sales above 16 million units in 2025, although electric-vehicle (“EV”) purchases softened in the fourth quarter following accelerated buying activity ahead of expiring tax credits. Industry production declined slightly, and production at the Company’s major customers declined at a slightly higher rate. In Europe, industry production decreased slightly compared to the prior year, while production at the Company’s top customers declined at a higher rate. Jaguar Land Rover (“JLR”) production was down significantly as operations were temporarily suspended during September and the company slowly ramped up production in the fourth quarter. In China, production increased by 10%, supported by continued share gains of domestic OEMs, and production at the Company’s key customers increased year over year but continued to lag the broader market due to ongoing shifts in OEM mix.
Read it in 10-K Feb 19, 2026 at sec.gov
AddedMD&A
For the full year 2026, S&P Global expects global light-vehicle production to decrease slightly compared to 2025, and production volumes for the Company’s key customers are anticipated to decline by a low-single-digit percentage. Market conditions remain mixed across regions, with retail demand in the U.S. remaining stable, though sales of EVs are expected to decline due to the recent expiration of certain tax credits. Retail demand in Europe is forecasted to increase slightly, while retail demand in China is forecasted to decline marginally due to recent changes in government incentives. In 2026, memory chip market conditions may create cost pressures and have the potential to affect industry production volumes, as memory supplier capacity is increasingly allocated to support growth in data center infrastructure. The impact of tariffs on the automotive industry remains uncertain, with the potential to increase production costs and weigh on future vehicle volumes; however, the effects have been minimal to date.
Read it in 10-K Feb 19, 2026 at sec.gov
AddedMD&A
The industry continues to face ongoing risks related to tariffs, vehicle affordability, economic uncertainty, geopolitical developments, production disruptions, and changes in customer market share. The potential impact on future periods’ financial statements, results of operations, and cash flows will depend on the evolution of tariff policies, plant production schedules, supply-chain conditions, and the pace of EV adoption.
Read it in 10-K Feb 19, 2026 at sec.gov
AddedMD&A
In 2025, Visteon continued to progress on its long-term growth strategy, making meaningful progress across product development, customer expansion, operational execution, and capital allocation, despite a challenging and uneven automotive environment.
Read it in 10-K Feb 19, 2026 at sec.gov
AddedMD&A
Sales were $3,768 million, down 3% year over year, reflecting lower customer commodity price recoveries, continued market weakness in China and lower demand for its battery management system. Despite these headwinds, Visteon continued to outperform underlying customer production trends, supported by new product launches, strong performance in displays, and disciplined commercial execution. Net income attributable to Visteon was $201 million, reflecting a decline from the prior year due largely to a higher income tax provision driven primarily by changes in the Company's valuation allowance assessments, offset in part by lower restructuring costs and higher earnings from non‑consolidated affiliates. Adjusted EBITDA1 was $492 million reflecting continued operational discipline and effective cost management despite lower reported sales.
Read it in 10-K Feb 19, 2026 at sec.gov
AddedMD&A
Strategic execution in 2025 was highlighted by strong new business momentum including next-generation cockpit technologies. During the year, Visteon secured $7.4 billion of new business awards across its product portfolio, reflecting broad-based customer demand for digital cockpits and advanced displays. Notably, the Company secured two SmartCore™ high-performance computing (“HPC”) program awards, reinforcing customer confidence in the scalability of its cockpit domain controller architecture and its ability to support increased software content and advanced in-cabin functionality. The 2025 business wins of $7.4 billion included $3.6 billion of new display wins across 17 OEM customers. The Company also launched 18 new display products and expanded beyond its core markets, securing $1.1 billion of new business in two-wheeler and commercial vehicle applications.
Read it in 10-K Feb 19, 2026 at sec.gov
AddedMD&A
Operationally, in 2025 Visteon delivered its fifth consecutive year of positive net income attributable to Visteon, by generating $201 million. While net income attributable to Visteon declined year‑over‑year driven primarily by changes in the Company's valuation allowance assessments, underlying profitability remained solid, supported by strong operational performance. Solid gross margin performance, disciplined cost actions, and continued commercial execution enabled the Company to maintain strong net income despite lower sales and industry volatility. The Company delivered its fifth consecutive year of Adjusted EBITDA1 margin expansion, reflecting strong cost performance and disciplined commercial management.
Read it in 10-K Feb 19, 2026 at sec.gov
AddedMD&A
In parallel with these commercial and operational achievements, Visteon generated strong cash flow from operations during the year, reflecting the strength of its earnings profile, disciplined working capital management, and capital efficiency. The Company also maintained a balanced approach to capital allocation, returning approximately $70 million to shareholders through share repurchases and dividends while also completing a second engineering services acquisition to further strengthen its capabilities.
Read it in 10-K Feb 19, 2026 at sec.gov
AddedMD&A
Taken together, these achievements demonstrate Visteon’s ability to execute across its strategic priorities, deliver measurable financial and operational results, and position the Company for sustained long-term growth.
Read it in 10-K Feb 19, 2026 at sec.gov
AddedMD&A
(In millions) Net Sales Cost of Sales Gross Margin December 31, 2024 $ 3,866 $ (3,335) $ 531 Volume, mix, and net new business (106) 85 (21) Customer pricing, net (141) — (141) Currency 1 — 1 Engineering costs, net — (35) (35) Cost performance, design changes, and other 148 49 197 December 31, 2025 $ 3,768 $ (3,236) $ 532
Read it in 10-K Feb 19, 2026 at sec.gov
AddedMD&A
Pension financing benefits, net decreased due to lower expected return on assets related to employee benefit plans.
Read it in 10-K Feb 19, 2026 at sec.gov
AddedMD&A
During the year ended December 31, 2025, the Company entered into an annuity contract to transfer a portion of its U.S. defined benefit pension obligations to a third‑party insurer, resulting in a settlement loss of $7 million.
Read it in 10-K Feb 19, 2026 at sec.gov
RemovedMD&A
RemovedMD&A
RemovedMD&A
RemovedMD&A
RemovedMD&A
RemovedMD&A
RemovedMD&A
RemovedMD&A
RemovedMD&A
RemovedMD&A
RemovedMD&A
RemovedMD&A
RewordedMD&A
Year Ended December 31, (In millions) 2025 2024 2023 Change Net sales $ 3,768 $ 3,866 $ 3,954 $ (88) (98) Cost of sales (3,236) (3,335) (3,467) 132 99 Gross margin 532 531 487 44 1 Selling, general and administrative expenses (202) (207) (207) — Restructuring and impairment 5 Restructuring, net (8) (32) (5) (27) 24 Interest income (expense), net 9 2 (7) 9 7 Equity in net (loss) income of non-consolidated affiliates 8 (3) (10) 7 11 Other income (expense), net (1) 7 (1) 8 (8) Income (loss) before income taxes 338 298 257 41 40 Benefit from (provision for) income taxes (14) 248 (262) taxes2 (125) 8 (133) Net income (loss) 284 505 (221) (loss)2 213 306 (93) Less:
Read it in 10-K Feb 19, 2026 at sec.gov
RewordedMD&A
RewordedMD&A
In evaluating assessing the Company's ability to realize a benefit with respect to the realizability of deferred tax assets in the jurisdiction from which they arise, each jurisdiction, the Company considers evaluates all available positive and negative evidence, including historical and projected future taxable income, the expected timing of the reversals of existing temporary differences, the expected anticipated utilization of existing tax attribute carryforwards (e.g., such as net operating losses and foreign tax credits), credits, and available tax planning strategies.
Read it in 10-K Feb 19, 2026 at sec.gov
RewordedMD&A
RewordedMD&A
During the year ended December 31, 2024, 2025, Visteon spent paid a net cash outlay of $55 $50 million on inorganic growth, growth to acquire an advanced design a user experience electronics engineering consulting and R&D services firm and a software firm. consumer research company.
Read it in 10-K Feb 19, 2026 at sec.gov
RewordedMD&A
During the year ended December 31, 2024, 2025, cash contributions to the Company's U.S and non-U.S. employee retirement defined benefit plans were approximately $26 million. $17 million related to its U.S. plans and $7 million related to its non-U.S. plans.
Read it in 10-K Feb 19, 2026 at sec.gov
RewordedMD&A
Other cost performance, design changes and other decreased increased net sales by $41 million. $148 million primarily due to one-time items and sales from the non-recurrence of certain prior period one time commercial items. recently acquired engineering services companies.
Read it in 10-K Feb 19, 2026 at sec.gov
RewordedMD&A
RewordedMD&A
The automotive mobility market is expected to grow faster than underlying vehicle production volumes as the vehicle shifts from analog to digital digital, incorporates increased connectivity through onboard computing, software and towards device cloud-enabled features, and cloud connected, electric vehicles, and vehicles with includes more advanced safety features.
Read it in 10-K Feb 19, 2026 at sec.gov
RewordedMD&A
Year Ended December 31, (In millions) 2024 2023 Change Net sales $ 3,866 $ 3,954 $ (88) Cost of sales (3,335) (3,467) 132 Gross margin 531 487 44 Selling, general and administrative expenses (207) (207) — Restructuring and impairment Restructuring, net (32) (5) (27) Interest income (expense), net 2 (7) 9 Equity in net (loss) income of non-consolidated affiliates (3) (10) 7 Other income (expense), net 7 (1) 8 Income (loss) before income taxes 298 257 41 Benefit from (provision for) income taxes (14) 248 (262) taxes2 8 330 (322) Net income (loss) 284 505 (221) (loss)2 306 587 (281) Less:
Read it in 10-K Feb 19, 2026 at sec.gov
RewordedMD&A
Net engineering costs, excluding currency, decreased increased cost of sales by $16 $35 million as a result of favorable timing of primarily driven by recently acquired engineering recoveries. services companies.
Read it in 10-K Feb 19, 2026 at sec.gov
RewordedMD&A
Year Ended December 31, (In millions) 2025 2024 2023 Pension financing benefits, net $ 11 8 $ 11 Pension settlement and curtailment (7) (4) Other gains (costs) (2) — Township settlement — (12) $ (1) $ 7 $ (1)
Read it in 10-K Feb 19, 2026 at sec.gov
Sources
The two latest 10-Ks on EDGAR, section by section. Each change links to the text at sec.gov.
Also
New risk factors: paragraphs with nothing like them last year, quoted in full.
Work with it
Excel workbook · CSV. Google Sheet that stays up to date: paste =IMPORTDATA("https://tickdelta.com/company/VC/export.csv") into a cell.