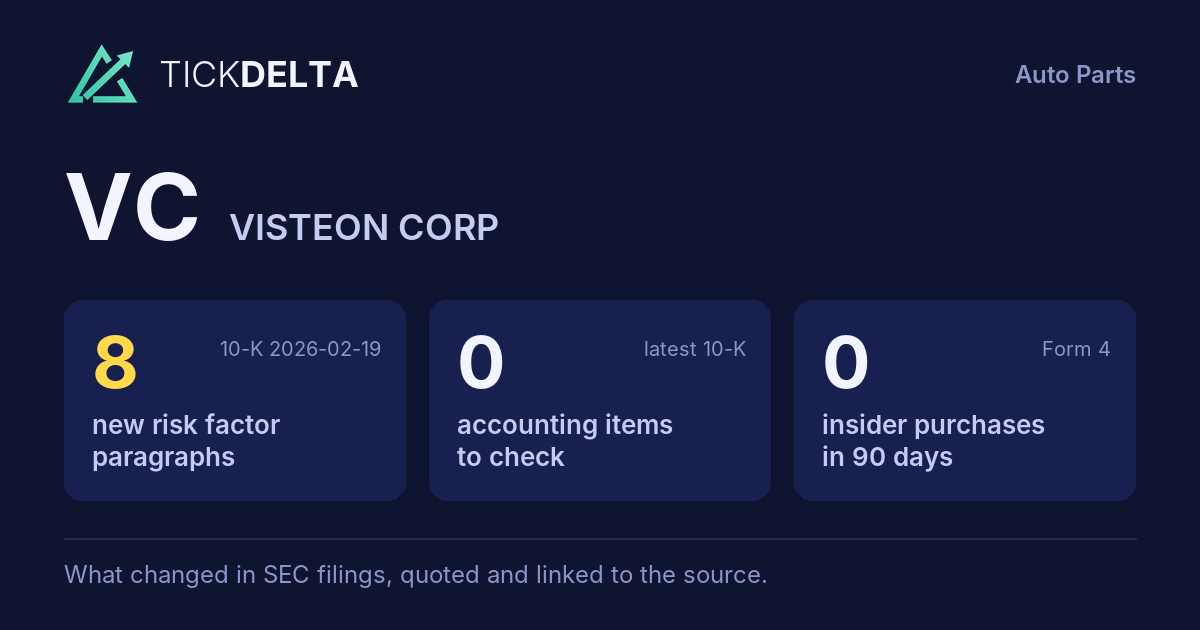
Screener / SEC EDGAR /CIK 0001111335 /10-K filed Feb 19, 2026, compared with Feb 18, 2025 /Numbers from the XBRL of the 10-Ks
Nasdaq Consumer discretionary · Auto Parts

Visteon Corp VC

Compare with peers Embed
Earnings releases

Latest results release: Oct 22, 2026

8-K item 2.02, exhibit 99

What VC's management wrote with each quarter's results: the press release and, when the company files them, its prepared remarks or the call transcript. The call itself is not filed with SEC, so most quarters have the release only.

Adjusted vs GAAP earnings per share

In the company's own words · read from each release, never computed

In its release of Oct 23, 2025, VC reported $2.04 per share under GAAP and $2.15 on its own adjusted basis: the adjusted number is +5% above GAAP.

ReleaseGAAP EPSAdjusted EPSGap
Oct 23, 2025 2.04 2.15 +5%
The company's words, latest release
Diluted earnings per share of $2.04, adjusted earnings per share of $2.15 release

What the company says its adjusted numbers leave out:

(Unaudited) Adjusted Net Income and Adjusted Earnings Per Share : Adjusted net income and adjusted earnings per share are presented as supplemental measures that management believes are useful to investors in analyzing the Company's profitability, providing comparability between periods by excluding certain items that may not be indicative of recurring business operating results. release Oct 22, 2026

Both numbers are read from the words of each release (usually the highlights), never computed by us; hover a number for its sentence. Quarters where the release gives them only in a table are not shown. The company decides what "adjusted" leaves out; the full reconciliation is in the release.

Read and search

Every release, in full · linked to sec.gov

Press release Oct 22, 2026 · EX-99.1

Visteon Announces Third Quarter 2026 Financial Results

Open on SEC

Adjusted EBITDA of $46 million, including $77 million of exceptional warranty charges

Operating cash flow of $81 million and adjusted free cash flow of $(4) million for the first nine months

Completed $200 million accelerated share repurchase program and paid $9 million quarterly dividend

Visteon reported net sales of $970 million, compared to $917 million in the prior year, an increase of 6% year-over-year. Despite customer vehicle production declining by 5%, the Company delivered 10% growth-over-market 1 , driven by strong launch execution and robust customer demand.

Net income attributable to Visteon was $5 million or $0.19 per diluted share. Gross margin in the third quarter was $47 million and includes $77 million of exceptional warranty charges. Adjusted EBITDA, a non-GAAP measure defined below, was $46 million, reflecting underlying continued operational execution in a challenging supply chain environment.

For the nine months ended September 30, 2026, cash from operations was $81 million, capital expenditures were $103 million, and adjusted free cash flow, a non-GAAP measure defined below, was an outflow of $4 million. The Company ended the quarter with cash of $466 million and debt of $330 million. The Company's strong balance sheet, with a net cash position of $136 million, provides flexibility to continue investing in the business while returning capital to shareholders.

Visteon secured $0.9 billion in new business during the third quarter, reflecting continued momentum across display products and in India, a key growth market. Highlights included two driver display awards with a luxury Japanese OEM brand for vehicles in Japan and China, a center display for multiple vehicles with a high-volume Indian OEM, a display and infotainment system for multiple vehicle models with another Indian OEM, and a center display for the commercial vehicle market in Europe with a North American OEM. The quarter also included a number of strategic awards with North American OEMs and for the Asian two- wheeler market. 1 Visteon y/y sales growth (ex. FX and net pricing) compared to production for Visteon customers weighted on Visteon sales contribution. Visteon launched 21 new products during the third quarter across 14 customers. Most notably, the Company launched the industry-first High-Performance Compute system, with integrated AI capabilities, for the Chery Freelander 8 in the Chinese market. Other highlights included a follow-on launch of our fast-growing Audi Panorama program on the Audi A2 and A3, a cockpit domain controller for the BMW i3 in Europe, a two-wheeler digital cluster for the Royal Enfield Interceptor in India, and a driver display for the all-new Lexus TZ. These launches demonstrate demand for our next-generation products while providing the foundation for future sales performance.

“Our third quarter results highlight continued progress toward sustainable sales growth while delivering strong profitability in a challenging supply chain environment,” said President and CEO Sachin Lawande. “Our HPC launch with Chery was a significant milestone for Visteon, demonstrating our ongoing position as a key supplier to support the transition to software and AI-defined vehicles.”

In the third quarter, the Company announced and completed a $200 million accelerated share repurchase ("ASR"), delivering on the Company's commitment to returning capital to shareholders while maintaining the flexibility to invest in future growth in a dynamic environment.

Based on year-to-date performance and our outlook for the fourth quarter, Visteon is raising its full-year 2026 sales guidance range to $3.80 – $3.85 billion, while lowering its full-year adjusted EBITDA range to $370 – $410 million, and its adjusted free cash flow range to $90 – $130 million. The adjusted EBITDA range reflects the impact of $77 million of exceptional warranty charges incurred in the quarter as well as cost pressures, while the adjusted free cash flow range takes into account year-to-date inventory build.

Visteon (NASDAQ: VC) is advancing mobility through innovative technology solutions that enable a software-defined future. The Company's state-of-the-art product portfolio merges digital cockpit innovations, advanced displays, AI- enhanced software solutions, and integrated EV architecture solutions. With expertise spanning passenger vehicles, commercial transportation, and two- wheelers, Visteon partners with global OEMs to create safer, cleaner, and more connected journeys. Headquartered in Van Buren Township, Michigan, Visteon operates in 17 countries, with a global network of innovation centers and manufacturing facilities. For more information, visit visteon.com.

Today, Thursday, October 22, at 9 a.m. ET, the Company will host a conference call for the investment community to discuss the quarter’s results and other related items. The conference call is available to the general public via a live audio webcast. The dial-in numbers to participate in the call are:

The conference call and live audio webcast, related presentation materials and other supplemental information will be accessible in the Investors section of Visteon’s website. __ Use of Non-GAAP Financial Information

Because not all companies use identical calculations, adjusted EBITDA, adjusted net income, adjusted EPS, free cash flow and adjusted free cash flow used throughout this press release may not be comparable to other similarly titled measures of other companies.

Forward-looking Information This press release contains "forward-looking statements" within the meaning of the Private Securities Litigation Reform Act of 1995. The words "will," "may," "designed to," "outlook," "believes," "should," "anticipates," "plans," "expects," "intends," "estimates," "forecasts" and similar expressions identify certain of these forward-looking statements. Forward-looking statements are not guarantees of future results and conditions but rather are subject to various factors, risks and uncertainties that could cause our actual results to differ materially from those expressed in these forward-looking statements, including, but not limited to:

• uncertainties in U.S. or foreign policy regarding trade agreements, tariffs or other international trade policies and any response to such actions by foreign countries;

• continued and future impacts of the geopolitical conflicts and related supply chain disruptions, including but not limited to the conflicts in the Middle East, Russia and East Asia and the possible imposition of sanctions;

• significant and prolonged shortages of, or unrecoverable price increases in, critical components, including but not limited to semiconductors such as DRAM, particularly where such components are sourced from sole or primary suppliers;

• failure of the Company’s joint venture partners to comply with contractual obligations or to exert influence or pressure in China;

• conditions within the automotive industry, including (i) the automotive vehicle production volumes and schedules of our customers, (ii) the financial condition of our customers and the effects of any restructuring or reorganization plans that may be undertaken by our customers, including work stoppages at our customers, and (iii) possible disruptions in the supply of commodities to us or our customers due to financial distress, work stoppages, natural disasters or civil unrest;

• our ability to satisfy future capital and liquidity requirements; including our ability to access the credit and capital markets at the times and in the amounts needed and on terms acceptable to us; our ability to comply with financial and other covenants in our credit agreements; and the continuation of acceptable supplier payment terms;

• our ability to access funds generated by foreign subsidiaries and joint ventures on a timely and cost-effective basis;

• our ability to grow our business with Chinese domestic OEMs and to compete with Chinese domestic suppliers as they expand their market-share outside of China;

• general economic conditions, currency exchange rates, interest rates, changes in foreign laws, regulations or trade policies, including export controls of certain parts or materials or political stability in foreign countries where Visteon procures materials, components, or supplies or where its products are manufactured, distributed, or sold;

• disruptions in information technology systems including, but not limited to, system failure, cyber-attack, malicious computer software (malware including ransomware), unauthorized physical or electronic access, or other natural or man-made incidents or disasters;

• increases in raw material and energy costs and our ability to offset or recover these costs; increases in our warranty, product liability and recall costs or the outcome of legal or regulatory proceedings to which we are or may become a party;

• changes in laws, regulations, policies or other activities of governments, agencies and similar organizations, domestic and foreign, that may tax or otherwise increase the cost of, prohibit, or otherwise affect, the manufacture, licensing, distribution, sale, ownership or use of Visteon's or its suppliers' products or assets; and

• those factors identified in our filings with the SEC (including our Annual Report on Form 10-K for the fiscal year ended December 31, 2025, as updated by our subsequent filings with the Securities and Exchange Commission). Caution should be taken not to place undue reliance on our forward-looking statements, which represent our view only as of the date of this release, and which we assume no obligation to update. The financial results presented herein are preliminary and unaudited; final financial results will be included in the Company's Quarterly Report on Form 10-Q for the fiscal quarter ended September 30, 2026. New business wins and re-wins do not represent firm orders or firm commitments from customers, but are

based on various assumptions, including the timing and duration of product launches, vehicle production levels, customer price reductions and currency exchange rates.

(Unaudited) September 30, December 31, ASSETS 2026 2025 ────────────────────────────────────────────────────────────────────────────── Cash and equivalents $ 464 $ 771 Restricted cash 2 2 Accounts receivable, net 696 613 Inventories, net 359 269 Other current assets 174 130 Total current assets 1,695 1,785 Property and equipment, net 557 524 Intangible assets, net 239 222 Right-of-use assets 124 126 Investments in non-consolidated 29 29 affiliates Deferred tax assets 519 511 Other non-current assets 238 189 Total assets $ 3,401 $ 3,386 LIABILITIES AND EQUITY Short-term debt $ 23 $ 18 Accounts payable 640 540 Accrued employee 91 122 liabilities Current lease liability 23 21 Other current liabilities 279 291 Total current liabilities 1,056 992 Long-term debt, net 307 283 Employee benefits 76 88 Non-current lease liability 106 109 Deferred tax liabilities 51 51 Other non-current 308 212 liabilities Stockholders’ equity: Common stock 1 1 Additional paid-in capital 1,409 1,398 Retained earnings 2,893 2,838 Accumulated other -248 -240 comprehensive loss Treasury stock -2,642 -2,429 Total Visteon Corporation stockholders’ 1,413 1,568 equity Non-controlling interests 84 83 Total equity 1,497 1,651 Total liabilities and $ 3,401 $ 3,386 equity

Three Nine Months Months Ended Ended September September 30, 30, OPERATING 2026 2025 2026 2025 ────────────────────────────────────────────────────────────────────────────── Net income $ 6 $ -9 $ 89 $ 135 (loss) Adjustme… to reconcile net income (loss) to net cash provided from (used by) operating activiti… Deprecia… and 31 28 89 80 amortiza… Non-cash stock-ba… 11 11 35 34 compensa… Equity in net loss (income) of non-cons… -4 -1 -8 -5 affiliat… net of dividends remitted Tax valuation allowance — 69 — 61 expense (benefit) Other non-cash 1 1 2 -3 items Changes in assets and liabilit… Accounts -33 46 -91 43 receivab… Inventor… -31 -17 -94 -13 Accounts — -34 86 6 payable Other assets 57 33 -27 -46 and other liabilit… Net cash provided from 38 127 81 292 operating activiti… INVESTING Capital expendit… -42 -22 -103 -88 including intangib… Acquisit… of business, — — -20 -50 net of cash acquired Net investme… 1 1 -11 3 hedge transact… Other — — — -1 Net cash used by -41 -21 -134 -136 investing activiti… FINANCING Borrowing — — 2 — on debt Principal repayment of term -3 -4 -7 -13 debt facility Borrowin… from revolving 179 — 179 — credit facility Repayment of revolving -153 — -153 — credit facility Other short-te… 8 — 8 — debt, net Dividend to -9 -8 -29 -8 sharehol… Dividends to — -2 -9 -20 non-cont… interests Repurcha… of common -200 — -236 -7 stock Stock-ba… compensa… tax — — -9 -7 withhold… payments Proceeds from the exercise — — 8 3 of stock options Continge… consider… -6 — -13 — payments Other — — -2 — Net cash used by -184 -14 -261 -52 financing activiti… Effect of exchange rate 3 2 7 35 changes on cash Net increase (decreas… in cash, -184 94 -307 139 equivale… and restrict… cash Cash, equivale… and restrict… cash 650 671 773 626 at beginning of the period Cash, equivale… and restrict… $ 466 $ 765 $ 466 $ 765 cash at end of the period

: Adjusted EBITDA is presented as a supplemental measure of the Company's performance that management believes is useful to investors because the excluded items may vary significantly in timing or amounts and/or may obscure trends useful in evaluating and comparing the Company's operating activities across reporting periods. The Company defines adjusted EBITDA as net income attributable to the Company adjusted to eliminate the impact of depreciation and amortization, net restructuring, provision for (benefit from) income taxes, non- cash, stock-based compensation expense, net interest (income) expense, net income (loss) attributable to non-controlling interests, equity in net (income) loss of non-consolidated affiliates, and other gains and losses not reflective of the Company's ongoing operations. Because not all companies use identical calculations, this presentation of adjusted EBITDA may not be comparable to similarly titled measures of other companies.

Adjusted EBITDA is not a recognized term under U.S. GAAP and does not purport to be a substitute for net income as an indicator of operating performance or cash flows from operating activities as a measure of liquidity. Adjusted EBITDA has limitations as an analytical tool and is not intended to be a measure of cash flow available for management's discretionary use, as it does not consider certain cash requirements such as interest payments, tax payments and debt service requirements. In addition, the Company uses adjusted EBITDA (i) as a factor in incentive compensation decisions, (ii) to evaluate the effectiveness of the Company's business strategies, and (iii) because the Company's credit agreements use similar measures for compliance with certain covenants. 2 Based on mid-point of the range of the Company's financial guidance

: Free cash flow and adjusted free cash flow are presented as supplemental measures of the Company's liquidity that management believes are useful to investors in analyzing the Company's ability to service and repay its debt. The Company defines free cash flow as cash flow provided from operating activities less capital expenditures, including intangibles. The Company defines adjusted free cash flow as cash flow provided from operating activities less capital expenditures, including intangibles as further adjusted for restructuring related payments. Because not all companies use identical calculations, this presentation of free cash flow and adjusted free cash flow may not be comparable to other similarly titled measures of other companies.

Free cash flow and adjusted free cash flow are not recognized terms under U.S. GAAP and do not purport to be a substitute for cash flows from operating activities as a measure of liquidity. Free cash flow and adjusted free cash flow have limitations as analytical tools as they do not reflect cash used to service debt and do not reflect funds available for investment or other discretionary uses. In addition, the Company uses free cash flow and adjusted free cash flow (i) as factors in incentive compensation decisions and (ii) for planning and forecasting future periods. 3 Based on mid-point of the range of the Company's financial guidance

(Unaudited) Adjusted Net Income and Adjusted Earnings Per Share : Adjusted net income and adjusted earnings per share are presented as supplemental measures that management believes are useful to investors in analyzing the Company's profitability, providing comparability between periods by excluding certain items that may not be indicative of recurring business operating results. The Company believes management and investors benefit from referring to these supplemental measures in assessing company performance and when planning, forecasting and analyzing future periods. The Company defines adjusted net income as net income attributable to Visteon adjusted to eliminate the impact of net restructuring, other gains and losses not reflective of the Company's ongoing operations and related tax effects. The Company defines adjusted earnings per share as adjusted net income divided by diluted shares. Because not all companies use identical calculations, this presentation of adjusted net income and adjusted earnings per share may not be comparable to other similarly titled measures of other companies.

Adjusted net income and adjusted earnings per share are not recognized terms under U.S. GAAP and do not purport to be a substitute for profitability. Adjusted net income and adjusted earnings per share have limitations as analytical tools as they do not consider certain restructuring and transaction- related payments and/or expenses. In addition, the Company uses adjusted net income and adjusted earnings per share for internal planning and forecasting purposes.

Full text with the tables
Exhibit 99.1
                                                                                
                                  NEWS RELEASE                                  
                                                                                
                                                                                
             Visteon Announces Third Quarter 2026 Financial Results             
                                                                                
VAN BUREN TOWNSHIP, Mich., October 22, 2026 — Visteon Corporation (NASDAQ: VC)
today reported third quarter financial results. Highlights include:
                                                                                
  •                                                                             
                                                                                
Sales of $970 million with Growth-over-Market of 10%
                                                                                
  1                                                                             
                                                                                
                                                                                
  •                                                                             
                                                                                
                                                                                
  Net income attributable to Visteon of $5 million                              
                                                                                
                                                                                
  •                                                                             
                                                                                
Adjusted EBITDA of $46 million, including $77 million of exceptional warranty
charges
                                                                                
  •                                                                             
                                                                                
Operating cash flow of $81 million and adjusted free cash flow of $(4) million
for the first nine months
                                                                                
  •                                                                             
                                                                                
Strong balance sheet with net cash of $136 million at quarter end
                                                                                
  •                                                                             
                                                                                
21 new product launches including the industry-first SmartCore (TM)
                                                                                
  High Performance Compute (HPC) system with Chery                              
                                                                                
                                                                                
  •                                                                             
                                                                                
New business wins of $0.9 billion driven by ongoing momentum in displays
                                                                                
  •                                                                             
                                                                                
Completed $200 million accelerated share repurchase program and paid $9 million
quarterly dividend
                                                                                
  Third Quarter Results                                                         
                                                                                
Visteon reported net sales of $970 million, compared to $917 million in the
prior year, an increase of 6% year-over-year. Despite customer vehicle
production declining by 5%, the Company delivered 10% growth-over-market 1 ,
driven by strong launch execution and robust customer demand.

Net income attributable to Visteon was $5 million or $0.19 per diluted share.
Gross margin in the third quarter was $47 million and includes $77 million of
exceptional warranty charges. Adjusted EBITDA, a non-GAAP measure defined below,
was $46 million, reflecting underlying continued operational execution in a
challenging supply chain environment.

For the nine months ended September 30, 2026, cash from operations was $81
million, capital expenditures were $103 million, and adjusted free cash flow, a
non-GAAP measure defined below, was an outflow of $4 million. The Company ended
the quarter with cash of $466 million and debt of $330 million. The Company's
strong balance sheet, with a net cash position of $136 million, provides
flexibility to continue investing in the business while returning capital to
shareholders.

Visteon secured $0.9 billion in new business during the third quarter,
reflecting continued momentum across display products and in India, a key growth
market. Highlights included two driver display awards with a luxury Japanese OEM
brand for vehicles in Japan and China, a center display for multiple vehicles
with a high-volume Indian OEM, a display and infotainment system for multiple
vehicle models with another Indian OEM, and a center display for the commercial
vehicle market in Europe with a North American OEM. The quarter also included a
number of strategic awards with North American OEMs and for the Asian two-
wheeler market.
1 Visteon y/y sales growth (ex. FX and net pricing) compared to production for
Visteon customers weighted on Visteon sales contribution.
Visteon launched 21 new products during the third quarter across 14 customers.
Most notably, the Company launched the industry-first High-Performance Compute
system, with integrated AI capabilities, for the Chery Freelander 8 in the
Chinese market. Other highlights included a follow-on launch of our fast-growing
Audi Panorama program on the Audi A2 and A3, a cockpit domain controller for the
BMW i3 in Europe, a two-wheeler digital cluster for the Royal Enfield
Interceptor in India, and a driver display for the all-new Lexus TZ. These
launches demonstrate demand for our next-generation products while providing the
foundation for future sales performance.

“Our third quarter results highlight continued progress toward sustainable sales
growth while delivering strong profitability in a challenging supply chain
environment,” said President and CEO Sachin Lawande. “Our HPC launch with Chery
was a significant milestone for Visteon, demonstrating our ongoing position as a
key supplier to support the transition to software and AI-defined vehicles.”
                                                                                
  Accelerated Share Repurchase Program                                          
                                                                                
In the third quarter, the Company announced and completed a $200 million
accelerated share repurchase ("ASR"), delivering on the Company's commitment to
returning capital to shareholders while maintaining the flexibility to invest in
future growth in a dynamic environment.
                                                                                
  Revised Guidance                                                              
                                                                                
Based on year-to-date performance and our outlook for the fourth quarter,
Visteon is raising its full-year 2026 sales guidance range to $3.80 – $3.85
billion, while lowering its full-year adjusted EBITDA range to $370 – $410
million, and its adjusted free cash flow range to $90 – $130 million. The
adjusted EBITDA range reflects the impact of $77 million of exceptional warranty
charges incurred in the quarter as well as cost pressures, while the adjusted
free cash flow range takes into account year-to-date inventory build.
                                                                                
  About Visteon                                                                 
                                                                                
Visteon (NASDAQ: VC) is advancing mobility through innovative technology
solutions that enable a software-defined future. The Company's state-of-the-art
product portfolio merges digital cockpit innovations, advanced displays, AI-
enhanced software solutions, and integrated EV architecture solutions. With
expertise spanning passenger vehicles, commercial transportation, and two-
wheelers, Visteon partners with global OEMs to create safer, cleaner, and more
connected journeys. Headquartered in Van Buren Township, Michigan, Visteon
operates in 17 countries, with a global network of innovation centers and
manufacturing facilities. For more information, visit visteon.com.
                                                                                
  Conference Call and Presentation                                              
                                                                                
Today, Thursday, October 22, at 9 a.m. ET, the Company will host a conference
call for the investment community to discuss the quarter’s results and other
related items. The conference call is available to the general public via a live
audio webcast.
The dial-in numbers to participate in the call are:

U.S./Canada: 1-833-461-5787

Outside U.S./Canada: 1-585-542-9983

Conference ID: 257149910

(Call approximately 10 minutes before the start of the conference.)

The conference call and live audio webcast, related presentation materials and
other supplemental information will be accessible in the Investors section of
Visteon’s website.
__
Use of Non-GAAP Financial Information

Because not all companies use identical calculations, adjusted EBITDA, adjusted
net income, adjusted EPS, free cash flow and adjusted free cash flow used
throughout this press release may not be comparable to other similarly titled
measures of other companies.

Forward-looking Information
This press release contains "forward-looking statements" within the meaning of
the Private Securities Litigation Reform Act of 1995. The words "will," "may,"
"designed to," "outlook," "believes," "should," "anticipates," "plans,"
"expects," "intends," "estimates," "forecasts" and similar expressions identify
certain of these forward-looking statements. Forward-looking statements are not
guarantees of future results and conditions but rather are subject to various
factors, risks and uncertainties that could cause our actual results to differ
materially from those expressed in these forward-looking statements, including,
but not limited to:

• uncertainties in U.S. or foreign policy regarding trade agreements, tariffs or
other international trade policies and any response to such actions by foreign
countries;

• continued and future impacts of the geopolitical conflicts and related supply
chain disruptions, including but not limited to the conflicts in the Middle
East, Russia and East Asia and the possible imposition of sanctions;

• significant and prolonged shortages of, or unrecoverable price increases in,
critical components, including but not limited to semiconductors such as DRAM,
particularly where such components are sourced from sole or primary suppliers;

• failure of the Company’s joint venture partners to comply with contractual
obligations or to exert influence or pressure in China;

• conditions within the automotive industry, including (i) the automotive
vehicle production volumes and schedules of our customers, (ii) the financial
condition of our customers and the effects of any restructuring or
reorganization plans that may be undertaken by our customers, including work
stoppages at our customers, and (iii) possible disruptions in the supply of
commodities to us or our customers due to financial distress, work stoppages,
natural disasters or civil unrest;

• our ability to satisfy future capital and liquidity requirements; including
our ability to access the credit and capital markets at the times and in the
amounts needed and on terms acceptable to us; our ability to comply with
financial and other covenants in our credit agreements; and the continuation of
acceptable supplier payment terms;

• our ability to access funds generated by foreign subsidiaries and joint
ventures on a timely and cost-effective basis;

• our ability to grow our business with Chinese domestic OEMs and to compete
with Chinese domestic suppliers as they expand their market-share outside of
China;

• general economic conditions, currency exchange rates, interest rates, changes
in foreign laws, regulations or trade policies, including export controls of
certain parts or materials or political stability in foreign countries where
Visteon procures materials, components, or supplies or where its products are
manufactured, distributed, or sold;

• disruptions in information technology systems including, but not limited to,
system failure, cyber-attack, malicious computer software (malware including
ransomware), unauthorized physical or electronic access, or other natural or
man-made incidents or disasters;

• increases in raw material and energy costs and our ability to offset or
recover these costs; increases in our warranty, product liability and recall
costs or the outcome of legal or regulatory proceedings to which we are or may
become a party;

• changes in laws, regulations, policies or other activities of governments,
agencies and similar organizations, domestic and foreign, that may tax or
otherwise increase the cost of, prohibit, or otherwise affect, the manufacture,
licensing, distribution, sale, ownership or use of Visteon's or its suppliers'
products or assets; and

• those factors identified in our filings with the SEC (including our Annual
Report on Form 10-K for the fiscal year ended December 31, 2025, as updated by
our subsequent filings with the Securities and Exchange Commission).
Caution should be taken not to place undue reliance on our forward-looking
statements, which represent our view only as of the date of this release, and
which we assume no obligation to update. The financial results presented herein
are preliminary and unaudited; final financial results will be included in the
Company's Quarterly Report on Form 10-Q for the fiscal quarter ended September
30, 2026. New business wins and re-wins do not represent firm orders or firm
commitments from customers, but are

based on various assumptions, including the timing and duration of product
launches, vehicle production levels, customer price reductions and currency
exchange rates.

Follow Visteon:

Visteon Contacts:

Media:

[email protected]

Investors:

[email protected]
                                                                                
                      VISTEON CORPORATION AND SUBSIDIARIES                      
                                                                                
             CONSOLIDATED STATEMENTS OF COMPREHENSIVE INCOME (LOSS)             
                                                                                
                     (In millions except per share amounts)                     
                                                                                
                                  (Unaudited)                                   
                                                                                
            Three                              Nine                             
            Months                             Months                           
            Ended    Septem…                   Ended    Septe…                  
            2026         30,    2025           2026        30,    2025          
 ────────────────────────────────────────────────────────────────────────────── 
  Net       $            970    $       917    $         2,884    $      2,820  
  sales                                                                         
  Cost                                                                          
  of                    -923           -786             -2,606          -2,410  
  sales                                                                         
  Gross                   47            131                278             410  
  margin                                                                        
  Selli…                                                                        
  gener…                                                                        
  and                    -46            -53               -146            -148  
  admin…                                                                        
  expen…                                                                        
  Restr…                   —             -3                -17              -4  
  net                                                                           
  Inter…                                                                        
  incom…                  -1              3                  4               6  
  net                                                                           
  Equity                                                                        
  in net                                                                        
  income                                                                        
  (loss)                   4              1                  8               5  
  of                                                                            
  non-c…                                                                        
  affil…                                                                        
  Other                                                                         
  income                   3              2                  5               4  
  (expe…                                                                        
  net                                                                           
  Income                                                                        
  (loss)                                                                        
  before                   7             81                132             273  
  income                                                                        
  taxes                                                                         
  Provi…                                                                        
  for                     -1            -90                -43            -138  
  income                                                                        
  taxes                                                                         
  Net                                                                           
  income                   6             -9                 89             135  
  (loss)                                                                        
  Less:                                                                         
  Net                                                                           
  (inco…                                                                        
  loss                    -1             -2                 -4              -8  
  attri…                                                                        
  to                                                                            
  non-c…                                                                        
  inter…                                                                        
  Net                                                                           
  income                                                                        
  (loss)                                                                        
  attri…    $              5    $       -11    $            85    $        127  
  to                                                                            
  Viste…                                                                        
  Corpo…                                                                        
  Compr…                                                                        
  income    $              6    $        -8    $            85    $        193  
  (loss)                                                                        
  Less:                                                                         
  Compr…                                                                        
  (inco…                                                                        
  loss                    -6             -3                 -8             -15  
  attri…                                                                        
  to                                                                            
  non-c…                                                                        
  inter…                                                                        
  Compr…                                                                        
  income                                                                        
  (loss)                                                                        
  attri…    $              —    $       -11    $            77    $        178  
  to                                                                            
  Viste…                                                                        
  Corpo…                                                                        
  Basic                                                                         
  earni…                                                                        
  (loss)                                                                        
  per                                                                           
  share     $           0.20    $     -0.40    $          3.24    $       4.67  
  attri…                                                                        
  to                                                                            
  Viste…                                                                        
  Corpo…                                                                        
  Dilut…                                                                        
  earni…                                                                        
  (loss)                                                                        
  per                                                                           
  share     $           0.19    $     -0.40    $          3.17    $       4.60  
  attri…                                                                        
  to                                                                            
  Viste…                                                                        
  Corpo…                                                                        
  Avera…                                                                        
  shares                                                                        
  outst…                                                                        
  (in                                                                           
  milli…                                                                        
  Basic                 25.4           27.3               26.2            27.2  
  Dilut…                26.0           27.3               26.8            27.6  
                                                                                
                                                                                
                      VISTEON CORPORATION AND SUBSIDIARIES                      
                                                                                
                                                                                
                          CONSOLIDATED BALANCE SHEETS                           
                                                                                
                                 (In millions)                                  
                                                                                
                                 (Unaudited)                                    
                                 September 30,            December 31,          
  ASSETS                         2026                     2025                  
 ────────────────────────────────────────────────────────────────────────────── 
  Cash and equivalents           $                 464    $                771  
  Restricted cash                                    2                       2  
  Accounts receivable, net                         696                     613  
  Inventories, net                                 359                     269  
  Other current assets                             174                     130  
  Total current assets                           1,695                   1,785  
  Property and equipment, net                      557                     524  
  Intangible assets, net                           239                     222  
  Right-of-use assets                              124                     126  
  Investments in                                                                
  non-consolidated                                  29                      29  
  affiliates                                                                    
  Deferred tax assets                              519                     511  
  Other non-current assets                         238                     189  
  Total assets                   $               3,401    $              3,386  
  LIABILITIES AND EQUITY                                                        
  Short-term debt                $                  23    $                 18  
  Accounts payable                                 640                     540  
  Accrued employee                                  91                     122  
  liabilities                                                                   
  Current lease liability                           23                      21  
  Other current liabilities                        279                     291  
  Total current liabilities                      1,056                     992  
  Long-term debt, net                              307                     283  
  Employee benefits                                 76                      88  
  Non-current lease liability                      106                     109  
  Deferred tax liabilities                          51                      51  
  Other non-current                                308                     212  
  liabilities                                                                   
  Stockholders’ equity:                                                         
  Common stock                                       1                       1  
  Additional paid-in capital                     1,409                   1,398  
  Retained earnings                              2,893                   2,838  
  Accumulated other                               -248                    -240  
  comprehensive loss                                                            
  Treasury stock                                -2,642                  -2,429  
  Total Visteon Corporation                                                     
  stockholders’                                  1,413                   1,568  
  equity                                                                        
  Non-controlling interests                         84                      83  
  Total equity                                   1,497                   1,651  
  Total liabilities and          $               3,401    $              3,386  
  equity                                                                        
                                                                                
                                                                                
                      VISTEON CORPORATION AND SUBSIDIARIES                      
                                                                                
                                                                                
                     CONSOLIDATED STATEMENTS OF CASH FLOWS                      
                                                                                
                                 (In millions)                                  
                                                                                
                                  (Unaudited)                                   
                                                                                
               Three                            Nine                            
               Months                           Months                          
               Ended                            Ended                           
               September                        September                       
               30,                              30,                             
  OPERATING    2026                2025         2026                2025        
 ────────────────────────────────────────────────────────────────────────────── 
  Net                                                                           
  income       $              6    $      -9    $             89    $      135  
  (loss)                                                                        
  Adjustme…                                                                     
  to                                                                            
  reconcile                                                                     
  net                                                                           
  income                                                                        
  (loss) to                                                                     
  net cash                                                                      
  provided                                                                      
  from                                                                          
  (used                                                                         
  by)                                                                           
  operating                                                                     
  activiti…                                                                     
  Deprecia…                                                                     
  and                        31           28                  89            80  
  amortiza…                                                                     
  Non-cash                                                                      
  stock-ba…                  11           11                  35            34  
  compensa…                                                                     
  Equity in                                                                     
  net loss                                                                      
  (income)                                                                      
  of                                                                            
  non-cons…                  -4           -1                  -8            -5  
  affiliat…                                                                     
  net of                                                                        
  dividends                                                                     
  remitted                                                                      
  Tax                                                                           
  valuation                                                                     
  allowance                   —           69                   —            61  
  expense                                                                       
  (benefit)                                                                     
  Other                                                                         
  non-cash                    1            1                   2            -3  
  items                                                                         
  Changes                                                                       
  in assets                                                                     
  and                                                                           
  liabilit…                                                                     
  Accounts                  -33           46                 -91            43  
  receivab…                                                                     
  Inventor…                 -31          -17                 -94           -13  
  Accounts                    —          -34                  86             6  
  payable                                                                       
  Other                                                                         
  assets                     57           33                 -27           -46  
  and other                                                                     
  liabilit…                                                                     
  Net cash                                                                      
  provided                                                                      
  from                       38          127                  81           292  
  operating                                                                     
  activiti…                                                                     
  INVESTING                                                                     
  Capital                                                                       
  expendit…                 -42          -22                -103           -88  
  including                                                                     
  intangib…                                                                     
  Acquisit…                                                                     
  of                                                                            
  business,                   —            —                 -20           -50  
  net of                                                                        
  cash                                                                          
  acquired                                                                      
  Net                                                                           
  investme…                   1            1                 -11             3  
  hedge                                                                         
  transact…                                                                     
  Other                       —            —                   —            -1  
  Net cash                                                                      
  used by                   -41          -21                -134          -136  
  investing                                                                     
  activiti…                                                                     
  FINANCING                                                                     
  Borrowing                   —            —                   2             —  
  on debt                                                                       
  Principal                                                                     
  repayment                                                                     
  of term                    -3           -4                  -7           -13  
  debt                                                                          
  facility                                                                      
  Borrowin…                                                                     
  from                                                                          
  revolving                 179            —                 179             —  
  credit                                                                        
  facility                                                                      
  Repayment                                                                     
  of                                                                            
  revolving                -153            —                -153             —  
  credit                                                                        
  facility                                                                      
  Other                                                                         
  short-te…                   8            —                   8             —  
  debt, net                                                                     
  Dividend                                                                      
  to                         -9           -8                 -29            -8  
  sharehol…                                                                     
  Dividends                                                                     
  to                          —           -2                  -9           -20  
  non-cont…                                                                     
  interests                                                                     
  Repurcha…                                                                     
  of common                -200            —                -236            -7  
  stock                                                                         
  Stock-ba…                                                                     
  compensa…                                                                     
  tax                         —            —                  -9            -7  
  withhold…                                                                     
  payments                                                                      
  Proceeds                                                                      
  from the                                                                      
  exercise                    —            —                   8             3  
  of stock                                                                      
  options                                                                       
  Continge…                                                                     
  consider…                  -6            —                 -13             —  
  payments                                                                      
  Other                       —            —                  -2             —  
  Net cash                                                                      
  used by                  -184          -14                -261           -52  
  financing                                                                     
  activiti…                                                                     
  Effect of                                                                     
  exchange                                                                      
  rate                        3            2                   7            35  
  changes                                                                       
  on cash                                                                       
  Net                                                                           
  increase                                                                      
  (decreas…                                                                     
  in cash,                 -184           94                -307           139  
  equivale…                                                                     
  and                                                                           
  restrict…                                                                     
  cash                                                                          
  Cash,                                                                         
  equivale…                                                                     
  and                                                                           
  restrict…                                                                     
  cash                      650          671                 773           626  
  at                                                                            
  beginning                                                                     
  of the                                                                        
  period                                                                        
  Cash,                                                                         
  equivale…                                                                     
  and                                                                           
  restrict…    $            466    $     765    $            466    $      765  
  cash                                                                          
  at end of                                                                     
  the                                                                           
  period                                                                        
                                                                                
                                                                                
                      VISTEON CORPORATION AND SUBSIDIARIES                      
                                                                                
                                                                                
                 RECONCILIATION OF NON-GAAP FINANCIAL MEASURES                  
                                                                                
                     (In millions except per share amounts)                     
                                                                                
                                  (Unaudited)                                   
                                                                                
  Adjusted EBITDA                                                               
                                                                                
: Adjusted EBITDA is presented as a supplemental measure of the Company's
performance that management believes is useful to investors because the excluded
items may vary significantly in timing or amounts and/or may obscure trends
useful in evaluating and comparing the Company's operating activities across
reporting periods. The Company defines adjusted EBITDA as net income
attributable to the Company adjusted to eliminate the impact of depreciation and
amortization, net restructuring, provision for (benefit from) income taxes, non-
cash, stock-based compensation expense, net interest (income) expense, net
income (loss) attributable to non-controlling interests, equity in net (income)
loss of non-consolidated affiliates, and other gains and losses not reflective
of the Company's ongoing operations. Because not all companies use identical
calculations, this presentation of adjusted EBITDA may not be comparable to
similarly titled measures of other companies.
                                                                                
         Thr…                       Nine                                        
         Mon…                       Mont…                                       
         End…  Sep…                 Ended  Sep…                 Esti…  Full     
  Vi…    2026   30,    2025         2026    30,    2025         2026   Year     
 ────────────────────────────────────────────────────────────────────────────── 
  Net                                                                           
  in…                                                                           
  (l…                                                                           
  at…    $        5    $     -11    $        85    $     127    $       140     
  to                                                                            
  Vi…                                                                           
  Co…                                                                           
  De…                                                                           
  and            31           28             89           80            120     
  am…                                                                           
  Re…             —            3             17            4             20     
  net                                                                           
  Pr…                                                                           
  for                                                                           
  (b…             1           90             43          138             65     
  fr…                                                                           
  in…                                                                           
  ta…                                                                           
  No…                                                                           
  st…            11           11             35           34             50     
  co…                                                                           
  ex…                                                                           
  In…                                                                           
  (i…             1           -3             -4           -6             -5     
  ex…                                                                           
  net                                                                           
  Net                                                                           
  in…                                                                           
  (l…                                                                           
  at…             1            2              4            8              5     
  to                                                                            
  no…                                                                           
  in…                                                                           
  Eq…                                                                           
  in                                                                            
  net                                                                           
  lo…            -4           -1             -8           -5            -10     
  (i…                                                                           
  of                                                                            
  no…                                                                           
  af…                                                                           
  Ot…             —            —              5            2              5     
  net                                                                           
  Ad…    $       46    $     119    $       266    $     382    $       390  2  
  EB…                                                                           
  *A…                                                                           
  sh…                                                                           
  re…                                                                           
  the                                                                           
  ch…                                                                           
  in                                                                            
  ac…                                                                           
  pr…                                                                           
  re…                                                                           
  to                                                                            
  the                                                                           
  me…                                                                           
  for                                                                           
  as…                                                                           
  the                                                                           
  re…                                                                           
  of                                                                            
  U.…                                                                           
  de…                                                                           
  tax                                                                           
  as…                                                                           
  de…                                                                           
  in                                                                            
  the                                                                           
  Co…                                                                           
  20…                                                                           
  Fo…                                                                           
  10…                                                                           
                                                                                
Adjusted EBITDA is not a recognized term under U.S. GAAP and does not purport to
be a substitute for net income as an indicator of operating performance or cash
flows from operating activities as a measure of liquidity. Adjusted EBITDA has
limitations as an analytical tool and is not intended to be a measure of cash
flow available for management's discretionary use, as it does not consider
certain cash requirements such as interest payments, tax payments and debt
service requirements. In addition, the Company uses adjusted EBITDA (i) as a
factor in incentive compensation decisions, (ii) to evaluate the effectiveness
of the Company's business strategies, and (iii) because the Company's credit
agreements use similar measures for compliance with certain covenants.
2 Based on mid-point of the range of the Company's financial guidance
                                                                                
                      VISTEON CORPORATION AND SUBSIDIARIES                      
                                                                                
                                                                                
                 RECONCILIATION OF NON-GAAP FINANCIAL MEASURES                  
                                                                                
                     (In millions except per share amounts)                     
                                                                                
                                  (Unaudited)                                   
                                                                                
  Free Cash Flow and Adjusted Free Cash Flow                                    
                                                                                
: Free cash flow and adjusted free cash flow are presented as supplemental
measures of the Company's liquidity that management believes are useful to
investors in analyzing the Company's ability to service and repay its debt. The
Company defines free cash flow as cash flow provided from operating activities
less capital expenditures, including intangibles. The Company defines adjusted
free cash flow as cash flow provided from operating activities less capital
expenditures, including intangibles as further adjusted for restructuring
related payments. Because not all companies use identical calculations, this
presentation of free cash flow and adjusted free cash flow may not be comparable
to other similarly titled measures of other companies.
                                                                                
         Thr…                       Nine                                        
         Mon…                       Mont…                                       
         End…  Sep…                 Ended  Sep…                 Esti…  Full     
  Vi…    2026   30,    2025         2026    30,    2025         2026   Year     
 ────────────────────────────────────────────────────────────────────────────── 
  Ca…                                                                           
  pr…                                                                           
  fr…    $       38    $     127    $        81    $     292    $       240     
  op…                                                                           
  ac…                                                                           
  Ca…                                                                           
  ex…           -42          -22           -103          -88           -150     
  in…                                                                           
  in…                                                                           
  Fr…                                                                           
  ca…    $       -4    $     105    $       -22    $     204    $        90     
  fl…                                                                           
  Re…                                                                           
  re…             3            5             18           11             20     
  pa…                                                                           
  Ad…                                                                           
  fr…    $       -1    $     110    $        -4    $     215    $       110  3  
  ca…                                                                           
  fl…                                                                           
                                                                                
Free cash flow and adjusted free cash flow are not recognized terms under U.S.
GAAP and do not purport to be a substitute for cash flows from operating
activities as a measure of liquidity. Free cash flow and adjusted free cash flow
have limitations as analytical tools as they do not reflect cash used to service
debt and do not reflect funds available for investment or other discretionary
uses. In addition, the Company uses free cash flow and adjusted free cash flow
(i) as factors in incentive compensation decisions and (ii) for planning and
forecasting future periods.
3 Based on mid-point of the range of the Company's financial guidance
                                                                                
                      VISTEON CORPORATION AND SUBSIDIARIES                      
                                                                                
                                                                                
                 RECONCILIATION OF NON-GAAP FINANCIAL MEASURES                  
                                                                                
                     (In millions except per share amounts)                     
                                                                                
                                  (Unaudited)                                   
Adjusted Net Income and Adjusted Earnings Per Share : Adjusted net income and
adjusted earnings per share are presented as supplemental measures that
management believes are useful to investors in analyzing the Company's
profitability, providing comparability between periods by excluding certain
items that may not be indicative of recurring business operating results. The
Company believes management and investors benefit from referring to these
supplemental measures in assessing company performance and when planning,
forecasting and analyzing future periods. The Company defines adjusted net
income as net income attributable to Visteon adjusted to eliminate the impact of
net restructuring, other gains and losses not reflective of the Company's
ongoing operations and related tax effects. The Company defines adjusted
earnings per share as adjusted net income divided by diluted shares. Because not
all companies use identical calculations, this presentation of adjusted net
income and adjusted earnings per share may not be comparable to other similarly
titled measures of other companies.
                                                                                
            Three                              Nine                             
            Months                             Months                           
            Ended    Septem…                   Ended    Septemb…                
            2026         30,    2025           2026          30,    2025        
 ────────────────────────────────────────────────────────────────────────────── 
  Net                                                                           
  income                                                                        
  (loss)    $              5    $       -11    $              85    $      127  
  attri…                                                                        
  to                                                                            
  Viste…                                                                        
  Dilut…                                                                        
  earni…                                                                        
  (loss)                                                                        
  per                                                                           
  share:                                                                        
  Net                                                                           
  income                                                                        
  (loss)    $              5    $       -11    $              85    $      127  
  attri…                                                                        
  to                                                                            
  Viste…                                                                        
  Avera…                                                                        
  shares                26.0           27.3                 26.8          27.6  
  outst…                                                                        
  dilut…                                                                        
  Dilut…                                                                        
  earni…                                                                        
  (loss)    $           0.19    $     -0.40    $            3.17    $     4.60  
  per                                                                           
  share                                                                         
  Adjus…                                                                        
  net                                                                           
  income                                                                        
  (loss)                                                                        
  and                                                                           
  adjus…                                                                        
  earni…                                                                        
  (loss)                                                                        
  per                                                                           
  share:                                                                        
  Net                                                                           
  income                                                                        
  (loss)    $              5    $       -11    $              85    $      127  
  attri…                                                                        
  to                                                                            
  Viste…                                                                        
  Restr…                   —              3                   17             4  
  net                                                                           
  Other                    —              —                    5             2  
  Tax                                                                           
  impac…                   —              —                   -5            -1  
  of                                                                            
  adjus…                                                                        
  Adjus…                                                                        
  net       $              5    $        -8    $             102    $      132  
  income                                                                        
  (loss)                                                                        
  Avera…                                                                        
  shares                26.0           27.3                 26.8          27.6  
  outst…                                                                        
  dilut…                                                                        
  Adjus…                                                                        
  earni…                                                                        
  (loss)    $           0.19    $     -0.29    $            3.81    $     4.78  
  per                                                                           
  share                                                                         
  *Amou…                                                                        
  shown                                                                         
  refle…                                                                        
  the                                                                           
  change                                                                        
  in                                                                            
  accou…                                                                        
  princ…                                                                        
  relat…                                                                        
  to the                                                                        
  method                                                                        
  for                                                                           
  asses…                                                                        
  the                                                                           
  reali…                                                                        
  of                                                                            
  U.S.                                                                          
  defer…                                                                        
  tax                                                                           
  assets                                                                        
  descr…                                                                        
  in                                                                            
  the                                                                           
  Compa…                                                                        
  2025                                                                          
  Form                                                                          
  10-K.                                                                         
                                                                                
Adjusted net income and adjusted earnings per share are not recognized terms
under U.S. GAAP and do not purport to be a substitute for profitability.
Adjusted net income and adjusted earnings per share have limitations as
analytical tools as they do not consider certain restructuring and transaction-
related payments and/or expenses. In addition, the Company uses adjusted net
income and adjusted earnings per share for internal planning and forecasting
purposes.

Sources

The 8-K item 2.02 filings (SEC EDGAR) and their EX-99 exhibits: the results release and, when filed, prepared remarks or the call transcript.

Also

Said vs did: the targets in these releases against what was then reported. Filings: every filing.

Work with it

Excel workbook · CSV. Google Sheet that stays up to date: paste =IMPORTDATA("https://tickdelta.com/company/VC/export.csv") into a cell.

Next:Presentations
Esc

Type a ticker such as AAPL, a name, an investor such as Buffett, or a topic such as tariffs. ↑ ↓ to move, Enter to open.