Visteon Corp VC
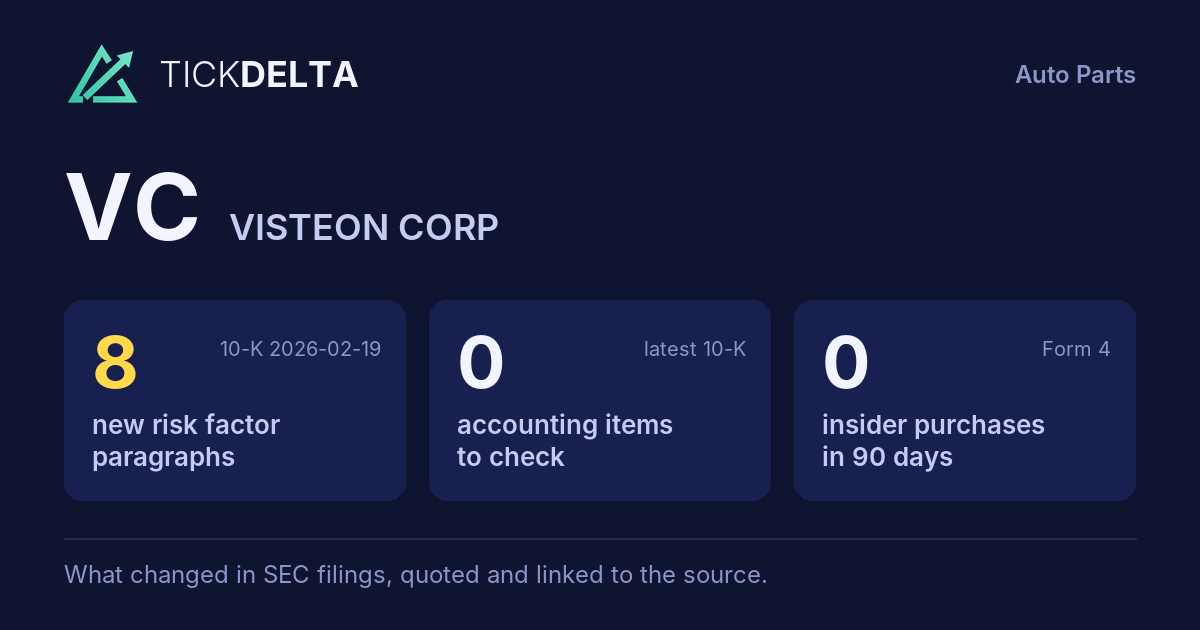
The biggest changes in the 10-K filed Feb 19, 2026, in management's words
10-K, Item 7This fiscal year against the last, and the sentences in the MD&A where management explains each change. Tickdelta picks sentences that name the line, a direction and a cause. It does not write explanations of its own.
Net income
Big change, FY to Dec 31, 2025 vs Dec 31, 2024
“Net income attributable to Visteon was $201 million, reflecting a decline from the prior year due largely to a higher income tax provision driven primarily by changes in the Company's valuation allowance assessments, offset in part by lower restructuring costs and higher earnings from non‑consolidated affiliates.”
Read it in the 10-K
“While net income attributable to Visteon declined year‑over‑year driven primarily by changes in the Company's valuation allowance assessments, underlying profitability remained solid, supported by strong operational performance.”
Read it in the 10-K
Cash from operations
Change, FY to Dec 31, 2025 vs Dec 31, 2024
The MD&A has no sentence that names a cause for this change.
Gross margin
Change, FY to Dec 31, 2025 vs Dec 31, 2024
“Net engineering costs, excluding currency, increased cost of sales by $35 million primarily driven by recently acquired engineering services companies.”
Read it in the 10-K
“Cost performance, design changes and other items decreased cost of sales by $49 million primarily due to operational efficiencies.”
Read it in the 10-K
Revenue
Change, FY to Dec 31, 2025 vs Dec 31, 2024
“Sales were $3,768 million, down 3% year over year, reflecting lower customer commodity price recoveries, continued market weakness in China and lower demand for its battery management system.”
Read it in the 10-K
“Customer pricing decreased net sales by $141 million as a result of annual price reductions and lower customer recoveries due to improving supply chain dynamics.”
Read it in the 10-K
What management said, year by year
The cause given in each 10-K, 2 fiscal years, newest first · MD&A (Item 7)
Each bar is how the line changed that year (from the same 10-K's XBRL). Under it, the sentence in that year's MD&A that names the line, a direction and a cause, word for word. A year with no sentence says so.
Revenue
2 of 2 years explained-
FY 2025 -2.5%
“Sales were $3,768 million, down 3% year over year, reflecting lower customer commodity price recoveries, continued market weakness in China and lower demand for its battery management system.”
Read it in the FY 2025 10-K“Customer pricing decreased net sales by $141 million as a result of annual price reductions and lower customer recoveries due to improving supply chain dynamics.”
Read it in the FY 2025 10-K -
FY 2024 -2.2%
“Volumes and net new business increased net sales by $125 million due to continued market outperformance as a result of recent product launches and sales volumes in the America's, partially offset by lower sales in China due to market dynamics.”
Read it in the FY 2024 10-K“Customer pricing decreased net sales by $142 million as a result of lower customer recoveries due to improving supply chain dynamics and annual price reductions.”
Read it in the FY 2024 10-K
Gross margin
2 of 2 years explained-
FY 2025 +0.4 pts
“Net engineering costs, excluding currency, increased cost of sales by $35 million primarily driven by recently acquired engineering services companies.”
Read it in the FY 2025 10-K“Cost performance, design changes and other items decreased cost of sales by $49 million primarily due to operational efficiencies.”
Read it in the FY 2025 10-K -
FY 2024 +1.4 pts
“Foreign currency decreased cost of sales by $17 million, primarily attributable to the Mexican peso and Japanese yen, partially offset by the Brazilian real.”
Read it in the FY 2024 10-K“changes and other decreased cost of sales by $203 million primarily due to lower recoveries from improving supply chain dynamics and manufacturing efficiencies.”
Read it in the FY 2024 10-K
Net income
2 of 2 years explained-
FY 2025 -32.1%
“Net income attributable to Visteon was $201 million, reflecting a decline from the prior year due largely to a higher income tax provision driven primarily by changes in the Company's valuation allowance assessments, offset in part by lower restructuring costs and higher earnings from non‑consolidated affiliates.”
Read it in the FY 2025 10-K“While net income attributable to Visteon declined year‑over‑year driven primarily by changes in the Company's valuation allowance assessments, underlying profitability remained solid, supported by strong operational performance.”
Read it in the FY 2025 10-K -
FY 2024 -43.6%
“Net Income attributable to Visteon of $274 million declined compared to the prior year primarily due to a larger deferred tax valuation allowance release in 2023 as compared to 2024.”
Read it in the FY 2024 10-K“The Company's provision for income taxes was $14 million for year ended December 31, 2024, reflecting a $262 million increase compared to the $248 million benefit from income taxes in 2023.”
Read it in the FY 2024 10-K
Cash from operations
1 of 2 years explained-
FY 2025 -4.0%
The FY 2025 MD&A has no sentence that names a cause for this change.
-
FY 2024 +59.9%
“The increase in cash from operations in 2024 when compared to the prior period is primarily attributable to higher Adjusted EBITDA of $40 million and improved working capital inflow of $95 million, primarily related to accounts receivable and accounts payable.”
Read it in the FY 2024 10-K
Changes are computed from the XBRL figures in the same 10-K. Hover a number to see the line item. Open the 10-K
Sources
The Management's Discussion and Analysis (Item 7) of the latest 10-K, quoted word for word; the changes are computed from the same 10-K's XBRL.
Also
Financials: the numbers year by year.
Work with it
Excel workbook · CSV. Google Sheet that stays up to date: paste =IMPORTDATA("https://tickdelta.com/company/VC/export.csv") into a cell.