Form 10-K for the Year Ended June 30, 2023
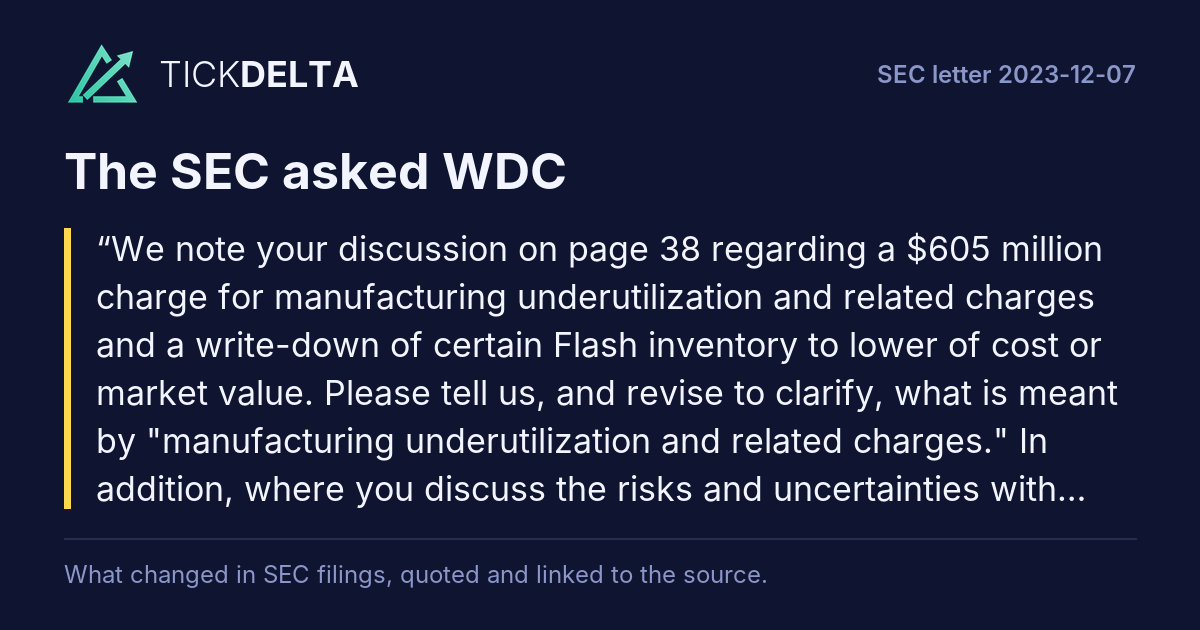
We note your discussion on page 38 regarding a $605 million charge for manufacturing underutilization and related charges and a write-down of certain Flash inventory to lower of cost or market value. Please tell us, and revise to clarify, what is meant by "manufacturing underutilization and related charges." In addition, where you discuss the risks and uncertainties with regard to your strategic relationships onRest of the question
page 16 and seasonality and cyclicality on page 18, revise to include a separate quantified discussion of charges related to inventory write-downs and manufacturing underutilization to add context to such risks.
We respectfully advise the Staff that in our “Operational Update” included on page 35 in the Management’s Discussion and Analysis of Financial
Condition and Results of Operations section of the Form 10-K, we noted several macroeconomic factors that had created a supply-demand imbalance, which resulted in reduced shipments and negatively impacted pricing of our products, particularly in Flash.Read in the reply ↗Rest of the answer
In response to these conditions and to reduce our bit growth to align our supply with the projected market demand, we temporarily reduced the utilization of our manufacturing capacity to an abnormally low level. For 2023, we disclosed $605 million for manufacturing underutilization and related charges and a write-down of certain flash inventory. This amount consisted of charges of $497 million for unabsorbed manufacturing overhead costs as a result of the reduced utilization of our manufacturing capacity and charges of $108 million to write-down our inventory as a result of decreases in market pricing.
While we described the macroeconomic factors and our resulting actions that resulted in the manufacturing underutilization and related charges, the
Staff’s comment highlights that we could have provided more clarity for our readers about the nature of these charges and we will revise in future filings.
In further response to the Staff’s comment, we will also update the risk factors referenced by the Staff’s comment in our next Quarterly Report on
Form 10-Q and applicable future filings to include a quantified discussion of the inventory write-downs and manufacturing underutilization charges to add context to those risks (added disclosure is displayed below in bold and underlined; deleted disclosure is displayed as a strike-through):
Page
We rely substantially on strategic relationships with various partners, including Kioxia, which subjects us to risks and uncertainties that could harm our business.
We have entered into and expect to continue to enter into strategic relationships with various partners for product development, manufacturing, sales growth and the supply of technologies, components, equipment and materials for use in our product design and manufacturing, including our business ventures with Kioxia. We depend on Flash Ventures for the development and manufacture of flash-based memory. Our strategic relationships, including Flash Ventures, are subject to various risks that could harm the value of our investments, our revenue and costs, our future rate of spending, our technology plans and our future growth opportunities.
Substantially all of our flash-based memory is supplied by Flash Ventures, which limits our ability to respond to market demand and supply changes and makes our financial results particularly susceptible to variations from our forecasts and expectations. AFor example, we are contractually obligated to pay for 50% of the fixed costs of Flash Ventures regardless of whether we order any flash-based memory, and our orders placed with Flash Ventures on a three-month rolling basis are binding. As a result, a failure to accurately forecast supply and demand could cause us to over-invest or under-invest in inventory, technology transitions or the expansion of Flash Ventures’ capacity. Over-investment by us or our competitors couldcan result in excess supply, which could cause and lead to significant decreases in our product prices, significant excess, obsolete inventory or inventory write-downs or underutilization charges, and the potential impairment of our investments in Flash Ventures. We are contractually obligated to pay for 50% of the fixed costs of Flash Ventures regardless of whether we order any flash-based memory, and our orders placed with Flash Ventures on a three-month rolling basis are binding. For example, in 2023, we incurred charges for unabsorbed manufacturing overhead costs as a result of the reduced utilization of our manufacturing capacity and charges to write-down our inventory as a result of decreases in market pricing, which together aggregated to $404 million for our Flash business. These charges were attributable to a significant imbalance of supply and demand and our actions taken in response thereto. On the other hand, if we under-invest in Flash Ventures, or otherwise grow or transition Flash Ventures’ capacity too slowly, we may not have enough supply of flash-based memory, or the right type of flash-based memory, to meet demand on a timely and cost-effective basis, and we may lose opportunities for revenue, gross margin and market share as a result. If our supply is limited, we might make strategic decisions with respect to the allocation of our supply among our products and customers, which could result in less favorable gross margins or damage customer relationships.
Our control over the operations of our business ventures may be limited, and our interests could diverge from our strategic partners’ interests regarding ongoing and future activities. For example, under the Flash Ventures agreements, we cannot unilaterally direct most of Flash Ventures’ activities, and we have limited ability to source or fabricate flash outside of Flash
Ventures. Flash Ventures requires significant investments by both Kioxia and us for technology transitions and capacity expansions, and our business could be harmed if our technology roadmap and investment plans are not sufficiently aligned with
Kioxia’s. Lack of alignment with Kioxia with respect to Flash Ventures could negatively impact our ability to react quickly to changes in the market, or to stay at the forefront of technological advancement. Misalignment could arise due to changes in Kioxia’s strategic priorities, management, ownership or access to capital, which have changed in recent years and could continue to change. Kioxia’s stakeholders may include, or have included in the past, competitors, customers, a private equity firm, government entities or public stockholders. Kioxia’s management changes, ownership and capital structure could lead to delays in decision-making, disputes or changes in strategic direction that could negatively impact the strategic partnership, and therefore us. There may exist conflicts of interest between Kioxia’s stakeholders and Flash Ventures or us with respect to, among other things, protecting and growing Flash Ventures’ business, IP and competitively sensitive confidential information.
Together with Kioxia, we fund a portion of the investments required for Flash Ventures through lease financings. Continued availability of lease financings for Flash Ventures is not guaranteed and could be limited by several factors, including investor capacity and risk allocation policies, our or Kioxia’s financial performance and changes to our or Kioxia’s business, ownership or corporate structure. To the extent that lease financings are not accessible on favorable terms or at all, more cash would be required to fund investments.
Our strategic relationships are subject to additional risks that could harm our business, including, but not limited to, the following:
• failure by our strategic partners to comply with applicable laws or employ effective internal controls;
difficulties and delays in product and technology development at, ramping production at, and transferring technology to, our strategic partners;
declining financial performance of our strategic partners, including failure by our strategic partners to timely fund capital investments with us or otherwise meet their commitments, including paying amounts owed to us or third parties when due;
we may lose the rights to, or ability to independently manufacture, certain technology or products being developed or manufactured by strategic partners, including if any of them is acquired by another company, files for bankruptcy or experiences financial or other losses;
a bankruptcy event involving a strategic partner could result in structural changes to or termination of the strategic partnership; and changes in tax or regulatory requirements may necessitate changes to the agreements governing our strategic partnerships.
We experience sales seasonality and cyclicality, which could cause our operating results to fluctuate. In addition, accurately forecasting demand has become more difficult, which could harm our business.
Sales of many of our products tend to be seasonal and subject to supply-demand cycles. Changes in seasonal and cyclical supply and demand patterns have made it, and could continue to make it, more difficult for us to forecast demand. Changes in the product or channel mix of our business can also impact seasonal and cyclical patterns. For example, we often ship a high percentage of our total quarterly sales in the third month of the quarter, which makes it difficult for us to forecast our financial results before the end of each quarter. As a result of the above or other factors, our forecast of financial results for a given quarter may differ materially from our actual financial results.
The variety and volume of products we manufacture are based in part on accurately forecasting market and customer demand for our products.
Accurately forecasting demand has become increasingly difficult for us, our customers and our suppliers due to volatility in global economic conditions, end market dynamics and industry consolidation, resulting in less availability of historical market data for certain product segments. Further, for many of our OEM customers utilizing just-in-time inventory, we do not generally require firm order commitments and instead receive a periodic forecast of requirements, which may prove to be inaccurate. In addition, because our products are designed to be largely interchangeable with competitors’ products, our demand forecasts may be impacted significantly by the strategic actions of our competitors. As forecasting demand becomes more difficult, the risk that our forecasts are not in line with demand increases. This has caused, and may in the future cause, our forecasts to exceed actual market demand, resulting in periods of product oversupply, excess inventory, asset underutilization of manufacturing capacity and price decreases, which has impacted and could further impact our sales, ASPs and gross margin or require us to incur additional inventory write-downs or additional charges for unabsorbed manufacturing overhead, thereby negatively affecting our operating results and our financial condition. For example, in 2023 we incurred charges for unabsorbed manufacturing overhead costs as a result of the reduced utilization of our manufacturing capacity and charges to write-down our inventory as a result of decreases in market pricing, which together aggregated to
$605 million. These charges were attributable to a significant imbalance of supply and demand and our actions taken in response thereto. If market demand increases significantly beyond our forecasts or beyond our ability to add manufacturing capacity, then we may not be able to satisfy customer product needs, possibly resulting in a loss of market share if our competitors are able to meet customer demands. In addition, some of our components have long lead-times, requiring us to place orders several months in advance of anticipated demand. Such long lead-times increase the risk of excess inventory, potentially resulting in inventory write-downs, or loss of sales in the event our forecasts vary substantially from actual demand.
First report after the company's reply of 2023-12-20: 10-Q filed 2024-02-12 ↗, against the 10-Q filed 2023-11-07 ↗.
Tickdelta does not hold the text of both reports, so they are not compared here.
We refer to your October 28, 2019 response letter where you indicated your intent to include a quantified discussion of units sold, average selling prices or other metrics to the extent relevant to further promote an understanding of your results of operations.Rest of the question
Given the significant impact that macroeconomic factors have had on your recent operations, please revise to include a quantified discussion of units sold and average selling prices for both your Flash and HDD products as provided in the Quarterly Facts Sheets of your Earnings Presentation to provide further context to your results of operations discussion, or explain why you do not believe this information is relevant to an understanding of the significant declines in your revenue and profit margins. In addition, where a material change is attributed to two or more factors, including any offsetting factors, revise throughout your results of operations discussion to ensure you include a quantified discussion of each factor and avoid using terms such as "primarily" or "substantially all" in favor of specific quantification. Refer to Item 303(b) of Regulation S-X.
We respectfully acknowledge the Staff’s comment and note that our revenue can be impacted by changes in the volume of exabytes sold as well as changes in our realized average selling price per gigabyte. Since our October 28, 2019 response, we have enhanced our disclosures to provide quantification of the relative impact of changes in volume and pricing on revenue for both our Flash and HDD business units.
As described on page 38 of the Form 10-K, HDD revenue declined 31% from 2022 to 2023.Read in the reply ↗Rest of the answer
In our discussion of results, we disclosed that the primary driver of this revenue decrease was a 26% decrease in exabytes sold, which represented approximately 26 of the 31 percentage points of year-over-year decline with the remaining decline attributable to a decline in realized average selling price per gigabyte of approximately 7%. We believed the quantification of the change in volume as disclosed, the primary driver of the change in revenue for HDD, provided the material information most relevant to investors, but the Staff’s comment highlights to us that we also could have further quantified the decline in our realized average selling price per gigabyte.
For our Flash business unit, as described on page 37 of the Form 10-K, the primary driver of the change in revenue from 2022 to 2023 was pricing. The change in volume was not meaningful, and was less than 1 percent. While we disclosed that substantially all of the year-over-year decline in revenue of 38% resulted from the decline in the average selling price per gigabyte, we also acknowledge that we could have quantified the actual percentage point change in pricing.
In each case, while our discussion focused on the impact of the material driver (volume or pricing), in light of the Staff’s comment, we will revise future disclosures to more clearly quantify the changes in both volume and pricing.
In addition, in response to the second part of the Staff’s comment, we will continue to assess and revise the disclosure in our future filings to include a quantified discussion, to the extent applicable and reasonably practicable, of the factors, including any offsetting factors, that have contributed to a material change in a particular financial statement line item. We respectfully advise the
Staff that if quantification is not reasonably practical to explain a particular line item change, we plan to narratively describe the relative contribution of the applicable factors.
First report after the company's reply of 2023-12-20: 10-Q filed 2024-02-12 ↗, against the 10-Q filed 2023-11-07 ↗.
Tickdelta does not hold the text of both reports, so they are not compared here.
We note your segment results presentation includes a line item for "Total gross profit for segments." Please revise to remove this total as it creates a non-GAAP measure that should not be included in the financial statement footnotes. Similar revisions should be made in your Form 10-Q filings. Refer to Item 10(e)(1)(ii)(C) of Regulation S-K.Rest of the question
In closing, we remind you that the company and its management are responsible for the accuracy and adequacy of their disclosures, notwithstanding any review, comments, action or absence of action by the staff.
We respectfully acknowledge the Staff’s comment. As discussed in a phone conversation with our legal counsel, we note that ASC 280-10-50-30 (b) provides the following guidance: “A public entity shall provide reconciliations of…the total of the reportable segments’ measures of profit or loss to the public entity’s consolidated income before income taxes and discontinued operations.” With regards to our disclosure of segment gross profit, we interpreted the above guidance to require disclosure of the total of the reportable segment gross profit, which we then reconciled to the correspondingRead in the reply ↗Rest of the answer
consolidated gross profit for our company.
We believe that our presentation is consistent with ASC guidance on this point.
We acknowledge that the reconciliation table included in Note 3 does not reconcile down to “Income (loss) before taxes”; however, no other items of income or expense included in our consolidated statements of operations are allocated to the measure of profit for our segments. As such, we believe the reconciliation of total gross profit for segments to the consolidated gross profit provided in the table in our Note 3, together with the consolidated statements of operations in our filing, provide users of our financial statements with the information necessary to clearly tie to our consolidated “Income (loss) before taxes” without adding redundant information to the table in Note 3.
First report after the company's reply of 2023-12-20: 10-Q filed 2024-02-12 ↗, against the 10-Q filed 2023-11-07 ↗.
Tickdelta does not hold the text of both reports, so they are not compared here.
Also in this review: closing letter, 2024-01-03