Westlake Corp WLK
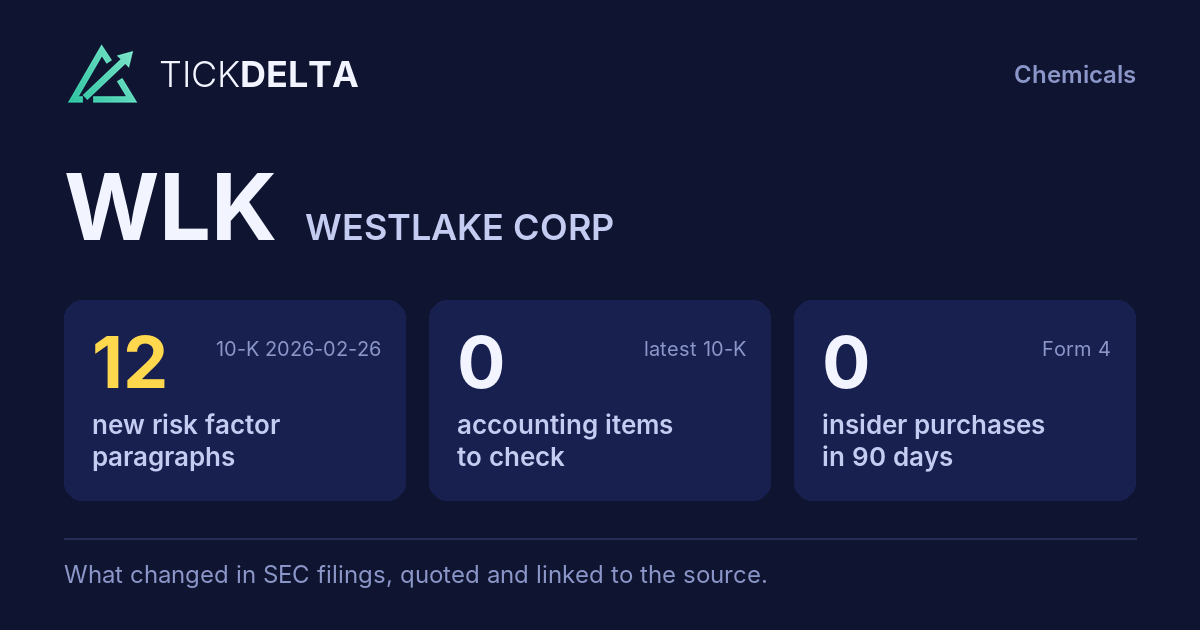
The biggest changes in the 10-K filed Feb 26, 2026, in management's words
10-K, Item 7This fiscal year against the last, and the sentences in the MD&A where management explains each change. Tickdelta picks sentences that name the line, a direction and a cause. It does not write explanations of its own.
Net income
Big change, FY to Dec 31, 2025 vs Dec 31, 2024
“The decrease in net income and income from operations was primarily due to lower sales prices for many of our products across both segments, including PVC resin, polyethylene, chlorine and pipe and fittings, lower sales volumes for PVC resin, epoxy resin, polyethylene, caustic soda, chlorine, compounds and building products and higher energy and feedstock costs in the year ended December 31, 2025.”
Read it in the 10-K
“Other income, net decreased in 2025 as compared to 2024 primarily due to a reduction of $53 million of interest income resulting from the Company's lower average cash and cash equivalent balances as well as lower interest rates in 2025 as compared to 2024 and the recognition of higher insurance recoveries in 2024 as compared to 2025, partially offset by a gain of $32 million recognized in 2025, resulting from settlement of a portion of the Company's pension benefits liability.”
Read it in the 10-K
Operating margin
Big change, FY to Dec 31, 2025 vs Dec 31, 2024
“The increase in selling, general and administrative expenses in 2025 as compared to 2024 was primarily due to higher legal and other consulting costs and higher technology-related expenses, partially offset by lower payroll and related benefits costs.”
Read it in the 10-K
Gross margin
Big change, FY to Dec 31, 2025 vs Dec 31, 2024
“The decrease in gross margin for the year ended December 31, 2025 as compared to the year ended December 31, 2024 was primarily due to lower sales volumes and prices for most of our products across both segments and higher energy and feedstock costs for the year ended December 31, 2025 as compared to the year ended December 31, 2024.”
Read it in the 10-K
Cash from operations
Big change, FY to Dec 31, 2025 vs Dec 31, 2024
“The $849 million decrease in cash flow from operating activities was mainly due to lower prices and demand for most of our products and cash used in connection with the turnaround of the Petro 1 ethylene facility in Lake Charles, partially offset by a favorable change in working capital in 2025.”
Read it in the 10-K
Revenue
Change, FY to Dec 31, 2025 vs Dec 31, 2024
“Net sales decreased by $972 million to $11,170 million in 2025 from $12,142 million in 2024, primarily due to lower sales prices for PVC resin, polyethylene, chlorine and pipe and fittings, and lower sales volumes for PVC resin, epoxy resin, polyethylene, caustic soda, chlorine, compounds and building products, which were partially offset by higher compounds sales prices and pipe and fittings sales volumes.”
Read it in the 10-K
“Sales volumes decreased by 5% in 2025 as compared to 2024, primarily due to lower sales volumes for PVC resin, epoxy resin, polyethylene, caustic soda, chlorine, compounds and building products, which were partially offset by higher pipe and fittings sales volumes.”
Read it in the 10-K
What management said, year by year
The cause given in each 10-K, 2 fiscal years, newest first · MD&A (Item 7)
Each bar is how the line changed that year (from the same 10-K's XBRL). Under it, the sentence in that year's MD&A that names the line, a direction and a cause, word for word. A year with no sentence says so.
Revenue
2 of 2 years explained-
FY 2025 -8.0%
“Net sales decreased by $972 million to $11,170 million in 2025 from $12,142 million in 2024, primarily due to lower sales prices for PVC resin, polyethylene, chlorine and pipe and fittings, and lower sales volumes for PVC resin, epoxy resin, polyethylene, caustic soda, chlorine, compounds and building products, which were partially offset by higher compounds sales prices and pipe and fittings sales volumes.”
Read it in the FY 2025 10-K“Sales volumes decreased by 5% in 2025 as compared to 2024, primarily due to lower sales volumes for PVC resin, epoxy resin, polyethylene, caustic soda, chlorine, compounds and building products, which were partially offset by higher pipe and fittings sales volumes.”
Read it in the FY 2025 10-K -
FY 2024 -3.2%
“Net sales decreased by $406 million to $12,142 million in 2024 from $12,548 million in 2023, primarily due to lower sales prices for PVC resin, epoxy resin, caustic soda, chlorine and pipe and fittings, partially offset by higher sales volumes for PVC resin, polyethylene, epoxy resin, caustic soda, chlorine, pipe and fittings and siding and trim.”
Read it in the FY 2024 10-K“Net sales decreased by $406 million, or 3%, to $12,142 million in 2024 from $12,548 million in 2023, primarily due to lower sales prices for most of our products across both segments.”
Read it in the FY 2024 10-K
Gross margin
2 of 2 years explained-
FY 2025 -8.8 pts
“The decrease in gross margin for the year ended December 31, 2025 as compared to the year ended December 31, 2024 was primarily due to lower sales volumes and prices for most of our products across both segments and higher energy and feedstock costs for the year ended December 31, 2025 as compared to the year ended December 31, 2024.”
Read it in the FY 2025 10-K -
FY 2024 -1.6 pts
“The decline in gross margin percentage for the year ended December 31, 2024 as compared to the year ended December 31, 2023 was primarily due to lower prices for most of our products across both segments, which was partially offset by lower natural gas and feedstock costs.”
Read it in the FY 2024 10-K
Operating margin
1 of 2 years explained-
FY 2025 -21.3 pts
“The increase in selling, general and administrative expenses in 2025 as compared to 2024 was primarily due to higher legal and other consulting costs and higher technology-related expenses, partially offset by lower payroll and related benefits costs.”
Read it in the FY 2025 10-K -
FY 2024 +1.4 pts
The FY 2024 MD&A has no sentence that names a cause for this change.
Net income
2 of 2 years explained-
FY 2025 -350.5%
“The decrease in net income and income from operations was primarily due to lower sales prices for many of our products across both segments, including PVC resin, polyethylene, chlorine and pipe and fittings, lower sales volumes for PVC resin, epoxy resin, polyethylene, caustic soda, chlorine, compounds and building products and higher energy and feedstock costs in the year ended December 31, 2025.”
Read it in the FY 2025 10-K“Other income, net decreased in 2025 as compared to 2024 primarily due to a reduction of $53 million of interest income resulting from the Company's lower average cash and cash equivalent balances as well as lower interest rates in 2025 as compared to 2024 and the recognition of higher insurance recoveries in 2024 as compared to 2025, partially offset by a gain of $32 million recognized in 2025, resulting from settlement of a portion of the Company's pension benefits liability.”
Read it in the FY 2025 10-K -
FY 2024 +25.7%
“The decreases in net income and income from operations in the twelve months ended December 31, 2024 were partially offset by higher PVC resin, polyethylene, caustic soda, chlorine, pipe and fittings and siding and trim sales volumes and lower natural gas and feedstock costs.”
Read it in the FY 2024 10-K“Net income for the twelve months ended December 31, 2024 was favorably impacted by higher interest income and was negatively impacted by income tax expense of $45 million as a result of changes in Louisiana tax laws, as discussed above.”
Read it in the FY 2024 10-K
Cash from operations
2 of 2 years explained-
FY 2025 -64.6%
“The $849 million decrease in cash flow from operating activities was mainly due to lower prices and demand for most of our products and cash used in connection with the turnaround of the Petro 1 ethylene facility in Lake Charles, partially offset by a favorable change in working capital in 2025.”
Read it in the FY 2025 10-K -
FY 2024 -43.8%
“The $1,022 million decrease in cash flow from operating activities was mainly due to unfavorable changes in working capital and lower prices for most of our products resulting in lower operating income.”
Read it in the FY 2024 10-K“The $1,059 million decrease in cash flows from operating activities was mainly due to lower prices and demand for most of our products, partially offset by favorable changes in working capital.”
Read it in the FY 2024 10-K
Changes are computed from the XBRL figures in the same 10-K. Hover a number to see the line item. Open the 10-K
Sources
The Management's Discussion and Analysis (Item 7) of the latest 10-K, quoted word for word; the changes are computed from the same 10-K's XBRL.
Also
Financials: the numbers year by year.
Work with it
Excel workbook · CSV. Google Sheet that stays up to date: paste =IMPORTDATA("https://tickdelta.com/company/WLK/export.csv") into a cell.