tickdelta
Sign in

Tickdelta is free for now. Sign up and get Pro free

← Screener

XYLXylem Inc.

Industrials · Pumps · NYSE

Xylem is a leading global water technology company with 2025 revenues of $9.0 billion and approximately 22,000 employees worldwide. 10-K, Item 1

Employees
22,000
Headquarters
Washington, DC
Next results
around Feb 9, 2027
Compare with peers → Embed

When the SEC's staff reviews a filing, it writes to the company with numbered questions, and the company answers each one in a letter. SEC publishes the exchange once the review is over, at least 20 business days later. Below: what the staff asked XYL, and the company's answer to each question, quoted from the letters. A question is not an accusation; most reviews end with the company adding detail to its next filing.

Schedule 14A

2024-08-09 to 2024-09-05 · 1 question · 1 letter from the SEC, 1 from the company
Review closed 2024-09-05
Revenue
SEC asked
We note that you have included Revenue as your Company-Selected Measure pursuant to Item 402(v)(2)(vi) of Regulation S-K. Please include your Company-Selected Measure in the Tabular List provided pursuant to Item 402(v)(6) of Regulation S-K. In that regard, we note that you included “Organic Revenue” in your Tabular List, but not Revenue.
XYL answered
We confirm that we will revise the Company’s future proxy disclosures to include the exact Company-Selected Measure in the Tabular List in accordance with this comment from the Staff. Read in the reply ↗

Also in this review: closing letter, 2024-09-05

Form 10-K for the Fiscal Year Ended December 31, 2023

2024-07-23 to 2024-08-20 · 3 questions · 1 letter from the SEC, 1 from the company
Review closed 2024-08-20
Non-GAAP measuresKey metricsLiquidity and cashIncome taxes
Key Performance Indicators and Non-GAAP Measures, page 40
SEC asked (1)
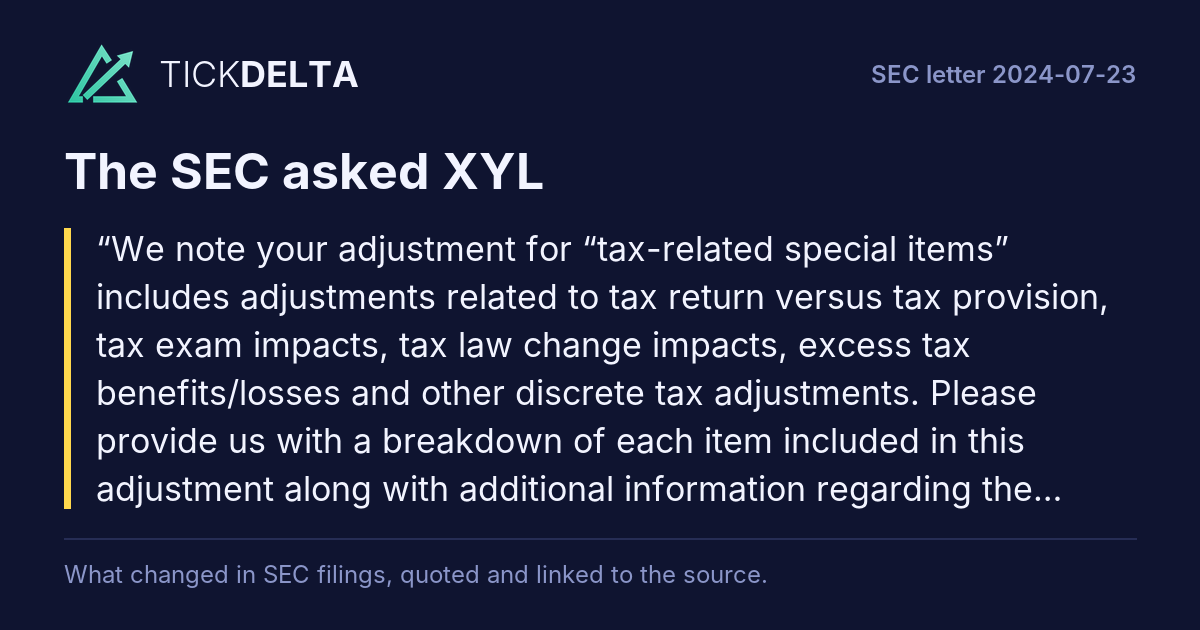
We note your adjustment for “tax-related special items” includes adjustments related to tax return versus tax provision, tax exam impacts, tax law change impacts, excess tax benefits/losses and other discrete tax adjustments.
Rest of the question

Please provide us with a breakdown of each item included in this adjustment along with additional information regarding the nature of such amounts and why they are included in your non-GAAP measures of adjusted net income and adjusted earnings per share. Also, clarify how this adjustment reflects current and deferred income tax expenses commensurate with your non-GAAP measure of profitability. Refer to Item 102.11 of the non-GAAP C&DIs.

XYL answered
to the Staff's comment, in future filings the Company will include further detail regarding the amounts included in the "tax-related special items" adjustment for each period presented to the extent these charges are deemed material. Please see the updated table below using our Form 10-K filed on February 28, 2024 illustrating how the Company plans to display this information in future filings, as appropriate.

(in millions, except per share data) 2023 2022

Net income and Earnings per share 609 2.79 355 1.96

Restructuring and realignment 106 0.49 34 0.19

Acquired intangible amortization
Rest of the answer

176 0.81 72 0.40

Special charges 138 (a) 0.63 160 (b) 0.88

Tax-related special items (115) (c) (0.53) 1 0.01

(Gain) loss from sale of business 1 - (1) (0.01)

Tax effects of adjustments (d)

(90) (0.41) (51) (0.28)

Adjusted net income and Adjusted earnings per share $ 825 $ 3.78 $ 570 $ 3.15

(a) The special charges in the year primarily relate to $126 million of acquisition and integration related costs.

(b) The special charges in the year primarily relate to the U.K. pension settlement expense of $140 million and asset impairment charges of $14 million recorded in the period.

(c) The tax-related special items in the year primarily relate to $70 million of tax benefits from tax exam impacts and $27 million of tax benefits relating to tax law changes.

(d) The tax effects of adjustments are calculated using the statutory tax rate, taking into consideration the nature of the item and the relevant taxing jurisdiction.

Read in the reply ↗
In its next report

First report after the company's reply of 2024-08-16: 10-Q filed 2024-10-31 ↗, against the 10-Q filed 2024-05-02 ↗.

Tickdelta does not hold the text of both reports, so they are not compared here.

Key Performance Indicators and Non-GAAP Measures, page 40
SEC asked (2)
We note your measure of free cash flow includes an adjustment for cash paid in excess of tax provision for R&D law adoption change. Please tell us how you considered the guidance in Item 10(e)(1)(ii)(A) of Regulation S-K, which prohibits excluding charges that will require cash settlement from a non-GAAP liquidity measure, or remove from future filings.
XYL answered
The Company respectfully acknowledges the Staff’s comment and advises the Staff that the Company will remove the adjustment for cash paid in excess of tax provision for R&D law adoption change from our measure of “free cash flow” in future filings. Read in the reply ↗
In its next report

First report after the company's reply of 2024-08-16: 10-Q filed 2024-10-31 ↗, against the 10-Q filed 2024-05-02 ↗.

Tickdelta does not hold the text of both reports, so they are not compared here.

Executive Summary, page 42
SEC asked (3)
We note you provide a discussion of consolidated adjusted EBITDA on page 48 without a similar discussion of the comparable GAAP measure of net income. We also note, you discuss the percentage change in free cash flow and the basis point change in adjusted operating margin in your executive summary, without providing a similar discussion for the comparable GAAP measures net cash provided by operating activities and
Rest of the question

operating income. Please revise to present all GAAP measures and discussions of such measures with equal or greater prominence to the non-GAAP measures. Refer to Question 102.10 of the non-GAAP C&DIs.

XYL answered
The Company respectfully acknowledges the Staff's comment and advises the Staff that it will present all GAAP measures and discussions of such measures with equal or greater prominence to the non-GAAP measures in future filings, including any discussions in the Executive Summary section.

With respect to the Staff’s comment regarding providing a comparable discussion of the GAAP measure of net income when consolidated adjusted EBITDA is discussed, the Company notes that in its quarterly report on Form 10-Q for the period ended June 30, 2024 filed on July 30, 2024 (“Q2 2024 10-Q”), we provided
Rest of the answer

this discussion in the section titled “Operating Income, Net Income, and Adjusted EBITDA” on page 47 and will continue to do so in future filings. Please see the updated disclosures below excerpted from the Company’s Q2 2024 10-Q quarter to date disclosures in response to the Staff’s comment.

Operating Income, Net Income, and Adjusted EBITDA

Operating income was $253 million (operating margin of 11.7%) during the second quarter of 2024, an increase of $134 million, or 112.6%, when compared to operating income of $119 million (operating margin of 6.9%) during the prior year. Operating margin increased 480 basis points, which included net favorable impacts of 360 basis points from decreases in special charges and restructuring and realignment costs, partially offset by increases in acquired intangible asset amortization compared to the prior year. Additionally, operating margin expansion included 530 basis points of favorable operational impacts driven by 240 basis points of productivity savings, 150 basis points of increased volumes, and 120 basis points of price realization. These favorable impacts were partially offset by 420 basis points of unfavorable operational impacts, driven by 180 basis points of inflation, 70 basis points of increased spending on strategic investments, 60 basis points of unfavorable mix and 50 basis points of increased employee costs. Excluding acquired intangible asset amortization, restructuring and realignment costs, and special charges, adjusted operating income was $352 million (adjusted operating margin of 16.2%) for the second quarter of 2024 as compared to adjusted operating income of $259 million (adjusted operating margin of 15.0%) during the comparable quarter in the prior year.

Net income for the second quarter was $194 million (net income margin of 8.9%), an increase of $102 million as compared to Net income in the prior year of $92 million (net income margin of 5.3%). The increase in net income was driven by increased operating income of $134 million, decreased non-operating income and gains from sale of businesses of $2 million, decreased interest expense of $1 million and increased income tax expense of $31 million. Adjusted EBITDA was $452 million (adjusted EBITDA margin of 20.8%) during the second quarter of 2024, an increase of $123 million, or 37%, when compared to adjusted EBITDA of $329 million (adjusted EBITDA margin of 19.1%) during the comparable quarter in the prior year, an increase to adjusted EBITDA margin of 170 basis points. Adjusted EBITDA margin was impacted by the same offsetting factors impacting the adjusted operating margin; however, adjusted EBITDA margin also benefited from the exclusion of incremental depreciation and amortization.

We would be pleased to discuss any of the foregoing responses to the extent you require further clarification or additional information. Please feel free to contact William K. Grogan at William.Grogan@xylem.com or myself at Geri.Mcshane@xylem.com or by phone at (914) 323-5700.

Read in the reply ↗
In its next report

First report after the company's reply of 2024-08-16: 10-Q filed 2024-10-31 ↗, against the 10-Q filed 2024-05-02 ↗.

Tickdelta does not hold the text of both reports, so they are not compared here.

Also in this review: request for more time, 2024-07-24, closing letter, 2024-08-20

Schedule 14A

2023-07-28 to 2023-08-16 · 2 questions · 1 letter from the SEC, 1 from the company
Review closed 2023-08-16
Executive payRevenue
Definitive Proxy Statement on Schedule 14A filed April 3, 2023 · Pay versus Performance, page 65
SEC asked (1)
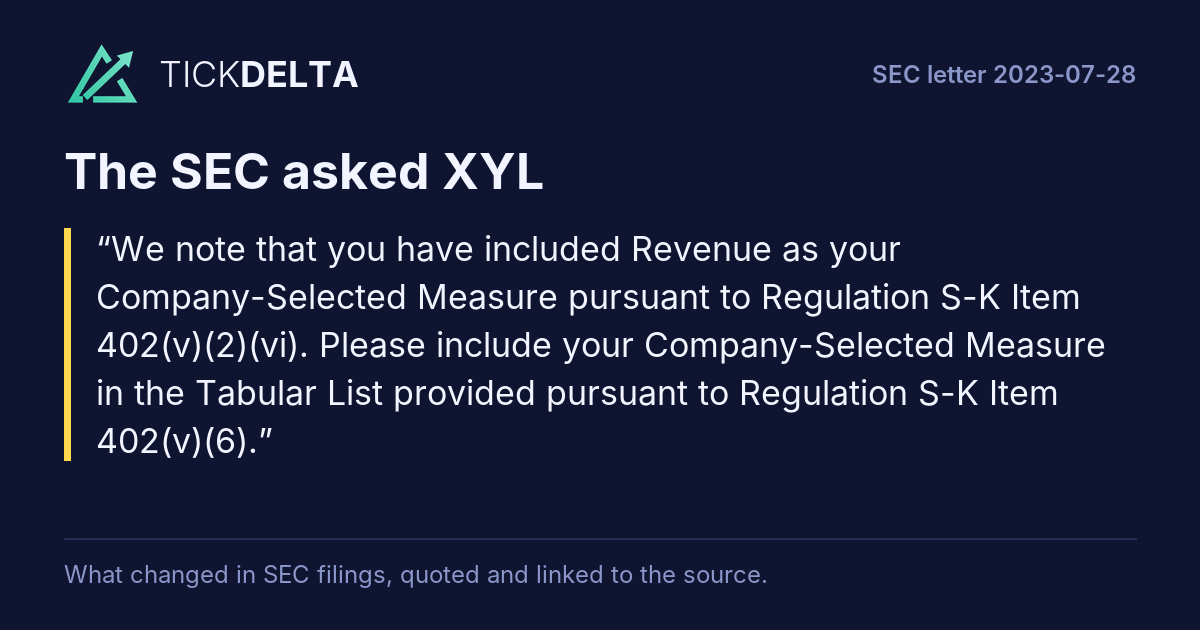
We note that you have included Revenue as your Company-Selected Measure pursuant to Regulation S-K Item 402(v)(2)(vi). Please include your Company-Selected Measure in the Tabular List provided pursuant to Regulation S-K Item 402(v)(6).
XYL answered
We confirm that we will revise the Company’s future proxy disclosures in accordance with this comment from the Staff. Read in the reply ↗
Definitive Proxy Statement on Schedule 14A filed April 3, 2023 · Pay versus Performance, page 65
SEC asked (2)
Refer to the reconciliation tables in the footnotes to your pay versus performance table. It is unclear what amounts are reflected in the rows titled "Plus (less), year over year change in fair value of equity awards granted in prior years that vested in the year." Specifically, equity awards granted in prior years that vest during the relevant year should be valued as the difference between the fair value as of the
Rest of the question

end of the prior fiscal year and the vesting date, not the "year over year" change in value. Please ensure that your table headings reflect accurately the amounts used to calculate compensation actually paid. Refer to Item 402(v)(2)(C)(iv) of Regulation S-K.

XYL answered
We confirm that we calculated these values as the difference between the fair value as of the end of the prior fiscal year-end and the vesting date. We will make that label clear in future proxy disclosures in accordance with this comment from the Staff. Read in the reply ↗

Also in this review: closing letter, 2023-08-16

Form 10-K for the Year Ended December 31, 2021

2022-08-01 to 2022-09-22 · 10 questions · 2 letters from the SEC, 2 from the company
Review closed 2022-09-22
SegmentsNon-GAAP measuresResults discussion (MD&A)Key metricsChinaGoodwill and impairmentIncome taxes
SEC asked (1)
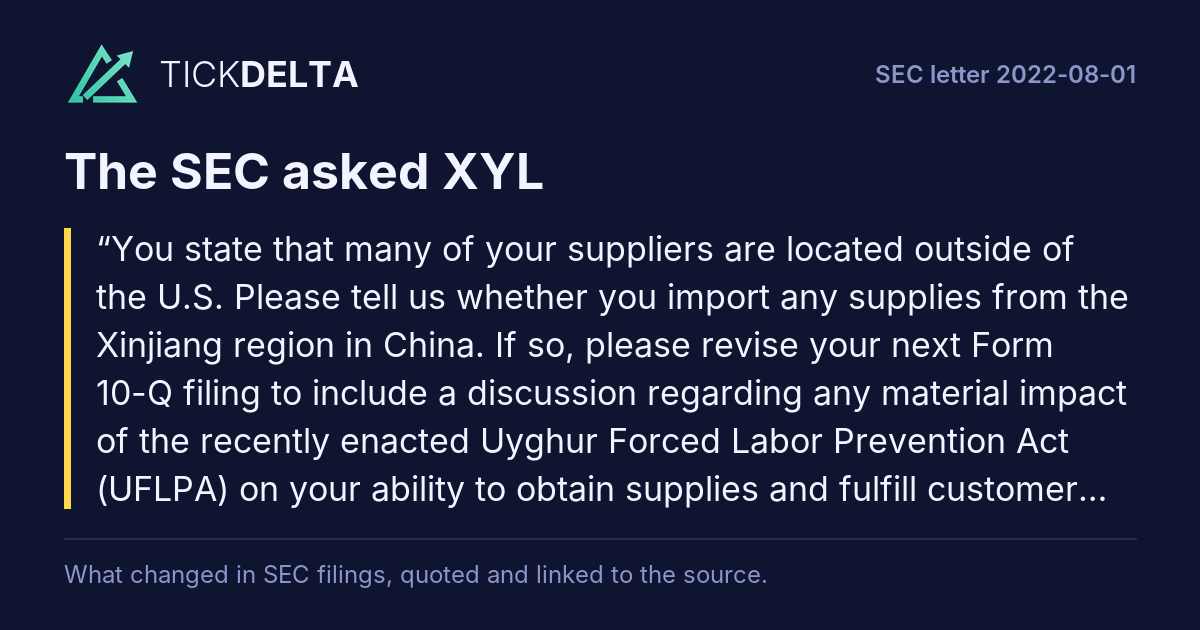
You state that many of your suppliers are located outside of the U.S. Please tell us whether you import any supplies from the Xinjiang region in China. If so, please revise your next Form 10-Q filing to include a discussion regarding any material impact of the recently enacted Uyghur Forced Labor Prevention Act (UFLPA) on your ability to obtain supplies and fulfill customer orders.
Rest of the question

Also, if applicable, discuss any efforts taken to mitigate such impact and where possible quantify the impact to your business.

XYL answered
The Company respectfully advises the Staff that it and its subsidiaries have no known past, current, or anticipated imports into the U.S. of materials from direct suppliers located in the Xinjiang region in China. Furthermore, as specified in the Risk Factors (page 24), the Company maintains policies that mandate compliance with all applicable laws and regulations, including the UFLPA. Read in the reply ↗
Management's Discussion and Analysis of Financial Condition and Results of Operations · Overview, page 34
SEC asked (2)
You state that throughout 2021 your operating costs have been impacted by price inflation and you expect this to continue into the foreseeable future. You refer to mitigating inflation headwinds but it is unclear what specific actions you have taken. Please revise to identify specific actions planned or taken to mitigate inflationary pressures.
Rest of the question

Also, include a discussion of the principal factors contributing to the inflationary pressures you have experienced and clarify the impact to your operations.

XYL answered
to the Staff's comment, in future filings the Company will more clearly identify in Management’s Discussion and Analysis of Financial Condition and Results of Operations any mitigating actions taken, principal factors contributing to the inflationary pressures and impact to operations, as applicable. Read in the reply ↗
In its next report

First report after the company's reply of 2022-08-15: 10-Q filed 2022-11-01 ↗, against the 10-Q filed 2022-05-04 ↗.

Tickdelta does not hold the text of both reports, so they are not compared here.

Key Performance Indicators and non-GAAP Measures, page 36
SEC asked (3)
We note several of your non-GAAP measures, including segment non-GAAP measures, exclude special charges. Given the significance of this adjustment for certain periods and considering the various costs that can be included in this adjustment as per your definition on page 37, please revise to include a breakdown of the amounts included in the "special charges" adjustment for each period presented.
XYL answered
to the Staff's comment, in future filings the Company will include further detail regarding the amounts included in the "special charges" adjustment for each period presented to the extent these charges are deemed material.

We believe the “special charges” definition adequately details the nature of the charges, including specifying “non-cash impairment charges.” Goodwill impairment charges for the periods presented are shown as a separate line item on the face of the Consolidated Income Statements and discussed in further detail in Note 12.
Rest of the answer

Goodwill and Other Intangible Assets, and asset impairment charges are disclosed in Note 5. Restructuring and Asset Impairment Charges.

To further clarify for the Staff, the $76 million in special charges in 2020 primarily related to goodwill and intangible asset impairment charges of $70 million (net of tax of $9 million) recorded in the period.

Please see the updated table below using our Form 10-K filed on February 25, 2022 illustrating how the Company plans to display this information in future filings, as appropriate. With respect to the non-GAAP segment measures, please see the Company’s response below to question number 5.

(in millions, except per share data) 2021 2020

Net income & Earnings per share

$427 $2.35

$254

$1.40

Restructuring and realignment, net of tax of $5 and $17 17 0.09

0.33

Special charges, net of tax of $2 and $10

10 0.06

76 (a)

0.42

Tax-related special items

— —

(16)

(0.09)

(Gain) loss from sale of business, net of tax benefit of $0 (2) (0.01) — —

Adjusted net income & Adjusted earnings per share $452 $2.49 $374 $2.06

(a) The $76 million in special charges in 2020 primarily related to goodwill and intangible asset impairment charges of $70 million (net of tax $9 million) recorded in the period.

Read in the reply ↗
In its next report

First report after the company's reply of 2022-08-15: 10-Q filed 2022-11-01 ↗, against the 10-Q filed 2022-05-04 ↗.

Tickdelta does not hold the text of both reports, so they are not compared here.

Results of Operations, page 39
SEC asked (4)
We note you discuss various factors, including offsetting factors, that impacted your segment organic growth based on both geography or application. Similarly, your SG&A expense discussion includes several factors, including offsetting factors, that contributed to the change in such expense.
Rest of the question

When there are material changes to a line item, please describe the underlying reasons for such changes in both quantitative and qualitative terms, including the impact of offsetting factors. Refer to Item 303(b) of Regulation S-K.

XYL answered
We currently disclose the factors impacting these line items in order of relative significance, including consideration of offsetting impacts. We believe our disclosures have included quantitative and qualitative information and the underlying reason for material changes, to the extent such information has been deemed material to investors’ understanding of business trends.
Rest of the answer

For the periods presented, there were no such individual items deemed material in the factors impacting segment organic growth or SG&A expense as a percentage of revenue.

In future filings with the SEC, the Company will provide underlying reasons for changes deemed material, in both quantitative and qualitative terms, similar to the discussion provided in the Form 10-Q for the quarterly period ended June 30, 2021, in the Orders/Backlog section, where we disclosed the offsetting quantitative impact of “a significant project order of greater than $100 million in India during the second quarter of 2020 that did not recur.” This particular order was subsequently cancelled in the fourth quarter of 2020; therefore, it was not a material driver in the discussion of the annual results on the Form 10-K for the Year Ended December 31, 2021.

Read in the reply ↗
In its next report

First report after the company's reply of 2022-08-15: 10-Q filed 2022-11-01 ↗, against the 10-Q filed 2022-05-04 ↗.

Tickdelta does not hold the text of both reports, so they are not compared here.

Operating Income and Adjusted EBITDA, page 44
SEC asked (5)
We note you present non-GAAP measures of EBITDA and adjusted EBITDA for each segment. Please revise to include a reconciliation for each segment to the most comparable segment GAAP measure of segment operating income. Refer to Item 10(e)(1)(i)(B) of Regulation S-K.
Rest of the question

We also note that the reconciliation of segment EBITDA and segment adjusted EBITDA in the Form 8-K furnished on May 4, 2022 appears to be reconciled to a non-GAAP segment measure of pre-tax (loss) income. Please explain or revise. Refer to Question 104.03 of the non-GAAP C&DIs.

XYL answered
The Company respectfully acknowledges the Staff's comment and confirms that in future filings the Company will present a reconciliation of adjusted segment EBITDA to segment operating income for each segment. Please see the updated reconciliation tables below using our Form 10-K filed on February 25, 2022 illustrating how the Company plans to display this information in future filings on Form 10-Q and 10-K.

The Company will also remove the reconciliation to segment Pre-Tax Income (Loss) and include the reconciliation of adjusted segment EBITDA to segment operating income for each segment for
Rest of the answer

the periods presented in any future applicable disclosures furnished on Form 8-K.

The table below provides a reconciliation of total adjusted consolidated EBITDA to consolidated net income:

2021 2020 Change

Net Income $ 427 $ 254 68.1%

Net Income margin 8.2 % 5.2 % 300 bp

Depreciation 118

117

1%

Amortization 127

134

(5.2%)

Interest expense, net 69

(1.4%)

Income tax expense 84

171%

EBITDA $ 825

$ 606

36.1%

Share-based compensation 33

26.9%

Restructuring & realignment 22

(71.4%)

Special charges 12

86 (a)

(86%)

Gain from sale of business (2) — NM %

Adjusted EBITDA $ 890

$ 795

11.9%

Adjusted EBITDA margin 17.1% 16.3% 80 bp

(a) The $86 million in pre-tax special charges in 2020 primarily related to goodwill and intangible asset impairment charges of $79 million recorded in the period.

The table below provides a reconciliation of each segment's adjusted EBITDA to operating income:

2021

Water Infrastructure Applied Water Systems Measurement & Control Solutions

Operating Income $ 387 $ 240 $ 12

Gain from sale of business — 2 —

Depreciation 43 20 38

Amortization 8 2 107

Other non-operating expense (5) (3) (2)

EBITDA $ 433 $ 261 $ 155

Share-based compensation 2 4 6

Restructuring & realignment 12 7 3

Special charges — 1 —

Gain from sale of business — (2) —

Adjusted EBITDA $ 447 $ 271 $ 164

Adjusted EBITDA margin 19.9% 16.8% 12.3%

2020

Operating Income $ 318 $ 205

$ (106)

Depreciation 44 21

Amortization 13 3

107

Other non-operating expense (10) (1) (1)

EBITDA $ 365 $ 228 $ 35

Share-based compensation 2 3

Restructuring & realignment 28 9

Special Charges — —

79 (a)

Adjusted EBITDA $ 395 $ 240 $ 159

Adjusted EBITDA margin 19.0% 16.7% 11.7%

(a) The $79 million in pre-tax special charges in 2020 primarily related to goodwill and intangible asset impairment charges recorded in the period.

Read in the reply ↗
In its next report

First report after the company's reply of 2022-08-15: 10-Q filed 2022-11-01 ↗, against the 10-Q filed 2022-05-04 ↗.

Tickdelta does not hold the text of both reports, so they are not compared here.

Operating Income and Adjusted EBITDA, page 44
SEC asked (6)
You state here that the increase in adjusted operating margin was primarily due to cost reductions from your productivity, restructuring and other cost saving initiatives, favorable volume and price realization, which were partially offset by cost inflation and increased spending on strategic investments.
Rest of the question

Please revise to include a quantified discussion regarding the impact of these factors on your GAAP operating income. Similar revisions should be made to your segment discussion beginning on page 47.

XYL answered
We currently disclose the factors impacting operating margin and adjusted operating margin on a consolidated and segment basis in order of relative significance, including consideration of offsetting impacts. We believe our disclosures have included quantitative discussions of impacting factors to the extent individual drivers have been deemed quantitatively and/or qualitatively material to investors’ understanding of business trends.
Rest of the answer

For the periods presented, there were no such individual items deemed material in the factors impacting consolidated or segment adjusted operating margin.

In future filings with the SEC, the Company will provide a quantified discussion similar to the that disclosed in the Form 10-Q for the Quarterly Period Ended March 31, 2020, in which we disclosed the impact of an individual charge deemed material as follows: “$15 million warranty charge recorded during the quarter for a firmware issue in some of our meters…”.

Read in the reply ↗
In its next report

First report after the company's reply of 2022-08-15: 10-Q filed 2022-11-01 ↗, against the 10-Q filed 2022-05-04 ↗.

Tickdelta does not hold the text of both reports, so they are not compared here.

Exhibit 99.1, page 1
SEC asked (7)
We note your discussion of adjusted EBITDA margin without a similar discussion of the comparable GAAP measure net income margin. Also, you discuss changes in segment adjusted EBITDA margin before discussing any change in the comparable GAAP measure of segment operating margin. Please revise to present all GAAP measures and discussions of such measures with greater prominence to the non-GAAP measures.
Rest of the question

Refer to Question 102.10 of the non-GAAP C&DIs.

XYL answered
The Company respectfully acknowledges the Staff's comment and confirms that, in any future applicable disclosures furnished on Form 8-K, the Company will present net income margin and segment operating margin with greater prominence than the non-GAAP measures of adjusted EBITDA margin and segment adjusted EBITDA margin, respectively.
Rest of the answer

See the updated discussion below as an illustrative example of how the Company plans to address this in the performance discussion in future press releases furnished on Form 8-K.

Xylem generated net income of $82 million (6.4% margin), or $0.45 per share, and adjusted net income of $84 million (6.6% margin), or $0.47 per share, which excludes the impact of restructuring, realignment and special charges. First quarter adjusted earnings before interest, tax, depreciation and amortization (EBITDA) margin decreased 290 basis points to 14.2 percent.

We will be reaching out to David Edgar later this week to see if the Staff would like to discuss any of the foregoing responses and to determine whether or not the Staff require further clarification or additional information. Please also feel free to contact Sandy Rowland at sandy.rowland@xylem.com or myself at geri.mcshane@xylem.com or by phone at (914) 323-5700.

Read in the reply ↗
In its next report

First report after the company's reply of 2022-08-15: 10-Q filed 2022-11-01 ↗, against the 10-Q filed 2022-05-04 ↗.

Tickdelta does not hold the text of both reports, so they are not compared here.

Management's Discussion and Analysis of Financial Condition and Results of Operations · Key Performance Indicators and Non-GAAP Measures, page 36
SEC asked (1)
We note from your response to prior comment 3 that the special charges in fiscal 2020 are comprised of goodwill and asset impairment charges, net of tax. Please revise to include any income tax adjustments as a separate line item in your non-GAAP reconciliation and explain how the tax impact is calculated. Refer to Question 102.11 of the non-GAAP C&DIs.
XYL answered
to the Staff’s comment and consistent with Question 102.11 of the non-GAAP C&DIs, in future filings the Company will reflect the impact of income tax adjustments as a separate line item and explain how the tax impact is calculated. Please see the updated table and figures below (based on our response to prior comment 3) illustrating how the Company plans to display this information in future filings.

(in millions, except per share data) 2021 2020

Net income & Earnings per share

$ 427 $ 2.35

$ 254 $ 1.40

Restructuring and realignment

0.12

0.43

Special charges

0.07

86
Rest of the answer

(a)

0.47

Tax-related special items

— —

(16) (0.09)

(Gain) loss from sale of business (2) (0.01)

—

Tax effects of adjustments (b)

(7) (0.04)

(27) (c)

(0.15)

Adjusted net income & Adjusted earnings per share $ 452 $ 2.49

$ 374 $ 2.06

(a) The $86 million in special charges in 2020 primarily relates to goodwill and intangible asset impairment charges of $79 million recorded in the period.

(b) The tax effects of adjustments are calculated using the statutory tax rate, taking into consideration the nature of the item and the relevant taxing jurisdiction.

(c) The $27 million in tax effects of adjustments in 2020 consisted of $17 million related to restructuring and realignment costs and $10 million related to special charges.

Read in the reply ↗
In its next report

First report after the company's reply of 2022-09-20: 10-Q filed 2022-11-01 ↗, against the 10-Q filed 2022-05-04 ↗.

Tickdelta does not hold the text of both reports, so they are not compared here.

Results of Operations, page 39
SEC asked (2)
We note your response to prior comment 6 and we continue to believe that your results of operations discussion should be significantly enhanced to provide a quantified discussion of the factors impacting your GAAP operating income.
Rest of the question

In this regard, operating income increased $218 million during fiscal 2021, which you appear to attribute to a $132 million decrease in special charges and restructuring and realignment costs. Similarly, operating income decreased $146 million during the second quarter of fiscal 2022 of which you attribute $3 million to increased special changes and realignment costs. Your reference to other qualitative factors impacting your adjusted operating income does not provide sufficient information regarding how your GAAP operating income has been impacted by factors such as productivity, restructuring initiatives, favorable volume and price realization or by offsetting factors such as cost inflation or strategic initiatives. Please revise both here and in your segment discussion and avoid using terms such as "primarily" or "partially offset." This comment also applies to your response to prior comment 4. Form 8-K furnished on August 2, 2022

XYL answered
to the additional request relating to prior comment 6, and in keeping with our desire to provide meaningful communication to investors, in future filings with the SEC, the Company will provide a quantified discussion in Results of Operations with respect to consolidated and segment GAAP operating income margin. Operating income margin is one of the key metrics used by management to measure the business and communicate with investors regarding our performance.
Rest of the answer

See the updated discussions below using our Form 10-K filed on February 25, 2022 and our Water Infrastructure segment as illustrative examples of how the Company plans to disclose this information. We will apply a similar approach to all segments in future filings on Form 10-Q and 10-K.

Operating Income and Adjusted EBITDA

Operating income was $585 million (operating margin of 11.3%) during 2021, an increase of $218 million, or 59.4%, when compared to operating income of $367 million (operating margin of 7.5%) during the prior year, or a total increase of 380 basis points. Operating margin expansion included favorable impacts of 280 basis points from decreases in special charges and restructuring and realignment costs as compared to the prior year, as well as 715 basis points from favorable operating impacts, which were driven by a 390 basis point increase related to cost reductions from our productivity, restructuring and other cost saving initiatives, 140 basis points due to favorable volume and 90 basis points due to price realization. Margin expansion was offset by negative impacts of 615 basis points driven by 400 basis points of inflation and 140 basis points of increased spending on strategic investments. Excluding special charges and restructuring and realignment costs, adjusted operating income was $611 million (adjusted operating margin of 11.8%) for 2021 as compared to adjusted operating income of $525 million (adjusted operating margin of 10.8%) during the prior year.

Water Infrastructure

Operating income for our Water Infrastructure segment increased $69 million, or 21.7%, during 2021 as compared to the prior year, with operating margin also increasing from 15.3% to 17.2% or a total increase of 190 basis points. Operating margin expansion included favorable impacts of 70 basis points from a decrease in restructuring and realignment costs as compared to the prior year, as well as 780 basis points from favorable operating impacts, which were driven by a 410 basis point increase related to cost reductions from our productivity, restructuring and other cost saving initiatives, a 160 basis point increase related to favorable volume and a 60 basis point increase due to price realization. Margin expansion was offset by negative impacts of 660 basis points driven by 340 basis points of cost inflation and by 180 basis points of increased spending on strategic investments. Excluding restructuring and realignment costs, adjusted operating income increased $53 million, or 15.3%, with adjusted operating margin increasing from 16.6% to 17.8%.

Per our discussion, the following detail is being provided to the Staff for clarity on the items not material for separate disclosure in the above discussion.

Below is a reconciliation of the favorable operating impacts for consolidated Operating Income Margin.

Total Favorable Operating Impacts

715 bps bps

Key Drivers Cited in MD&A

620 bps

Cost saving initiatives

390

Volume

140

Price realization

Remaining Smaller Items

95 bps

Cost of quality (warranty and rework charges)

Allowances for discounts, returns and credit losses

Inventory items (scrap, inventory reserves and physical inventory adjustments)

Other miscellaneous 5

Below is a reconciliation of the negative operating impacts for consolidated Operating Income Margin.

Total Negative Operating Impacts

615 bps

540 bps

Inflation

400

Strategic investments

75 bps

Product mix

Foreign exchange impact

Other miscellaneous 25

Below is a reconciliation of the favorable operating impacts for Water Infrastructure Operating Income Margin.

780 bps

630 bps

410

160

150 bps

Other miscellaneous 40

Below is a reconciliation of the negative operating impacts for Water Infrastructure Operating Income Margin.

660 bps

520 bps

340

180

140 bps

COVID-19 related impacts

Other miscellaneous 50

In response to the additional request noted above relating to prior comment 4, in future filings with the SEC, the Company will provide a quantified discussion in Results of Operations with respect to segment revenue for end market and application data. As discussed, geographical drivers below these levels are included to provide additional information but are not practical to quantify. See the updated discussion below using our Form 10-K filed on February 25, 2022 and our Water Infrastructure segment as illustrative examples of how the Company plans to disclose this information. We will apply a similar approach to all segments in future filings on Form 10-Q and 10-K.

Revenue

Water Infrastructure revenue increased $168 million, or 8.1%, to $2,247 million in 2021 (5.0% increase on a constant currency basis) compared to 2020. Revenue benefited from $65 million of foreign currency translation, with the change at constant currency coming entirely from organic growth of $103 million. Organic growth during the year was driven by the industrial end market with $109 million of organic growth across all of our major geographic regions, with particular strength across the emerging markets, especially in Africa where we had strong dewatering sales, and in Latin America, where prior year COVID-19 impacts caused significant project delays. Industrial also had strong growth in western Europe and Oceania from continued general industrial strength. Organic growth in the industrial end market was offset by $6 million of declines in the utility end market, driven by softness in the dewatering business in the U.S., and weakness in the emerging markets. These declines were partially offset by strength in western Europe, where operational spending and project execution was strong.

From an application perspective, our transport applications had $84 million in organic growth, including strong dewatering revenue growth of $37 million. Dewatering growth was driven by the emerging markets, where we experienced market recovery from COVID-19 impacts and strength in mining. Western Europe also contributed to growth with strong aftermarket parts and services revenue in western Europe. Transport growth in these regions was partially offset by weakness in the U.S. driven by declines in the dewatering construction market. Organic revenue from our treatment applications also contributed $19 million to the segment's growth during the year, driven by market recovery in western Europe, and project orders in the emerging markets, which were partially offset by the timing of project deliveries Latin America.

In response to the additional request noted above relating to prior comment 4, in future filings with the SEC, the Company will provide a quantified discussion in Results of Operations with respect to consolidated Selling, General and Administrative (“SG&A”) Expenses. See the updated discussion below using our Form 10-K filed on February 25, 2022 as an illustrative example of how the Company plans to disclose this information.

Selling, General and Administrative ("SG&A") Expenses

SG&A expenses increased by $36 million (increase of 3.1%) to 22.7% of revenue in 2021, as compared to 23.4% of revenue in 2020. Revenue growth was higher than SG&A increases resulting in a lower SG&A as a percentage of sales. Cost increases were driven by increased investments in strategic growth initiatives of approximately $35 million and inflation of approximately $30 million, partially offset by approximately $45 million of cost reductions from our productivity, restructuring and other cost saving initiatives.

Read in the reply ↗
In its next report

First report after the company's reply of 2022-09-20: 10-Q filed 2022-11-01 ↗, against the 10-Q filed 2022-05-04 ↗.

Tickdelta does not hold the text of both reports, so they are not compared here.

Exhibit 99.1, page 1
SEC asked (3)
We note your proposed revised disclosures in response to prior comment 7. Please further revise your discussion of the net income margin to include the basis point change in such measure, similar to that of your adjusted EBITDA margin.
Rest of the question

Please provide us with the proposed revised disclosures that you intend to include in future earnings releases in response to this matter as well as the segment discussion addressed in our prior comment. In addition, we note that you added adjusted EBITDA margin and the increase in such measure to your highlighted bullet points in your recent Form 8-K earnings release. Please confirm that to the extent you highlight any non-GAAP measures, you will also highlight the comparable GAAP measure with greater prominence. Refer to Question 102.10 of the non-GAAP C&DIs.

XYL answered
The Company respectfully acknowledges the Staff's comment. Consistent with Question 102.10 of the non-GAAP C&DIs, see the updated discussion below based on our response to prior comment 7 and the related Form 8-K furnished on May 4, 2022, using our Water Infrastructure segment as an illustrative example of how the Company will disclose this information as applicable in future press releases furnished on Form 8-K.

Form 8-K furnished May 4, 2022

Xylem generated net income of $82 million, or $0.45 per share. Net income margin decreased 50 basis points to 6.4 percent.
Rest of the answer

Xylem generated adjusted net income of $84 million, or $0.47 per share, which excludes the impact of restructuring, realignment and special charges. First quarter adjusted earnings before interest, tax, depreciation and amortization (EBITDA) margin decreased 290 basis points to 14.2 percent.

First Quarter Segment Results

• First quarter reported operating income for the segment was $74 million. Adjusted operating income for the segment, which excludes $1 million of restructuring and realignment, was $75 million, roughly flat versus the comparable period last year. Reported operating margin for the segment was 13.9 percent, flat versus the prior year, and adjusted operating margin was 14.1 percent, down 80 basis points versus the prior year. Adjusted EBITDA margin was 15.9 percent, down 140 basis points from the prior year. Strong price realization and productivity benefits were more than offset by inflation and investments.

The Company also acknowledges the Staff's additional comment on the Form 8-K furnished on August 2, 2022. Consistent with Question 102.10 of the non-GAAP C&DIs, see the updated discussion below as an illustrative example of how the Company will disclose this information as applicable in future press releases furnished on Form 8-K.

Xylem Reports Second Quarter 2022 Results

•Robust continuing demand drove strong organic orders growth: 1% on a reported basis, 6% organically

•Revenue of $1.4 billion, up 1% on a reported basis, up 6% organically

•Earnings per share of $0.62, adjusted earnings per share of $0.66

•Net income margin of 8%, adjusted EBITDA margin exceeded guidance by 160 basis points

Further, we confirm that in any future applicable disclosures furnished on Form 8-K, to the extent we highlight non-GAAP measures, we will also highlight the comparable GAAP measure with greater prominence.

We would be pleased to discuss any of the foregoing responses to the extent you require further clarification or additional information. Please feel free to contact Sandy Rowland at sandy.rowland@xylem.com or myself at geri.mcshane@xylem.com or by phone at (914) 323-5700.

Read in the reply ↗
In its next report

First report after the company's reply of 2022-09-20: 10-Q filed 2022-11-01 ↗, against the 10-Q filed 2022-05-04 ↗.

Tickdelta does not hold the text of both reports, so they are not compared here.

Also in this review: request for more time, 2022-09-06, closing letter, 2022-09-22

Form 10-K for the Year Ended December 31, 2019

2020-03-26 to 2020-04-13 · 2 questions · 1 letter from the SEC, 1 from the company
Review closed 2020-04-13
RevenueNon-GAAP measuresLiquidity and cash
Note 1. Summary of Significant Accounting Policies · Revenue Recognition, page 57
SEC asked (1)
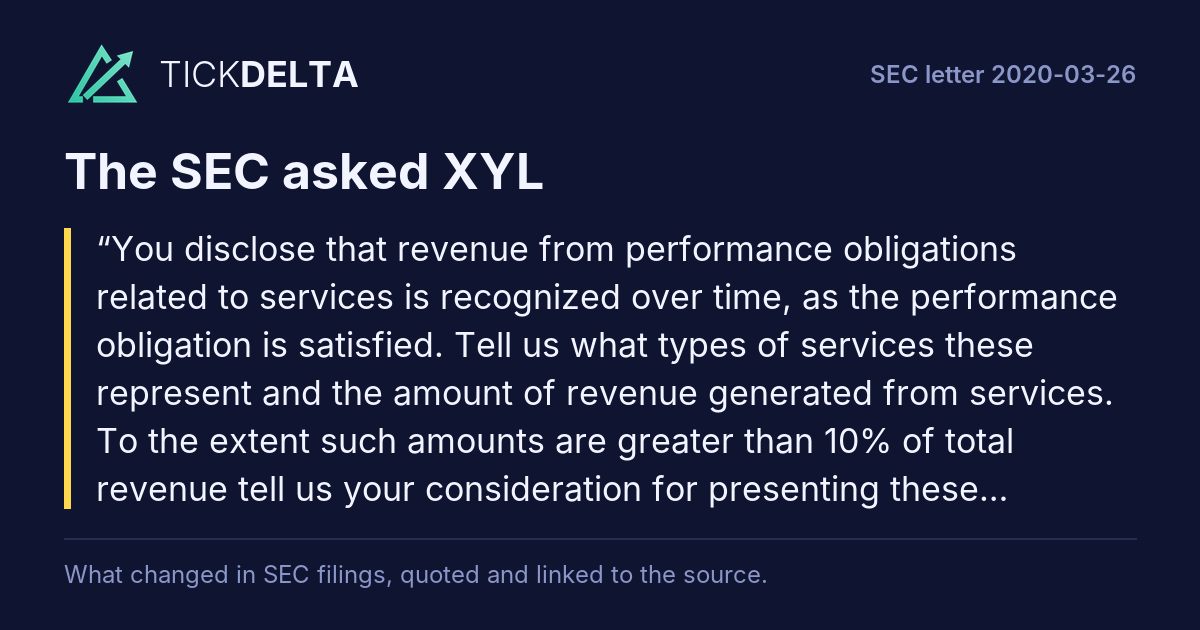
You disclose that revenue from performance obligations related to services is recognized over time, as the performance obligation is satisfied. Tell us what types of services these represent and the amount of revenue generated from services. To the extent such amounts are greater than 10% of total revenue tell us your consideration for presenting these separately on the income statement.
Rest of the question

Refer to Rule 5-03 of Regulation S-X.

XYL answered
Revenues from services represented approximately 7% ($373 million), 7% ($378 million), and 5% ($251 million) of the Company’s total revenue for the years ended December 31, 2019, 2018, and 2017, respectively. These revenues from services represent the satisfaction of performance obligations primarily related to maintenance, repair, and inspection services and software as a service ("SaaS") subscriptions.

In considering Rule 5-03 of Regulation S-X, revenues from services are less than 10% of total revenue and are not separately stated on the face of the Consolidated Income Statements.
Rest of the answer

We will continue to assess the percentages attributable to the relevant subcaptions in Rule 5-03, and to the extent relevant subcaption revenue exceeds 10% of total revenue in the future, we will modify the presentation accordingly.

Read in the reply ↗
In its next report

First report after the company's reply of 2020-04-08: 10-Q filed 2020-05-05 ↗, against the 10-Q filed 2019-10-31 ↗.

Tickdelta does not hold the text of both reports, so they are not compared here.

Exhibit 99.1
SEC asked (2)
We note your disclosure of the non-GAAP measure Free cash flow conversion. Please revise to also present the most directly comparable GAAP measure with equal or greater prominence to the non-GAAP measure. Further, disclose why management believes the presentation of this non-GAAP measure provides useful information to investors and, to the extent material, a statement disclosing the additional purposes, if any, for
Rest of the question

which management uses the non-GAAP measure. Refer to Item 10(e)(1)(i) of Regulation S-K. In closing, we remind you that the company and its management are responsible for the accuracy and adequacy of their disclosures, notwithstanding any review, comments, action or absence of action by the staff.

XYL answered
to the Staff's comment, in future filings the Company will present net cash from operating activities and net cash from operating activities as a percentage of net income (“Operating Cash Flow Conversion”), which we consider to be the most directly comparable GAAP measures, with equal or greater prominence to the non-GAAP measures of Free Cash Flow and Free Cash Flow Conversion, respectively.
Rest of the answer

Please see the updated applicable language and non-GAAP reconciliation table below using our Form 8-K filed on February 6, 2020 as a representation of how we plan on displaying this information.

Xylem reports fourth quarter and full-year 2019 earnings

•

Full-year 2019 reported net income of $401 million or $2.21 per share; adjusted full-year net income of $547 million or $3.02 per share

Full-year operating cash flow conversion was 209%; free cash flow conversion was 124%

Fourth quarter 2019 reported net income was $118 million or $0.65 per share; adjusted net income of $161 million or $0.89 per share

Announces 8% increase in cash dividend, representing the company’s ninth consecutive annual dividend increase

Provides 2020 organic revenue growth guidance range of 1% to 3% and adjusted earnings per share range of $2.96 to $3.16

RYE BROOK, N.Y., February 6, 2020 - Xylem Inc. (NYSE: XYL), a leading global water technology company dedicated to solving the world’s most challenging water issues, today reported full-year 2019 revenue of $5.25 billion, up one percent on a reported basis and four percent on an organic basis. Full-year reported net income was $401 million, or $2.21 per share, with a reported operating margin of 9.3 percent. Adjusted net income, which excludes the impact of restructuring, realignment and special charges, was $547 million, or $3.02 per share. Adjusted earnings before interest, tax, depreciation and amortization (EBITDA) was 19.5 percent, flat year-over-year. Xylem delivered full-year 2019 adjusted operating margin of 13.9 percent, up 20 basis points versus the prior year. Net cash from operating activities was $839 million, and operating cash flow conversion was 209 percent. The Company generated $613 million in free cash flow, representing a 124 percent conversion.

…

Xylem Inc. Non-GAAP Reconciliation

Net Cash - Operating Activities vs. Free Cash Flow

($ Millions)

Year Ended

2019

2018

Net Cash - Operating Activities

$

839

586

Capital Expenditures

(226

)

(237

Free Cash Flow

613

349

Cash paid for Sensus acquisition related costs

—

(1

Free Cash Flow, excluding Sensus Acquisition Related Costs

350

Net Income

401

549

Gain/(Loss) from sale of businesses

Special Charges - non-cash impairment

(158

(2

Significant deferred tax benefit/(charge)

Net Income, excluding gain on sale of businesses, non-cash impairment charges and significant deferred tax items

494

467

Operating Cash Flow Conversion

209

%

107

Free Cash Flow Conversion

124

Management believes the presentation of free cash flow conversion is useful information for investors evaluating our operating performance for the periods presented, providing a tool to evaluate our ongoing operations, liquidity and management of assets. This information can assist investors in assessing our financial performance and measuring our ability to both repay debt and deploy capital for strategic initiatives, including but not limited to, dividends, acquisitions and share repurchases.

Free cash flow conversion and the metrics listed in the “Non-GAAP Measures” section of our 8-K are used by management to evaluate our business and make financial, operating and planning decisions. This information is included in the “Non-GAAP Measures” section within our Form 8-K filings as shown below.

Additionally, going forward, the Company will include the non-GAAP measure Free Cash Flow Conversion in the "Non-GAAP Measures" section when this measure is presented in the Company’s SEC filings. Please see below for how the Company plans on presenting the Free Cash Flow Conversion non-GAAP measure using our Form 8-K filed on February 6, 2020 as an example:

Xylem Inc. Non-GAAP Measures

Management reviews key performance indicators including revenue, gross margins, segment operating income and margins, orders growth, working capital and backlog, among others. In addition, we consider certain non-GAAP (or "adjusted") measures to be useful to management and investors evaluating our operating performance for the periods presented, and to provide a tool for evaluating our ongoing operations, liquidity and management of assets. This information can assist investors in assessing our financial performance and measures our ability to generate capital for deployment among competing strategic alternatives and initiatives, including but not limited to, dividends, acquisitions, share repurchases and debt repayment. Excluding revenue, Xylem provides guidance only on a non-GAAP basis due to the inherent difficulty in forecasting certain amounts that would be included in GAAP earnings, such as discrete tax items, without unreasonable effort. These adjusted metrics are consistent with how management views our business and are used to make financial, operating and planning decisions. These metrics, however, are not measures of financial performance under GAAP and should not be considered a substitute for revenue, operating income, net income, earnings per share (basic and diluted) or net cash from operating activities as determined in accordance with GAAP. We consider the following items to represent non-GAAP measures as well as the related reconciling items to the most directly comparable measure calculated and presented in accordance with GAAP. The non-GAAP measures may not be comparable to similarly titled measures reported by other companies, to be key performance indicators:

“Free Cash Flow” defined as net cash from operating activities, as reported in the Statement of Cash Flow, less capital expenditures as well as adjustments for other significant items that impact current results which management believes are not related to our ongoing operations and performance, and "Free Cash Flow Conversion" defined as Free Cash Flow divided by net income, excluding gain on sale of businesses, non-cash impairment charges and significant deferred tax items. Our definitions of "free cash flow" and "free cash flow conversion" do not consider certain non-discretionary cash payments, such as debt.

We would be pleased to discuss any of the foregoing responses to the extent you require further clarification or additional information. Please feel free to contact E. Mark Rajkowski at mark.rajkowski@xyleminc.com or myself at geri.mcshane@xyleminc.com or by phone at (914) 323-5700.
Read in the reply ↗
In its next report

First report after the company's reply of 2020-04-08: 10-Q filed 2020-05-05 ↗, against the 10-Q filed 2019-10-31 ↗.

Tickdelta does not hold the text of both reports, so they are not compared here.

Also in this review: closing letter, 2020-04-13

Form 10-K for the Fiscal Year Ended December 31, 2016

2017-12-11 to 2017-12-21 · 2 questions · 1 letter from the SEC, 1 from the company
Review closed 2017-12-21
Non-GAAP measuresKey metricsResults discussion (MD&A)Acquisitions
Operations · Key Performance Indicators and Non-GAAP Measures, page 27
SEC asked (1)
Your computation of EBITDA on page 29 excludes share-based compensation in addition to taxes, depreciation and amortization. In future filings please revise the title of this non-GAAP measure to distinguish it from EBITDA. Refer to Question 103.01 of the updated Non-GAAP Compliance and Disclosure Interpretations.
XYL answered
to the Staff's comment, beginning with the 2017 Form 10-K filing, the Company will exclude share-based compensation from the computation of EBITDA rather than revising the title of the measure to distinguish it from EBITDA in future filings. Share-based compensation will instead be included as an adjustment in the reconciliation of EBITDA to the non-GAAP measure "Adjusted EBITDA" in future filings.
Rest of the answer

Please see the updated EBITDA and "Adjusted EBITDA" definitions and corresponding table below as a representation of how we plan on displaying this information within the Key Performance Indicators and Non-GAAP Measures section of our Form 10-K for the Fiscal Year Ended December 31, 2017:

▪

“EBITDA” defined as earnings before interest, taxes, depreciation, and amortization expense and “Adjusted EBITDA” reflects the adjustment to EBITDA to exclude share-based compensation, restructuring and realignment costs, Sensus acquisition related costs, special charges and gain from sale of business.

(in millions)

2017

2016

2015

Net Income

$

—

260

340

Income tax expense

Interest expense (Income), net

Depreciation

Amortization

EBITDA

559

589

Share-based compensation

Restructuring and realignment

Sensus acquisition related costs

Special charges

Gain from sale of business

(9

Read in the reply ↗
In its next report

First report after the company's reply of 2017-12-20: 10-K filed 2018-02-23 ↗, against the 10-K filed 2017-02-23 ↗.

Tickdelta does not hold the text of both reports, so they are not compared here.

Results of Operations, page 31
SEC asked (2)
In future filings, please revise your reconciliation of Operating expenses excluding restructuring and realignment costs, Sensus acquisition related costs and special charges to Total operating expenses to begin with the GAAP measure, rather than the non-GAAP measure. Refer to Question 102.10 of the updated Non-GAAP Compliance and Disclosure Interpretations.
XYL answered
to the Staff's comment, in future filings, the Company will revise the reconciliation of Operating expenses to begin with the GAAP measure, rather than the Non-GAAP measure. Please see the table below as a representation of how we plan on displaying this information within the Results of Operations table beginning with the filing of our Form 10-K for the Fiscal Year Ended December 31, 2017:

Results of Operations

2017 v. 2016

2016 v.
Rest of the answer

2015

Revenue

3,771

3,653

(100.0)%

3.2%

Gross profit

1,461

1,404

4.1%

Gross margin

%

38.7

38.4

(3,870)bp

30bp

Total operating expenses

1,055

955

10.5%

Expense to revenue ratio

28.0

26.1

(2,800)bp

190bp

Restructuring and realignment costs

(47

(20

135.0%

Sensus acquisition related charges

(53

(5

NM

Operating expenses excluding restructuring and realignment costs, Sensus acquisition related costs and special charges

950

930

2.2%

25.2

25.5

(2,520)bp

(30)bp

Operating income

406

449

(9.6)%

Operating margin

10.8

12.3

(1,080)bp

(150)bp

Interest and other non-operating expense (income), net

20.0%

#DIV/0!

27.0%

Tax rate

23.5

15.6

(2,350)bp

790bp

Net income

(23.5)%

NM Not Meaningful

In connection with the Company’s response to your comments, the Company acknowledges that:

• the Company is responsible for the adequacy and accuracy of the disclosure in its filings;

Staff comments or changes to disclosure in response to Staff comments do not foreclose the Commission from taking any action with respect to the filing; and the Company may not assert Staff comments as a defense in any proceeding initiated by the Commission or any person under federal securities law of the Untied States.

We would be pleased to discuss any of the foregoing responses to the extent you require further clarification or additional information. Please feel free to contact E. Mark Rajkowski at (914) 323-5950 or myself at (914) 323-5784.

Read in the reply ↗
In its next report

First report after the company's reply of 2017-12-20: 10-K filed 2018-02-23 ↗, against the 10-K filed 2017-02-23 ↗.

Tickdelta does not hold the text of both reports, so they are not compared here.

Also in this review: closing letter, 2017-12-21

3 other letters: notices that a filing will not be reviewed, requests to declare a registration effective, and the like

From the SEC's correspondence on EDGAR: staff letters (form UPLOAD) and company letters (form CORRESP), 25 letters filed since 2017-12-11. Questions and answers are matched by their numbers; topics come from words in each question. The reports are compared word for word (same form, before the first SEC letter against the first report after the company's reply). No AI.

Work on XYL in a spreadsheet: Excel workbook (a sheet per section, ten years by column, charts, links to the filings) · CSV. For a Google Sheet that stays up to date, paste =IMPORTDATA("https://tickdelta.com/company/XYL/export.csv") into a cell.