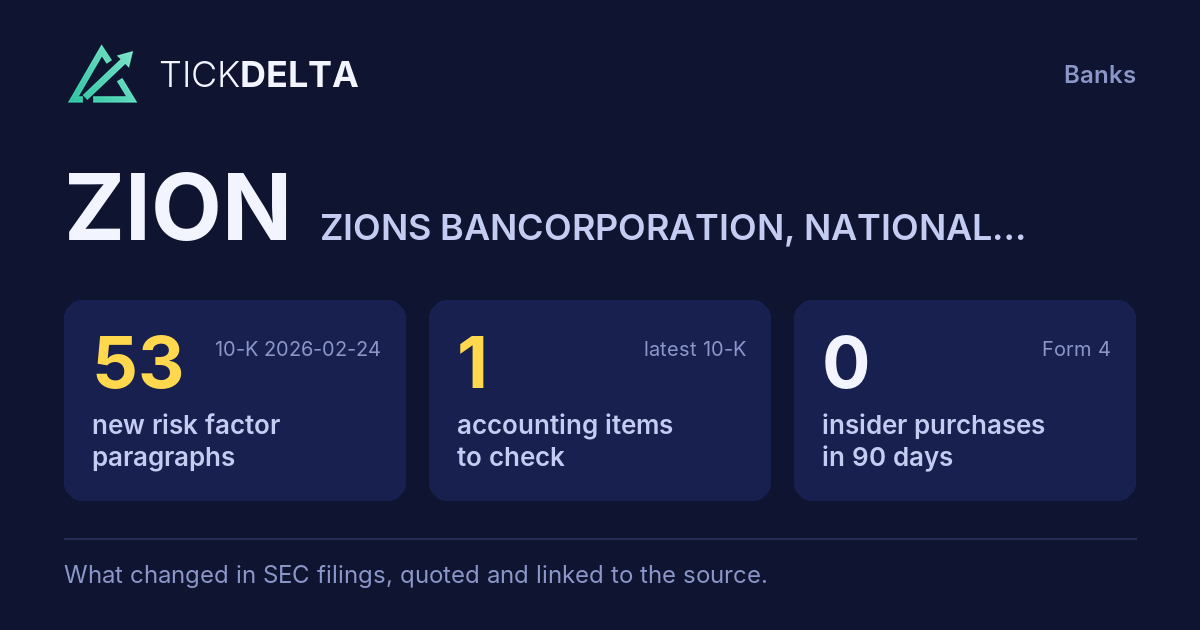
Paragraph 3 · 49% changed
Every version of it
Screener
/
SEC EDGAR
/CIK 0000109380
/10-K filed Feb 24, 2026, compared with Feb 25, 2025
/Numbers from the XBRL of the 10-Ks
Nasdaq
Financials · Banks
Zions Bancorporation, National Association ZION
The 10-K against last year's
660 changes: 129 added, 83 removed, 445 reworded, 3 quiet changes
10-K Feb 24, 2026 vs Feb 25, 2025
Risk Factors
60.5%
of the text changed · 7,221 words now · 53 new paragraphs, 29 gone
MD&A
39.4%
of the text changed · 19,468 words now · 76 new paragraphs, 54 gone
Legal Proceedings
32.5%
of the text changed · 1,051 words now
Accounting Policies
23.8%
of the text changed · 1,093 words now
10-K 0000109380-26-000046 (Feb 24, 2026) vs 10-K 0000109380-25-000040 (Feb 25, 2025)
Every paragraph, and how much of it changed
One bar per paragraph, in the order of the 10-K. Height and colour show the share of its words not in the closest paragraph a year earlier; the tallest bars are new paragraphs.
Risk Factors
124 paragraphs · 53 new · 71 reworded · 29 gone · 10-K Feb 24, 2026 against Feb 25, 2025
New paragraph
Reworded (5% of its words or more)
Same or nearly
Paragraph 88 · 48% changed
Every version of it
Regulators, federal and state legislatures, the current administration, the U.S. Congress, state legislatures, and other governing or consultative advisory bodies continue to enact implement rules, laws, and policies to regulate the that affect financial services industry institutions and public companies, including laws that companies. These measures are designed often intended to promote, protect, restrict, or penalize certain particular activities or industries and industries, thereby influencing their access to financial services. We are, and may in the future become, subject to these laws by offering our products and services to certain industries or in certain locations. The nature of these laws and regulations and their effect on our future business and performance cannot be predicted.
Paragraph 40 · 48% changed
Every version of it
Our ability to remain competitive increasingly depends on maintaining critical robust technological capabilities, capabilities and continuously identifying and developing new, innovative, value-added products for existing both current and future prospective customers. These technological competitive Competitive pressures in technology arise from both traditional banking and nontraditional sources. Larger banks may have often benefit from greater resources and economies of scale for maintaining existing scale, enabling them to maintain advanced capabilities and developing accelerate the development or adopting adoption of digital and other emerging technologies. Fintechs and other technology platform companies continue to emerge and compete with traditional financial institutions across a wide variety of products and services. Experimentation with, and adoption of, artificial intelligence, quantum computing, the expansion of blockchain technologies and digital currencies, including the potential creation and adoption of central bank digital currencies, as well as the increasing use and mainstream acceptance of such digital currencies, may fundamentally change the business of banking and present similar risks.
Paragraph 113 · 48% changed
Every version of it
Paragraph 38 · 48% changed
Every version of it
Paragraph 111 · 48% changed
Every version of it
Any of the risks described outlined in this the Risk Factors section may give rise result in harm to adverse publicity our business and other expressions of brands, including negative publicity, unfavorable public opinion, perception, increased regulatory scrutiny, and damaged relationships among deterioration of stakeholder relationships, or other reputational risks. adverse effects.
Paragraph 68 · 47% changed
Every version of it
We rely heavily extensively on communications and information systems to conduct support our business. Our business operations. These systems process and maintain information that is store confidential, proprietary, personal, or otherwise sensitive, sensitive data, including financial and other confidential business information. We, our customers, and Like other financial institutions with which institutions, we interact, and our customers are subject to ongoing, continuous attempts by persistent and increasingly sophisticated cyber threats from a range of threat actors, such as including organized cybercrime, cybercriminals, hackers, and state-sponsored organizations, to penetrate key systems. Information security risks for us and other large financial institutions have increased significantly in recent years, partly due to the organizations. The proliferation of new technologies, including artificial intelligence, the ubiquity of advanced technologies—such as AI—alongside widespread internet connections, connectivity and the increased sophistication and of the activities of threat actors. actors has significantly heightened information security risks across the financial services industry.
Paragraph 60 · 47% changed
Every version of it
For information regarding risks associated with the replacement or upgrades of our related to technology systems, system enhancements, see “Strategic and Business Risk” in Risk Factors on page 16. For information about how we manage technology risk, see “Operational, Technology, and Cybersecurity Risk Management” in MD&A on page 76. 17.
Paragraph 3 · 49% changed
Every version of it
10-K Feb 25, 2025We have developed comprehensive policies, procedures, and controls to address these risks. However, we cannot guarantee that our actions will effectively prevent or mitigate the impact of these risks on our business or performance. Although not comprehensive, below we describe some of our material risk factors.
10-K Feb 24, 2026
In the “Risk Management” section in MD&A on page 56, we describe certain policies, procedures, and internal controls designed to identify, assess, and manage these risks. However, despite these measures, we cannot guarantee that all risks will be effectively prevented or mitigated, nor can we eliminate their potential impact on our operations or financial performance.
Paragraph 88 · 48% changed
Every version of it
10-K Feb 25, 2025
Regulators, the U.S. Congress, state legislatures, and other governing or consultative bodies continue to enact rules, laws, and policies to regulate the financial services industry and public companies, including laws that are designed to promote, protect, or penalize certain activities or industries and their access to financial services. We are, and may in the future become, subject to these laws by offering our products and services to certain industries or in certain locations. The nature of these laws and regulations and their effect on our future business and performance cannot be predicted.
10-K Feb 24, 2026
Regulators, federal and state legislatures, the current administration, the U.S. Congress, and other governing or advisory bodies continue to implement rules, laws, and policies that affect financial institutions and public companies. These measures are often intended to promote, restrict, or penalize particular activities or industries, thereby influencing their access to financial services.
Paragraph 40 · 48% changed
Every version of it
10-K Feb 25, 2025
Our ability to remain competitive increasingly depends on maintaining critical technological capabilities, and identifying and developing new, value-added products for existing and future customers. These technological competitive pressures arise from both traditional banking and nontraditional sources. Larger banks may have greater resources and economies of scale for maintaining existing capabilities and developing or adopting digital and other technologies. Fintechs and other technology platform companies continue to emerge and compete with traditional financial institutions across a wide variety of products and services. Experimentation with, and adoption of, artificial intelligence, quantum computing, the expansion of blockchain technologies and digital currencies, including the potential creation and adoption of central bank digital currencies, as well as the increasing use and mainstream acceptance of such digital currencies, may fundamentally change the business of banking and present similar risks.
10-K Feb 24, 2026
Our ability to remain competitive increasingly depends on maintaining robust technological capabilities and continuously identifying and developing innovative, value-added products for both current and prospective customers. Competitive pressures in technology arise from traditional banking and nontraditional sources. Larger banks often benefit from greater resources and economies of scale, enabling them to maintain advanced capabilities and accelerate the development or adoption of digital and emerging technologies.
Paragraph 113 · 48% changed
Every version of it
10-K Feb 25, 2025Wars, international trade policies and disputes, and other geopolitical conflicts in recent years, have created increasing risks for global markets, trade, economic conditions, cybersecurity, and similar concerns. For example, these conflicts have affected and could continue to affect the availability and price of commodities and products, adversely affecting supply chains and increasing inflationary pressures; the value of currencies, interest rates, and other components of financial markets; and lead to increased risks of events such as cyberattacks that could result in severe costs and disruptions to governmental entities and companies and their operations. The impact of these conflicts and retaliatory measures is continually evolving and cannot be predicted with certainty. It is likely that these conflicts will continue to affect the global political order and global and domestic markets for a substantial period of time.
10-K Feb 24, 2026
Recent geopolitical tensions—including wars, international trade disputes, and evolving global conflicts—have introduced heightened risks to global markets, trade dynamics, economic stability, and cybersecurity. These developments have affected, and may continue to affect, the availability and pricing of commodities and products, thereby disrupting supply chains and contributing to inflationary pressures. Additionally, they have affected currency valuations, interest rates, and other financial market indicators, while increasing the likelihood of cyberattacks that could result in significant costs and operational disruptions for governments and businesses alike. The impact of these conflicts and any retaliatory actions remains fluid and unpredictable. We expect that such geopolitical instability will continue to affect the global political landscape and exert influence over both international and domestic markets for the foreseeable future.
Paragraph 38 · 48% changed
Every version of it
10-K Feb 25, 2025In July 2024, we successfully completed the final phase of our multi-year project to replace our core loan and deposit banking systems. We continue to invest in a variety of strategic projects designed to enhance our products and services and simplify our business operations. These initiatives and other significant changes are ongoing and at various stages of completion. By their nature, projections regarding duration, cost, expected savings, expected efficiencies, and related items are subject to change and significant variability. There is no certainty that we will achieve the expected benefits or other intended results associated with these projects.
10-K Feb 24, 2026
We continue to invest in a variety of strategic initiatives designed to enhance our product and service offerings while simplifying business operations. These initiatives include organizational restructuring, efficiency enhancements, and the replacement or upgrading of technology systems. These initiatives, along with other significant changes, remain ongoing and are at varying stages of development. Due to the inherent complexity of such projects, estimates related to timelines, costs, anticipated savings, operational efficiencies, and other potential outcomes are subject to change and may vary significantly. Accordingly, there can be no assurance that the expected benefits or intended results of these initiatives will be realized.
Paragraph 111 · 48% changed
Every version of it
10-K Feb 25, 2025
Any of the risks described in this section may give rise to adverse publicity and other expressions of negative public opinion, increased regulatory scrutiny, and damaged relationships among other reputational risks.
10-K Feb 24, 2026
Any of the risks outlined in the Risk Factors section may result in harm to our business and brands, including negative publicity, unfavorable public perception, increased regulatory scrutiny, deterioration of stakeholder relationships, or other adverse effects.
Paragraph 68 · 47% changed
Every version of it
10-K Feb 25, 2025
We rely heavily on communications and information systems to conduct our business. Our systems process and maintain information that is confidential, proprietary, personal, or otherwise sensitive, including financial and other confidential business information. We, our customers, and other financial institutions with which we interact, are subject to ongoing, continuous attempts by threat actors, such as organized cybercrime, hackers, and state-sponsored organizations, to penetrate key systems. Information security risks for us and other large financial institutions have increased significantly in recent years, partly due to the proliferation of new technologies, including artificial intelligence, the ubiquity of internet connections, and the increased sophistication and activities of threat actors.
10-K Feb 24, 2026
We rely extensively on communications and information systems to support our business operations. These systems process and store confidential, proprietary, personal, or otherwise sensitive data, including financial and other confidential business information. Like other financial institutions, we and our customers are subject to persistent and increasingly sophisticated cyber threats from a range of threat actors, including organized cybercriminals, hackers, and state-sponsored organizations. The proliferation of advanced technologies—such as AI—alongside widespread internet connectivity and increased sophistication of the activities of threat actors has significantly heightened information security risks across the financial services industry.
Paragraph 60 · 47% changed
Every version of it
10-K Feb 25, 2025
For information regarding risks associated with the replacement or upgrades of our technology systems, see “Strategic and Business Risk” in Risk Factors on page 16. For information about how we manage technology risk, see “Operational, Technology, and Cybersecurity Risk Management” in MD&A on page 76.
10-K Feb 24, 2026
For risks related to technology system enhancements, see “Strategic and Business Risk” in Risk Factors on page 17.
MD&A
347 paragraphs · 76 new · 209 reworded · 54 gone · 10-K Feb 24, 2026 against Feb 25, 2025
New paragraph
Reworded (5% of its words or more)
Same or nearly
Paragraph 240 · 50% changed
Paragraph 22 · 50% changed
•Noninterest expense decreased $51 increased $92 million, or 2%. Deposit insurance and regulatory expense decreased $78 million, largely 4%. primarily due to a $90 million accrual associated higher salaries and employee benefits, along with the FDIC special assessment during the prior year. This decrease was partially offset by increases in other noninterest expenses, marketing and business development costs, and technology, telecom, and information processing expense, expenses. The increase in marketing and salaries and employee benefits expense. The efficiency ratio business development expense was 64.2%, compared with 62.9%, largely due to an increase in adjusted noninterest expense. a $15 million contribution to our charitable foundation, which will fund donations over the next three years that otherwise would have been nondeductible under recent tax law changes effective January 1, 2026. These increases were partially offset by lower deposit insurance and regulatory expenses.
Paragraph 16 · 49% changed
•Net interest income remained relatively flat, as higher earning asset yields were offset increased $197 million, or 8%, compared with the prior year period. This growth was primarily driven by higher lower funding costs. Net interest income was also impacted by increases costs and favorable shifts in the composition of average interest-earning assets and interest-bearing liabilities. The assets. As a result, the net interest margin (“NIM”) decreased slightly improved to 3.00%, 3.21%, compared with 3.02%. 3.00%.
Paragraph 174 · 49% changed
December 31, 2025 December 31, 2024 December 31, 2023 (Dollar amounts in millions) Amount % of total Nonaccrual loans Amount % of Nonaccrual loans total Amount change Percent change CRE loans CRE loans Commercial real estate: Construction and land development total Mortgage credit intermediaries $ 2,774 20.6% 352 17.6% $ 2,669 20.0% $105 3.9% Term 10,703 79.4 10,702 80.0 9 $ 559 23.8% $ — Business credit intermediaries 1 968 48.4 — 489 20.8 1 Private equity funds 121 6.1 — 189 8.0 — Consumer credit intermediaries 303 15.2 — 349 14.8 — Other financial institutions 1 253 12.7 1 767 32.6 — Total commercial real estate NDFI portfolio $ 13,477 1,997 100.0% $ 13,371 10 $ 2,353 100.0% $106 0.8 $ 1
Paragraph 308 · 49% changed
Total shareholders’ equity increased $433 million, $1.1 billion, or 8%, 17%, to $7.2 billion at December 31, 2025, compared with $6.1 billion at December 31, 2024, 2024. In 2025, we repurchased 0.8 million common shares outstanding for $41 million, compared with $5.7 billion at December 31, 2023. This increase was largely driven by higher retained earnings. Preferred 0.9 million common shares repurchased for $36 million in 2024. These amounts include shares acquired under both our publicly announced program and in connection with our stock decreased $374 compensation plan. In January 2026, we publicly announced a plan to repurchase up to $75 million due to the redemption of the common shares outstanding shares of our Series G, I, and J preferred stock during the fourth first quarter of 2024. The redemption resulted in a one-time reduction to net earnings applicable to common shareholders of approximately $6 million, arising from the recognition of capitalized preferred stock issuance costs. 2026.
Paragraph 88 · 48% changed
Paragraph 212 · 48% changed
Paragraph 230 · 48% changed
Paragraph 240 · 50% changed
10-K Feb 25, 20253 Fair value asset hedges consist of pay-fixed swaps hedging fixed-rate AFS securities and fixed-rate commercial loans, as further discussed in Note 7 of the Notes to Consolidated Financial Statements. Increasing notional amounts in 2026 are due to forward starting swaps.
10-K Feb 24, 2026
4 Fair value hedges of assets consist of pay-fixed swaps that hedge fixed-rate AFS securities and fixed-rate commercial loans.
Paragraph 22 · 50% changed
10-K Feb 25, 2025
•Noninterest expense decreased $51 million, or 2%. Deposit insurance and regulatory expense decreased $78 million, largely due to a $90 million accrual associated with the FDIC special assessment during the prior year. This decrease was partially offset by increases in technology, telecom, and information processing expense, and salaries and employee benefits expense. The efficiency ratio was 64.2%, compared with 62.9%, due to an increase in adjusted noninterest expense.
10-K Feb 24, 2026
•Noninterest expense increased $92 million, or 4%. primarily due to higher salaries and employee benefits, along with increases in other noninterest expenses, marketing and business development costs, and technology, telecom, and information processing expenses. The increase in marketing and business development expense was largely due to a $15 million contribution to our charitable foundation, which will fund donations over the next three years that otherwise would have been nondeductible under recent tax law changes effective January 1, 2026. These increases were partially offset by lower deposit insurance and regulatory expenses.
Paragraph 16 · 49% changed
10-K Feb 25, 2025
•Net interest income remained relatively flat, as higher earning asset yields were offset by higher funding costs. Net interest income was also impacted by increases in average interest-earning assets and interest-bearing liabilities. The net interest margin (“NIM”) decreased slightly to 3.00%, compared with 3.02%.
10-K Feb 24, 2026
•Net interest income increased $197 million, or 8%, compared with the prior year period. This growth was primarily driven by lower funding costs and favorable shifts in the composition of average interest-earning assets. As a result, the net interest margin (“NIM”) improved to 3.21%, compared with 3.00%.
Paragraph 174 · 49% changed
10-K Feb 25, 2025
December 31, 2024 December 31, 2023 (Dollar amounts in millions) Amount % of total Amount % of total Amount change Percent change CRE loans CRE loans Commercial real estate: Construction and land development $ 2,774 20.6% $ 2,669 20.0% $105 3.9% Term 10,703 79.4 10,702 80.0 1 — Total commercial real estate $ 13,477 100.0% $ 13,371 100.0% $106 0.8
10-K Feb 24, 2026
December 31, 2025 December 31, 2024 (Dollar amounts in millions) Amount % of Nonaccrual loans Amount % of Nonaccrual loans total total Mortgage credit intermediaries $ 352 17.6% $ 9 $ 559 23.8% $ — Business credit intermediaries 1 968 48.4 — 489 20.8 1 Private equity funds 121 6.1 — 189 8.0 — Consumer credit intermediaries 303 15.2 — 349 14.8 — Other financial institutions 1 253 12.7 1 767 32.6 — Total NDFI portfolio $ 1,997 100.0% $ 10 $ 2,353 100.0% $ 1
Paragraph 308 · 49% changed
10-K Feb 25, 2025
Total shareholders’ equity increased $433 million, or 8%, to $6.1 billion at December 31, 2024, compared with $5.7 billion at December 31, 2023. This increase was largely driven by higher retained earnings. Preferred stock decreased $374 million due to the redemption of the outstanding shares of our Series G, I, and J preferred stock during the fourth quarter of 2024. The redemption resulted in a one-time reduction to net earnings applicable to common shareholders of approximately $6 million, arising from the recognition of capitalized preferred stock issuance costs.
10-K Feb 24, 2026
Total shareholders’ equity increased $1.1 billion, or 17%, to $7.2 billion at December 31, 2025, compared with $6.1 billion at December 31, 2024. In 2025, we repurchased 0.8 million common shares outstanding for $41 million, compared with 0.9 million common shares repurchased for $36 million in 2024. These amounts include shares acquired under both our publicly announced program and in connection with our stock compensation plan. In January 2026, we publicly announced a plan to repurchase up to $75 million of common shares outstanding during the first quarter of 2026.
Paragraph 88 · 48% changed
10-K Feb 25, 2025We conduct our operations primarily through seven separately managed and geographically defined affiliates, each with its own local branding and management teams. These affiliate banks are supported by an enterprise operating segment (referred to as the “Other” segment) that provides governance and risk management, allocates capital, establishes strategic objectives, and includes centralized technology, back-office functions, and certain lines of business not operated through our affiliate banks.
10-K Feb 24, 2026
As described under Item 1. Business on page 5, we manage our operations through seven affiliate banks—Zions Bank, CB&T, Amegy, NBAZ, NSB, Vectra, and TCBW—which constitute our primary operating segments. Each affiliate operates in distinct geographic markets under its own local brand and management team. The affiliate banks are supported by an enterprise‑level “Other” segment, which provides governance and risk oversight, capital allocation, strategic objectives, centralized technology infrastructure, back‑office operations, and certain business lines that are not managed through the affiliate structure.
Paragraph 212 · 48% changed
10-K Feb 25, 2025At December 31, 2024, approximately 92% of our HECL portfolio was still in the draw period, and about 22% of those loans were scheduled to begin amortizing within the next five years. We believe the risk of loss and borrower default in the event of a loan becoming fully amortizing and the effect of significant interest rate changes is low, given the rate shock analysis performed at origination. The ratio of HECL net charge-offs (recoveries) for the trailing twelve months to average balances at December 31, 2024 and December 31, 2023, was 0.00% and 0.05%, respectively. See Note 6 of the Notes to Consolidated Financial Statements for additional information on the credit quality of the HECL portfolio.
10-K Feb 24, 2026
The ratio of HECL net charge-offs (recoveries) for the trailing twelve months to average balances was 0.01% at December 31, 2025, compared with 0.00% at December 31, 2024. For additional information regarding the credit quality of the HECL portfolio, see Note 6 of the Notes to Consolidated Financial Statements.
Paragraph 230 · 48% changed
10-K Feb 25, 2025We also assume a correlation, referred to as a “deposit beta,” with respect to interest-bearing deposits, wherein the rates paid to customers change at a different pace compared with changes in average benchmark interest rates. Generally, certificates of deposit are assumed to have a high correlation, while interest-bearing checking accounts are assumed to have a lower correlation.
10-K Feb 24, 2026
Our deposit-behavior models incorporate assumptions about the correlation between the rates paid on interest-bearing deposits and fluctuations in average benchmark interest rates. This is commonly referred to as “deposit beta.” Certificates of deposit are typically modeled with a higher degree of correlation, whereas interest-bearing checking accounts are assumed to exhibit a lower sensitivity to rate changes.
A paragraph is matched with the one last year that shares the most of its words; under half in common makes it new. The paragraphs shown are the 8 reworded the most in each section.
The paragraph that changed most in each section
The redline
Marked against last year's 10-K: cut words struck through, new words highlighted.
Risk Factors175 words changed in this paragraph; it is 43% similar to last year's version.
We are subject to the income tax laws of in the U.S., its individual states, and other jurisdictions where in which we conduct business. operate. These laws are inherently complex and subject open to different varying interpretations by the taxpayer both taxpayers and the various taxing authorities. In determining the provision for our income taxes, tax provision, management makes exercises judgments and relies on estimates about the application of these inherently complex laws, to interpret applicable statutes, related regulations, and case law. In the process of preparing our tax returns, management attempts While we strive to make apply reasonable interpretations of the tax laws. These interpretations are subject to challenge by the laws in preparing our tax authorities upon audit filings, these positions may be challenged during audits or to reinterpretation reassessed based on management’s ongoing assessment of facts evolving legal precedents and evolving case law. factual developments. Changes in tax laws, regulations, legislation, regulatory guidance, or case law judicial rulings may result in an adverse impact to adversely affect our effective tax rate, overall tax obligations, liabilities, and financial results. For example, provisions of the recently enacted One Big Beautiful Bill Act relating to charitable giving have affected the timing, deductibility, and amount of our contributions. Additionally, challenges made by adjustments resulting from tax authorities during an audit may result in adjustments to our tax return filings, resulting in similar adverse impacts to authority audits could negatively impact our financial position.
Source: Item 1A, 10-K 0000109380-26-000046 vs Item 1A, 10-K 0000109380-25-000040
MD&A154 words changed in this paragraph; it is 35% similar to last year's version.
Technology risk is refers to the risk of potential adverse impact on business operations and customers due to customer experience resulting from reduced or denied availability availability, or inadequate value delivery related to technology-related delivery, associated with technology applications, infrastructure, or processes. We To manage these risks, we make significant investments to enhance strengthen our technology capabilities and mitigate the risk address technical debt arising from outdated and unsupported technologies (technical debt). This includes systems. These efforts include updating core banking systems platforms and enterprise applications, as well as introducing new implementing innovative digital customer-facing capabilities. Technology projects, initiatives, and operations are governed by a change management framework that assesses activities and risk within our business processes to limit disruption and resource constraints. New, expanded, or modified products and services, as well as new lines of business, change initiatives, and other risks, are regularly reviewed and approved by the Change, Initiatives, and Technology Committee. This Committee includes senior executives such as the Chief Executive Officer, Chief Financial Officer, Chief Operating Officer, Chief Technology and Operations Officer, and Chief Risk Officer. Initiative risk and change impact from the framework are reported to the ROC. solutions for customer engagement.
Source: Item 7, 10-K 0000109380-26-000046 vs Item 7, 10-K 0000109380-25-000040
Accounting Policies88 words changed in this paragraph; it is 68% similar to last year's version.
Certain PEIs and venture capital securities are accounted for under the equity method of accounting when we can have the ability to exercise significant influence over the investee's operating and financial policies. Equity investments in PEIs that do not grant significant influence are reported at fair value, unless value when readily determinable. If a readily determinable fair value in unavailable. In such cases, is not available, we have elected to measure PEIs apply a measurement alternative allowed under GAAP, which records the investment at cost, less adjusted for impairment (if any), plus or minus and observable price changes from in identical or similar investments of the same issuer, referred to as the “measurement alternative.” issuer. Periodic impairment reviews assessments are conducted by comparing carrying values with amounts to estimated fair value estimates. values. Changes in fair value, impairment losses, and realized gains and or losses from sales are included in “Securities gains (losses), net” on the consolidated statement of income. BOLI is measured at fair value based on the cash surrender values (“CSVs”) of the underlying general account insurance policies.
Source: Item 8, Note 1 – SUMMARY OF SIGNIFICANT ACCOUNTING POLICIES, 10-K 0000109380-26-000046 vs Item 8, Note 1 – SUMMARY OF SIGNIFICANT ACCOUNTING POLICIES, 10-K 0000109380-25-000040
Legal Proceedings79 words changed in this paragraph; it is 66% similar to last year's version.
Source: Item 3, via Note 16 – COMMITMENTS, GUARANTEES, CONTINGENT LIABILITIES, AND RELATED PARTIES, 10-K 0000109380-26-000046 vs Item 3, via Note 16 – COMMITMENTS, GUARANTEES, CONTINGENT LIABILITIES, AND RELATED PARTIES, 10-K 0000109380-25-000040
Sentences and paragraphs added, removed or reworded
Every change, by type
Sentences and paragraphs of ZION's Risk Factors and MD&A, 10-K Feb 24, 2026 against 10-K Feb 25, 2025. Each links to the text at sec.gov.
Quiet changes are sentences kept from last year with one to four words changed, at least one of them a hedge, a modal or a qualifier (may, could, will, not, significant, material…). A year or date rolling forward is not counted.
The full word list
adverse, adversely, all, although, anticipate, anticipates, any, approximately, believe, believes, can, cannot, certain, could, expect, expects, generally, however, if, intend, intends, largely, likely, many, material, materially, may, might, most, must, never, no, not, possible, primarily, probable, should, significant, significantly, some, substantial, substantially, unlikely, will, would
AddedRisk Factors
Our ability to generate revenue and expand our business is inherently linked to the prudent and strategic management of risk. These risks are comprehensively defined within our Risk Management Framework, which serves as the foundation for our enterprise-wide approach to risk oversight.
Read it in 10-K Feb 24, 2026 at sec.gov
AddedRisk Factors
Although not comprehensive, the following sections outline the significant risk factors that could affect our business.
Read it in 10-K Feb 24, 2026 at sec.gov
AddedRisk Factors
Adverse economic conditions could negatively affect our performance and overall financial condition.
Read it in 10-K Feb 24, 2026 at sec.gov
AddedRisk Factors
Additionally, external factors such as tariffs, export controls, sanctions, restrictive immigration policies, elevated unemployment, civil unrest, and other political or trade-related developments affecting domestic and global markets may heighten economic uncertainty. Collectively, these conditions could lead to reduced loan demand, higher credit losses, and lower fee income, among other adverse effects.
Read it in 10-K Feb 24, 2026 at sec.gov
AddedRisk Factors
Fluctuations in the availability and sources of liquidity and capital could restrict our operational flexibility and constrain future growth opportunities.
Read it in 10-K Feb 24, 2026 at sec.gov
AddedRisk Factors
We also rely on our investment securities portfolio as a source of contingent liquidity through cash flows, maturities, and secured borrowing capacity. The portfolio consists of instruments that can be readily pledged or converted to cash and is managed to support our asset‑liability profile by helping to mitigate interest rate mismatches between loans and deposits. Any unexpected changes in portfolio runoff, market valuations, or the availability of secured borrowing markets could adversely affect our liquidity position and the effectiveness of our asset‑liability management strategies.
Read it in 10-K Feb 24, 2026 at sec.gov
AddedRisk Factors
available. Furthermore, changes to FHLB or Federal Reserve funding programs could adversely affect our liquidity and the effectiveness of our risk management efforts.
Read it in 10-K Feb 24, 2026 at sec.gov
AddedRisk Factors
Challenges experienced by other financial institutions could negatively impact the broader financial markets and, in turn, indirectly have an adverse effect on our operations.
Read it in 10-K Feb 24, 2026 at sec.gov
Show the other 67
AddedRisk Factors
Events in the financial services industry during 2023 illustrated this dynamic. A number of regional and community banks experienced deposit outflows and heightened liquidity pressures, which in turn contributed to broad market concerns about the financial condition and creditworthiness of other institutions. These developments resulted in—and similar occurrences may again result in—significant and cascading disruptions across financial markets and the deposit environment, increased operating costs, reduced fee income, and increased volatility and downward pressure on the market value of our common stock.
Read it in 10-K Feb 24, 2026 at sec.gov
AddedRisk Factors
We may face challenges in attracting and retaining qualified personnel or effectively fostering our corporate culture. Additionally, recruiting and compensation costs may increase as a result of evolving workplace dynamics, market conditions, economic factors, and regulatory changes.
Read it in 10-K Feb 24, 2026 at sec.gov
AddedRisk Factors
Additionally, broader economic conditions and evolving workforce dynamics, including shifting employee priorities, regulatory expectations, increased geographic mobility, and the adoption of remote work models, may further challenge our talent retention efforts and contribute to increased compensation demands, associated costs, or other operational challenges. Moreover, inflationary pressures have led to increased compensation costs, a trend that is expected to persist and may continue to impact our financial performance. If we experience such adverse effects with respect to our employees, our business, financial condition, and results of operations could be adversely or materially impacted.
Read it in 10-K Feb 24, 2026 at sec.gov
AddedRisk Factors
We have undertaken, and continue to implement, significant initiatives to improve operating efficiency and strengthen our internal control environment. The ultimate success, timely completion, and overall impact of these efforts may differ significantly from expectations, and any such deviation could have a material adverse effect on our organization.
Read it in 10-K Feb 24, 2026 at sec.gov
RemovedRisk Factors
RemovedRisk Factors
RemovedRisk Factors
RemovedRisk Factors
RemovedRisk Factors
RemovedRisk Factors
RemovedRisk Factors
RemovedRisk Factors
RemovedRisk Factors
RemovedRisk Factors
RemovedRisk Factors
RemovedRisk Factors
RewordedRisk Factors
Unlike state corporate law, the National Bank Act requires shareholder approval of for all mergers between involving a national bank and another national or state bank and does not allow state-chartered bank, without providing exceptions for exceptions in the case of various certain “minor” mergers, such transactions—such as mergers between a parent company’s merger with company and its subsidiary, or transactions where an acquiring entity issues shares below a subsidiary or an acquirer’s merger with specified threshold to an unaffiliated entity in which the shares issued by the acquirer do not exceed a designated percentage. party.
Read it in 10-K Feb 24, 2026 at sec.gov
RewordedRisk Factors
These committees monitor various risk areas, such as credit, include credit risk, interest rate and market, liquidity, market risk, liquidity risk, strategic and business, operational, technology, cybersecurity, business risk, operational risk, technology risk, cybersecurity risk, capital/financial reporting, reporting risk, legal/compliance risk (including regulatory), regulatory risk), and reputational risks, as outlined in our risk taxonomy. risk.
Read it in 10-K Feb 24, 2026 at sec.gov
RewordedRisk Factors
Our ability to fully realize our deferred tax asset could the value of these assets may be reduced in the adversely affected if future if our estimates projections of future taxable income from our operations, future income, anticipated reversals of existing deferred tax liabilities (“DTLs”), or the effectiveness of tax planning strategies do not sufficiently support the realization of our deferred tax asset. their recoverability.
Read it in 10-K Feb 24, 2026 at sec.gov
RewordedRisk Factors
RewordedRisk Factors
RewordedRisk Factors
RewordedRisk Factors
RewordedRisk Factors
Compliance with these capital requirements may limit our ability to expand pursue expansion and has required, and may require, us to raise has, at times, required the retention of earnings or the issuance of additional capital or retain earnings that could might otherwise be have been distributed to shareholders.
Read it in 10-K Feb 24, 2026 at sec.gov
RewordedRisk Factors
These loans may be subject to specific exposures carry distinct risks, including governmental regulatory and social societal responses to environmental issues and climate change, climate-related concerns, commodity price volatility, and the potential for significant and prolonged sustained declines in collateral-values collateral values and activity levels. sector activity.
Read it in 10-K Feb 24, 2026 at sec.gov
RewordedRisk Factors
RewordedRisk Factors
RewordedRisk Factors
A slowing economy, combined economy—combined with inflationary pressures, changes in monetary and fiscal policies, rising policy, fluctuating interest rates, and declining values valuations of our fixed-rate assets, as well as tariffs, sanctions, and other policies and actions impacting domestic and global trade, assets—can amplify these risks.
Read it in 10-K Feb 24, 2026 at sec.gov
Quiet changesRisk Factors
We could may be adversely affected by risks related to accounting, financial reporting, and regulatory compliance.
Read it in 10-K Feb 24, 2026 at sec.gov
AddedMD&A
Our strategic objective is to achieve balanced growth in customers, pre‑tax net income, and shareholder returns. We provide a wide range of business products and related services to a broad customer base, which helps create balance, diversify risks, and support the communities we serve. While all business lines play an important role in generating long‑term value, our strategy is centered on five key growth areas: commercial banking, small business banking, capital markets, wealth management, and consumer banking.
Read it in 10-K Feb 24, 2026 at sec.gov
AddedMD&A
These growth areas are supported by six strategic enablers that guide effective execution across the organization:
Read it in 10-K Feb 24, 2026 at sec.gov
AddedMD&A
We allocate resources to achieve our growth and profitability objectives by delivering high‑quality products and services and by strengthening our customer relationships. Serving as a trusted advisor and supporting customers’ operational needs contributes to relatively stable deposits and ongoing relationship growth.
Read it in 10-K Feb 24, 2026 at sec.gov
AddedMD&A
Key strategic initiatives focus on supporting commercial customer growth, expanding small business lending, enhancing capital markets capabilities, broadening access to wealth management services, and strengthening consumer deposit relationships. Collectively, these initiatives are critical to sustaining long-term growth and stability.
Read it in 10-K Feb 24, 2026 at sec.gov
AddedMD&A
As previously described, we operate through seven separately managed affiliate banks supported by an enterprise‑level “Other” segment. This organizational model is central to achieving our strategic objectives by enabling local decision‑making and strong customer focus at the affiliate level, while maintaining disciplined governance, risk management, capital allocation, and shared technology and operations at the enterprise level.
Read it in 10-K Feb 24, 2026 at sec.gov
AddedMD&A
•Customer-related noninterest income increased $23 million, or 4%, primarily driven by higher retail and business banking fees, capital markets fees and income, and loan-related fees and income. Excluding the impact of net credit valuation adjustment (“CVA”), customer-related noninterest income increased $32 million, or 5%, benefiting from increased capital markets customer swap fee revenue and investment banking advisory fees.
Read it in 10-K Feb 24, 2026 at sec.gov
AddedMD&A
4 Excluding the $15 million charitable contribution, the efficiency ratio for 2025 would have been 62.2%.
Read it in 10-K Feb 24, 2026 at sec.gov
AddedMD&A
Net interest income increased $197 million, or 8%, relative to the same prior year period, primarily due to lower funding costs. The increase was further supported by a favorable shift in the composition of average interest-earning assets, reflecting growth in higher-yielding loans and a decline in lower-yielding securities and money market investments. As a result, the net interest margin improved to 3.21% in 2025, compared with 3.00% in 2024.
Read it in 10-K Feb 24, 2026 at sec.gov
AddedMD&A
Average deposits increased $113 million, or less than 1%, to $74.9 billion. Average interest-bearing deposits increased $52 million, while average noninterest-bearing deposits increased $61 million, representing 34% of total deposits in both 2025 and 2024.
Read it in 10-K Feb 24, 2026 at sec.gov
AddedMD&A
1 Effective the first quarter of 2025, capital markets fees and income include the net CVA, which was previously disclosed under noncustomer-related noninterest income as fair value and nonhedge derivative income.
Read it in 10-K Feb 24, 2026 at sec.gov
AddedMD&A
•Capital markets fees increased $6 million, or 5%. Excluding the impact of net CVA, capital markets fees and income increased $15 million, or 14%, benefiting from higher customer swap fee revenue and increased investment banking advisory fees.
Read it in 10-K Feb 24, 2026 at sec.gov
AddedMD&A
•Other noninterest expense increased $20 million, primarily due to higher subscription costs, success fee accrual adjustments related to SBIC investments, impairment of certain long-lived assets, and legal settlement reserves.
Read it in 10-K Feb 24, 2026 at sec.gov
RemovedMD&A
RemovedMD&A
RemovedMD&A
RemovedMD&A
RemovedMD&A
RemovedMD&A
RemovedMD&A
RemovedMD&A
RemovedMD&A
RemovedMD&A
RemovedMD&A
RemovedMD&A
RewordedMD&A
(Dollar amounts in millions) 2025 Amount change Percent change 2024 Amount change Percent change 2023 Amount change Percent change 2022 Commercial account fees $ 185 $ 3 2 % $ 182 $ 8 5 % $ 174 $ 15 9 % $ 159 Card fees 95 (1) (1) 96 (5) (5) 101 (3) (3) 104 Retail and business banking fees 75 8 12 67 1 2 66 (7) (10) 73 Loan-related fees and income 75 5 7 70 (9) (11) 79 (1) (1) 80 Capital markets fees and income 1 116 6 5 110 29 36 81 (2) (2) 83 33 43 77 Wealth management fees 57 (1) (2) 58 — — 58 3 5 55 Other customer-related fees 59 3 5 56 (5) (8) 61 1 2 60 Customer-related noninterest income 662 23 4 639 19 3 620 6 1 614 Fair value and nonhedge derivative income (loss) — 23 4 NM (4) (20) NM 16 616 Dividends and other income 44 2 5 42 (15) (26) 57 40 NM 17 Securities gains (losses), net 52 33 NM 19 15 NM 4 19 NM (15) Noncustomer-related noninterest income 96 35 57 61 4 7 57 39 — NM 18 61 Total noninterest income $ 758 $ 58 8 $ 700 $ 23 3 $ 677 Adjusted customer-related noninterest income 2 $ 45 7 671 $ 632 32 5 $ 639 $ 19 3 $ 620
Read it in 10-K Feb 24, 2026 at sec.gov
RewordedMD&A
Commercial 7,295 (30) — 7,325 (116) (2) 7,441 8,458 607 8 7,851 589 8 7,262 Commercial real estate 4,244 (98) 2,462 24 1 2,438 290 14 2,148 Consumer 3,545 (40) (1) 3,585 (2) 4,342 164 4 4,178 Consumer 3,040 530 21 2,510 243 11 2,267 — 3,587 Total loans 14,579 402 3 14,177 291 2 13,886 14,465 591 4 13,874 877 7 12,997 Total deposits 14,529 (505) (3) 15,034 263 2 14,771 15,319 (30) — 15,349 (42) — 15,391 CREDIT QUALITY Net loan and lease charge-offs (recoveries) $ 43 33 NM 5 1 25 $ 10 7 NM 4 (1) (20) $ 3 5 Ratio of net charge-offs (recoveries) to average loans and leases 0.30 0.04 % 0.07 0.03 % 0.02 0.04 % Allowance for credit losses $ 167 5 3 159 18 13 $ 162 40 33 141 2 1 $ 122 139 Ratio of allowance for credit losses to net loans and leases, at year end 1.17 1.12 % 1.15 1.05 % 0.93 1.08 % Nonperforming assets $ 101 19 23 58 (18) (24) $ 82 57 76 41 NM $ 25 35 Ratio of nonperforming assets to net loans and leases and other real estate owned 0.69 0.40 % 0.58 0.55 % 0.18 0.27 %
Read it in 10-K Feb 24, 2026 at sec.gov
RewordedMD&A
Commercial 7,295 (30) — 7,325 (116) (2) 7,441 1,307 88 7 1,219 151 14 1,068 Commercial real estate 4,244 (98) (2) 4,342 164 4 4,178 724 56 8 668 71 12 597 Consumer 3,040 530 21 2,510 243 11 2,267 67 3 5 64 (5) (7) 69 Total loans 14,579 402 3 14,177 291 2 13,886 2,098 147 8 1,951 217 13 1,734 Total deposits 14,529 (505) (3) 15,034 263 2 14,771 1,042 (132) (11) 1,174 69 6 1,105 CREDIT QUALITY Net loan and lease charge-offs (recoveries) $ 43 33 3 2 NM $ 10 7 1 1 NM $ 3 — Ratio of net charge-offs (recoveries) to average loans and leases 0.30 0.15 % 0.07 0.06 % 0.02 — % Allowance for credit losses $ 167 5 3 19 — — $ 162 40 33 19 8 73 $ 122 11 Ratio of allowance for credit losses to net loans and leases, at year end 1.17 0.95 % 1.15 1.05 % 0.93 0.65 % Nonperforming assets $ 101 19 23 $ 82 57 30 24 NM $ 25 6 (2) (25) $ 8 Ratio of nonperforming assets to net loans and leases and other real estate owned 0.69 1.43 % 0.58 0.31 % 0.18 0.46 %
Read it in 10-K Feb 24, 2026 at sec.gov
RewordedMD&A
Severance costs 16 3 14 1 Other real estate expense, net (2) (1) — 1 Amortization of core deposit and other intangibles 8 7 6 1 Restructuring costs — — 1 — SBIC investment success fee accrual 1 5 1 — (1) FDIC special assessment (11) 11 90 — Total adjustments (b) 16 21 111 2 Adjusted noninterest expense (non-GAAP) (c)=(a-b) $ 2,122 $ 2,025 $ 1,986 $ 1,876 Net interest income (GAAP) (d) $ 2,627 $ 2,430 $ 2,438 $ 2,520 Fully taxable-equivalent adjustments (e) 46 45 41 37 Taxable-equivalent net interest income (non-GAAP) (f)=(d+e) 2,673 2,475 2,479 2,557 Noninterest Customer-related noninterest income (GAAP) (g) 700 677 632 662 639 616 Net credit valuation adjustment (CVA) 1 (h) (9) — (4) Adjusted customer-related noninterest income (non-GAAP) (i)=(g-h) 671 639 620 Noncustomer-related noninterest income (GAAP) (j) 96 61 61 Securities gains (losses), net (k) 52 19 4 Adjusted noncustomer-related noninterest income (non-GAAP) (l)=(j-k) 44 42 57 Combined income (non-GAAP) (h)=(f+g) (m)=(f+g+j) $ 3,431 $ 3,175 $ 3,156 3,189 Adjustments: Adjusted taxable-equivalent revenue (non-GAAP) (n)=(f+i+l) 3,388 3,156 3,156 Pre-provision net revenue (non-GAAP) (m)-(a) $ 1,293 $ 1,129 $ 1,059 Adjusted PPNR (non-GAAP) (n)-(c) 1,266 1,131 1,170 Efficiency ratio (non-GAAP) 2 (c/n) 62.6 % 64.2 % 62.9 %
Read it in 10-K Feb 24, 2026 at sec.gov
RewordedMD&A
Commercial 7,295 (30) — 7,325 (116) (2) 7,441 2,530 34 1 2,496 (101) (4) 2,597 Commercial real estate 4,244 (98) 1,560 (172) (10) 1,732 (39) (2) 4,342 164 4 4,178 1,771 Consumer 3,040 530 21 2,510 243 11 2,267 1,501 85 6 1,416 157 12 1,259 Total loans 14,579 402 3 14,177 291 2 13,886 5,591 (53) (1) 5,644 17 — 5,627 Total deposits 14,529 (505) (3) 15,034 263 2 14,771 6,968 84 1 6,884 39 1 6,845 CREDIT QUALITY Net loan and lease charge-offs (recoveries) $ 43 33 3 2 NM $ 10 7 NM 1 — — $ 3 1 Ratio of net charge-offs (recoveries) to average loans and leases 0.30 0.05 % 0.07 0.02 % 0.02 % Allowance for credit losses $ 167 5 3 49 (24) (33) $ 162 40 33 73 19 35 $ 122 54 Ratio of allowance for credit losses to net loans and leases, at year end 1.17 0.88 % 1.15 1.28 % 0.93 1.02 % Nonperforming assets $ 101 19 23 14 4 40 $ 82 57 NM 10 (2) (17) $ 25 12 Ratio of nonperforming assets to net loans and leases and other real estate owned 0.69 % 0.58 0.25 % 0.18 % 0.21 %
Read it in 10-K Feb 24, 2026 at sec.gov
RewordedMD&A
Commercial 7,295 (30) — 7,325 (116) (2) 7,441 1,527 (175) (10) 1,702 (62) (4) 1,764 Commercial real estate 4,244 (98) (2) 4,342 164 4 4,178 692 (100) (13) 792 (150) (16) 942 Consumer 3,040 530 21 2,510 243 11 2,267 1,433 24 2 1,409 78 6 1,331 Total loans 14,579 402 3 14,177 291 2 13,886 3,652 (251) (6) 3,903 (134) (3) 4,037 Total deposits 14,529 (505) 3,490 (102) (3) 15,034 263 2 14,771 3,592 97 3 3,495 CREDIT QUALITY Net loan and lease charge-offs (recoveries) $ 43 33 NM 9 — — $ 10 9 7 NM $ 3 2 Ratio of net charge-offs (recoveries) to average loans and leases 0.30 0.23 % 0.07 0.22 % 0.02 0.05 % Allowance for credit losses $ 167 5 3 40 (1) (2) $ 162 40 33 41 (4) (9) $ 122 45 Ratio of allowance for credit losses to net loans and leases, at year end 1.17 1.04 % 1.15 1.01 % 0.93 1.12 % Nonperforming assets $ 101 19 23 17 (12) (41) $ 82 57 NM 29 13 81 $ 25 16 Ratio of nonperforming assets to net loans and leases and other real estate owned 0.69 0.47 % 0.58 0.74 % 0.18 0.40 %
Read it in 10-K Feb 24, 2026 at sec.gov
RewordedMD&A
Commercial 7,295 (30) — 7,325 (116) (2) 7,441 1,620 94 6 1,526 180 13 1,346 Commercial real estate 4,244 (98) (2) 4,342 164 4 4,178 770 (51) (6) 821 (30) (4) 851 Consumer 3,040 530 21 2,510 243 11 2,267 1,340 7 1 1,333 99 8 1,234 Total loans 14,579 402 3 14,177 291 2 13,886 3,730 50 1 3,680 249 7 3,431 Total deposits 14,529 (505) (3) 15,034 263 7,236 157 2 14,771 7,079 (60) (1) 7,139 CREDIT QUALITY Net loan and lease charge-offs (recoveries) $ 43 33 NM 3 (4) (57) $ 10 7 4 NM $ 3 Ratio of net charge-offs (recoveries) to average loans and leases 0.30 0.08 % 0.07 0.20 % 0.02 0.09 % Allowance for credit losses $ 167 5 3 46 (7) (13) $ 162 40 33 53 (13) (20) $ 122 66 Ratio of allowance for credit losses to net loans and leases, at year end 1.17 1.24 % 1.15 1.49 % 0.93 1.95 % Nonperforming assets $ 101 19 23 34 (8) (19) $ 82 57 NM 42 (4) (9) $ 25 46 Ratio of nonperforming assets to net loans and leases and other real estate owned 0.69 0.91 % 0.58 1.14 % 0.18 1.34 %
Read it in 10-K Feb 24, 2026 at sec.gov
RewordedMD&A
Commercial 7,295 (30) — 7,325 (116) 8,093 (162) (2) 7,441 8,255 (269) (3) 8,524 Commercial real estate 4,244 (98) (2) 4,342 164 2,961 178 6 2,783 62 2 2,721 Consumer 3,990 170 4 4,178 Consumer 3,040 530 21 2,510 243 11 2,267 3,820 278 8 3,542 Total loans 14,579 402 3 14,177 291 2 13,886 15,044 186 1 14,858 71 — 14,787 Total deposits 14,529 (505) (3) 15,034 263 2 14,771 21,155 (169) (1) 21,324 632 3 20,692 CREDIT QUALITY Net loan and lease charge-offs (recoveries) $ 43 33 8 11 NM $ 10 7 (3) (22) NM $ 3 19 Ratio of net charge-offs (recoveries) to average loans and leases 0.30 0.05 % 0.07 (0.02) % 0.02 0.13 % Allowance for credit losses $ 167 161 7 5 3 $ 162 40 33 154 (3) (2) $ 122 157 Ratio of allowance for credit losses to net loans and leases, at year end 1.17 1.07 % 1.15 1.04 % 0.93 1.10 % Nonperforming assets $ 101 19 23 $ 82 57 58 29 NM $ 25 29 3 12 $ 26 Ratio of nonperforming assets to net loans and leases and other real estate owned 0.69 0.39 % 0.58 0.20 % 0.18 %
Read it in 10-K Feb 24, 2026 at sec.gov
RewordedMD&A
(Dollar amounts in millions, except per share amounts) 2024/2023 Change 2025/2024 2025 2024 2023 2022 Change For the Year Net interest income —% 8% $ 2,627 $ 2,430 $ 2,438 $ 2,520 Noninterest income 3% 8% 758 700 677 632 Total net revenue —% 8% 3,385 3,130 3,115 3,152 Provision for credit losses (45)% —% 72 72 132 122 Noninterest expense (2)% 4% 2,138 2,046 2,097 1,878 Pre-provision net revenue 1 7% 15% 1,293 1,129 1,059 1,311 Adjusted pre-provision net revenue 1 (3)% 12% 1,266 1,131 1,170 1,312 Net income 15% 899 784 680 907 Net earnings applicable to common shareholders 14% 21% 895 737 648 878 Per Common Share Net earnings – diluted 14% 21% 6.01 4.95 4.35 5.79 Tangible book value at year-end 1 20% 21% 40.79 33.85 28.30 22.79 Market price – end 24% 8% 58.54 54.25 43.87 49.16 Market price – high 15% (4)% 60.77 63.22 55.20 75.44 Market price – low NM 4% 39.32 37.76 18.26 45.21 At Year-End Assets 2% —% 88,990 88,775 87,203 89,545 Loans and leases, net of unearned income and fees 3% 60,917 59,410 57,779 55,653 Deposits 2% (1)% 75,644 76,223 74,961 71,652 Common equity 15% 17% 7,114 6,058 5,251 4,453 Performance Ratios Return on average assets 1.00% 0.88% 0.77% 1.01% Return on average common equity 13.7% 13.1% 13.4% 16.0% Return on average tangible common equity 1 16.6% 16.2% 17.3% 19.8% Net interest margin 3.21% 3.00% 3.02% 3.06% Net charge-offs to average loans and leases 0.15% 0.10% 0.06% 0.07% Total allowance for credit losses to loans and leases outstanding 1.19% 1.25% 1.26% 1.14% Capital Ratios at Year-End Common equity Tier 1 capital 11.5% 10.9% 10.3% 9.8% Tier 1 leverage 9.0% 8.3% 8.3% 7.7% Tangible common equity 1 6.9% 5.7% 4.9% 3.8% Other Selected Information Weighted average diluted common shares outstanding —% 147,157 147,215 147,756 150,271 (in thousands) Bank common shares repurchased (in thousands) (6)% (16)% 747 890 947 3,563 Dividends declared 1% 6% $ 1.76 $ 1.66 $ 1.64 $ 1.58 Common dividend payout ratio 2 29.4% 33.6% 37.8% 27.3% Capital distributed as a percentage of net earnings applicable to common shareholders 3 34% 38% 46% 50% Efficiency ratio 1 1, 4 62.6% 64.2% 62.9% 58.8%
Read it in 10-K Feb 24, 2026 at sec.gov
RewordedMD&A
(Dollar amounts in millions) 2025 Amount change Percent change 2024 Amount change Percent change 2023 Amount change Percent change 2022 SELECTED INCOME STATEMENT DATA Net interest income $ 584 565 $ (18) (3) 69 14 % $ 602 496 $ 10 2 39 9 % $ 592 457 Provision for credit losses 42 (2) (5) 44 (5) (10) 49 8 (14) (64) 22 7 47 15 Noninterest income 121 5 4 116 2 2 114 189 14 8 175 (9) (5) 184 Noninterest expense 403 (8) (2) 411 71 21 340 465 9 2 456 3 1 453 Income (loss) before income taxes 260 (3) (1) 263 (54) (17) 317 281 88 46 193 20 12 173 SELECTED BALANCE SHEET DATA (at year end) Loans:
Read it in 10-K Feb 24, 2026 at sec.gov
RewordedMD&A
(Dollar amounts in millions) December 31, 2024 2025 December 31, 2023 Office CRE Construction and land development $ 115 $ 191 Term 1,697 1,793 Total office CRE $ 1,812 $ 1,984 2024 Credit quality metrics Criticized loan ratio 14.5 % 11.9 % 0.8% 5.5% Classified loan ratio 12.8 % 8.9 % 0.8% 5.5% Nonaccrual loan ratio 2.8 % 2.4 % 0.5% —% Delinquency ratio 1.4 % 2.3 % —% —% Ratio of office CRE NDFI net charge-offs 1 (recoveries) to average loans 0.3 % 0.2 % 2.7% —% Ratio of allowance for credit losses to office CRE NDFI loans, at period end 3.92 % 3.80 % Weighted average LTV for office term CRE loans 56 % 53 % 1.03% 0.64%
Read it in 10-K Feb 24, 2026 at sec.gov
RewordedMD&A
(Dollar amounts in millions) 2025 Amount change Percent change 2024 Amount change Percent change 2023 Amount change Percent change 2022 SELECTED INCOME STATEMENT DATA Net interest income $ 584 262 $ (18) (3) 17 7 % $ 602 245 $ 10 2 (4) (2) % $ 592 249 Provision for credit losses 42 (2) (5) 44 (5) (10) 49 (14) (31) NM 17 13 NM 4 Noninterest income 121 5 4 116 44 1 2 2 114 43 3 8 40 Noninterest expense 403 (8) (2) 411 71 21 340 195 (1) (1) 196 2 1 194 Income (loss) before income taxes 260 (3) (1) 263 (54) (17) 317 125 50 67 75 (16) (18) 91 SELECTED BALANCE SHEET DATA (at year end) Loans:
Read it in 10-K Feb 24, 2026 at sec.gov
Quiet changesMD&A
We are subject to the Basel III capital requirements, which include certain specific minimum regulatory capital ratios.
Read it in 10-K Feb 24, 2026 at sec.gov
Quiet changesMD&A
This asymmetrical accounting creates treatment can create volatility in AOCI and equity.
Read it in 10-K Feb 24, 2026 at sec.gov
Sources
The two latest 10-Ks on EDGAR, section by section. Each change links to the text at sec.gov.
Also
New risk factors: paragraphs with nothing like them last year, quoted in full.
Work with it
Excel workbook · CSV. Google Sheet that stays up to date: paste =IMPORTDATA("https://tickdelta.com/company/ZION/export.csv") into a cell.