Enerpac Tool Group Corp EPAC
Enerpac Tool Group Corp. is a premier industrial tools, services, technology, and solutions provider serving a broad and diverse set of customers and end markets for mission-critical applications in more than 100 countries. 10-K, Item 1
- Headquarters
- Milwaukee, WI
- CEO
- Paul Sternlieb
- Next results
- around Dec 16, 2026
Where each dollar of revenue went, FY2026
Revenue of $652.3M through the costs to a net profit of $89.7M · income statement of the 10-K
EPAC among Industrials peers
Six ratios from the latest 10-K. Each corner is the share of 251 peers the company is above, not a score.
What changed
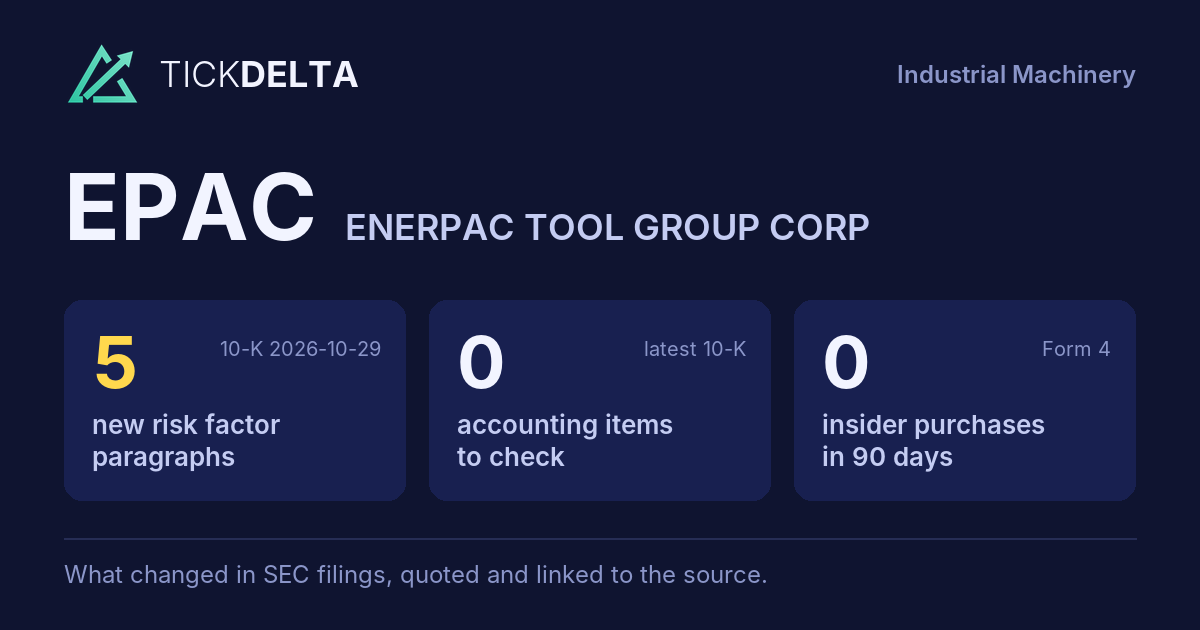
5 new risk paragraphs. 10-K filed Oct 29, 2026 against Oct 17, 2025.
Each row opens the detail with the quote and the filing. A row is a change worth reading, not a verdict.
Accounting checks
11 checks on the latest 10-K. Checks, not verdicts.
0facts worth reading about all 11 checks found nothing to note
-
Receivables +6.5% ($106.1M to $113.0M) vs revenue +5.7% ($616.9M to $652.3M), +0.8 pts apart
-
Cash from operations $130.2M vs net income $89.7M (FY ending Aug 31, 2026)
-
Inventory -10.3% ($78.8M to $70.7M) vs revenue +5.7% ($616.9M to $652.3M), -16.0 pts apart
8 more checks with nothing to note
-
Same auditor in both 10-Ks: Ernst & Young LLP
-
No statement of substantial doubt about going concern
-
No 8-K item 4.02 in the last 2 years
-
No NT 10-K or NT 10-Q in the last 2 years
-
No longer listed: Valuation of the potential earn-out and acquired intangible assets
-
No sentence in the 10-K concludes that controls were not effective because of a material weakness
-
No 8-K item 2.06 in the last 2 years
-
No 8-K item 1.03 in the last 2 years
In their words
5 paragraphs in Risk Factors that were not in the 10-K filed Oct 17, 2025. Quoted as filed.
-
Item 1A · new paragraph · not in the 10-K filed Oct 17, 2025 10-K, ITEM 1A
We may not be able to consummate desired acquisitions, which could materially impact our growth rate, results of operations, future cash flows and stock price. Our ability to achieve our goals depends upon, among other things, our ability to identify and successfully acquire companies, businesses and product lines, and to effectively…
New risk paragraphs, against peers
Latest 10-K of each, Industrials companies closest in revenue
Paragraphs in Risk Factors with nothing like them in the company's 10-K the year before. A count of text, not of risk.
Financial performance
Last 4 fiscal years · 10-K XBRL
| Metric | FY2023 | FY2024 | FY2025 | FY2026 |
|---|---|---|---|---|
| Revenue | $598.2M | $589.5M | $616.9M | $652.3M |
| Net income | $46.6M | $85.7M | $92.7M | $89.7M |
| Operating cash flow | $77.6M | $81.3M | $111.3M | $130.2M |
| Free cash flow | $68.2M | $69.9M | $92.0M | $119.6M |
Revenue, FY2017 to FY2026
Ten fiscal years, each from its own 10-K · XBRL · USD
$652.3M ▲ 5.7% in FY2026$89.7M ▼ 3.2% in FY2026$119.6M ▲ 30.0% in FY2026
Recent filings
8 filings in the last 30 days · SEC EDGAR
-
8-KNov 4, 2026Regulation FD disclosure 8-K item 7.01
-
Planned saleNov 2, 2026Topercer Benjamin James (Officer) gave notice of a planned sale of 4,800 shares worth about $198K Form 144, approximate sale date Nov 2, 2026, under a 10b5-1 plan adopted Apr 1, 2026
-
10-KOct 29, 2026Annual report (10-K) period ended Aug 31, 2026
-
8-KOct 28, 2026Material agreement signed 8-K item 1.01
-
8-KOct 28, 2026Acquisition or sale of assets completed, Regulation FD disclosure, Other events 8-K items 2.01, 7.01, 8.01
About the company
Enerpac Tool Group Corp, Milwaukee, WI · from the 10-K filed Oct 29, 2026
Enerpac Tool Group Corp. is a premier industrial tools, services, technology, and solutions provider serving a broad and diverse set of customers and end markets for mission-critical applications in more than 100 countries. Enerpac Tool Group's businesses are global leaders in providing high pressure hydraulic tools, controlled force products and solutions for precise positioning of heavy loads that help customers safely and reliably tackle some of the most challenging jobs around the world. The Company was founded in 1910 and is headquartered in Milwaukee, Wisconsin. The Company has one reportable segment, the Industrial Tools & Services (“IT&S”) Segment.
- Headquarters
- Milwaukee, WI
- Country
- United States
- Reports in
- USD
- Listed on
- NYSE
- Fiscal year ends
- August 31
- Last results
- Oct 28, 2026
- Incorporated in
- WI
Email alerts
Sources
The 10-K filed Oct 29, 2026 (open at SEC), compared with the 10-K filed Oct 17, 2025. Numbers from the XBRL of the 10-Ks; filings from SEC EDGAR.
Work with it: Excel workbook · CSV. Google Sheet that stays up to date: paste =IMPORTDATA("https://tickdelta.com/company/EPAC/export.csv") into a cell.