Agilysys Inc AGYS
- Employees
- 2,413
- Headquarters
- Alpharetta, GA
- CEO
- Ramesh Srinivasan
- Next results
- around Jan 25, 2027
Where each dollar of revenue went, FY2026
Revenue of $319.3M through the costs to a net profit of $38.8M · income statement of the 10-K
AGYS among Technology peers
Six ratios from the latest 10-K. Each corner is the share of 230 peers the company is above, not a score.
What changed
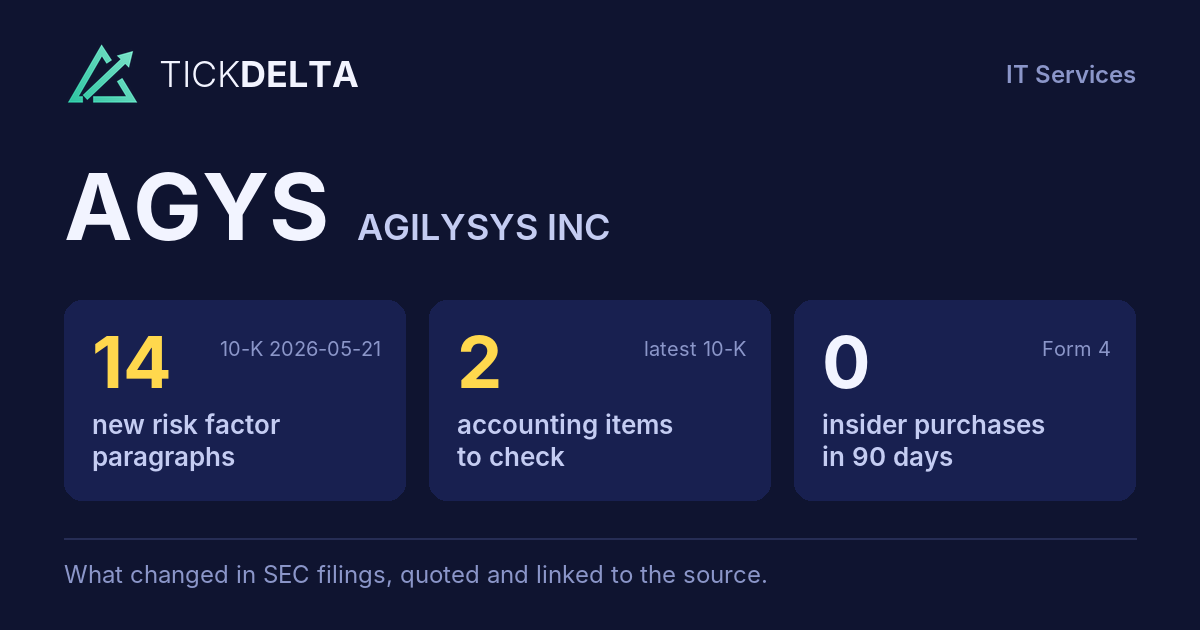
14 new risk paragraphs and 2 accounting facts worth reading about. 10-K filed May 21, 2026 against May 23, 2025.
Each row opens the detail with the quote and the filing. A row is a change worth reading, not a verdict.
Accounting checks
10 checks on the latest 10-K. Checks, not verdicts.
2facts worth reading about the other 8 checks found nothing to note
-
Receivables growing faster than revenueReceivables +36.6% ($31.5M to $43.1M) vs revenue +15.9% ($275.6M to $319.3M), +20.8 pts apart
-
Inventory growing faster than revenueInventory +45.5% ($5.2M to $7.5M) vs revenue +15.9% ($275.6M to $319.3M), +29.7 pts apart
-
Cash from operations $70.0M vs net income $38.8M (FY ending Mar 31, 2026)
7 more checks with nothing to note
-
Same auditor in both 10-Ks: GRANT THORNTON LLP
-
No statement of substantial doubt about going concern
-
No 8-K item 4.02 in the last 2 years
-
No NT 10-K or NT 10-Q in the last 2 years
-
No sentence in the 10-K concludes that controls were not effective because of a material weakness
-
No 8-K item 2.06 in the last 2 years
-
No 8-K item 1.03 in the last 2 years
In their words
14 paragraphs in Risk Factors that were not in the 10-K filed May 23, 2025. Quoted as filed.
-
Item 1A · new paragraph · not in the 10-K filed May 23, 2025 10-K, ITEM 1A
We use AI in our platform and product offerings, and our success is dependent upon our ability to leverage data, develop competitive products, and manage related risks. We utilize AI solutions both for internal productivity purposes and in products and services available to our customers. We also work with partners who have incorporated…
-
Item 1A · new paragraph · not in the 10-K filed May 23, 2025 10-K, ITEM 1A
We have integrated AI and machine learning features into our technology stack to improve guest analytics, demand forecasting, and automated workflows, among other things. These models are complex and their efficacy depends on the quality of the data used for training. If the underlying data is flawed, or if the AI models experience…
-
Item 1A · new paragraph · not in the 10-K filed May 23, 2025 10-K, ITEM 1A
Our solutions are primarily delivered through multi-tenant cloud architectures in which multiple customers are served through shared environments. Although we employ controls designed to logically segregate customer data, any failure, vulnerability, or misconfiguration could result in unauthorized access to or exposure of one customer’s…
-
Item 1A · new paragraph · not in the 10-K filed May 23, 2025 10-K, ITEM 1A
The global regulatory landscape surrounding AI is rapidly evolving and remains highly uncertain. We are subject to emerging privacy and data protection mandates, which may impose stringent requirements on how we develop and deploy AI models. Compliance with these regulations requires substantial financial resources and management…
New risk paragraphs, against peers
Latest 10-K of each, Technology companies closest in revenue
Paragraphs in Risk Factors with nothing like them in the company's 10-K the year before. A count of text, not of risk.
Financial performance
Last 4 fiscal years · 10-K XBRL
| Metric | FY2023 | FY2024 | FY2025 | FY2026 |
|---|---|---|---|---|
| Revenue | $198.1M | $237.5M | $275.6M | $319.3M |
| Net income | $14.6M | $86.2M | $23.2M | $38.8M |
| Operating cash flow | $34.5M | $48.2M | $55.1M | $70.0M |
| Free cash flow | $27.2M | $40.1M | $52.3M | $68.1M |
Revenue, FY2016 to FY2026
Ten fiscal years, each from its own 10-K · XBRL · USD
$319.3M ▲ 15.9% in FY2026$38.8M ▲ 67.0% in FY2026$68.1M ▲ 30.2% in FY2026
Recent filings
4 filings in the last 30 days · SEC EDGAR
-
Planned saleNov 2, 2026Wood William David III (Officer) gave notice of a planned sale of 961 shares worth about $111K Form 144, approximate sale date Nov 2, 2026, under a 10b5-1 plan adopted Jun 12, 2026
-
Planned saleOct 26, 2026Ramesh Srinivasan (President and Chief Executive Officer) ended a 10b5-1 trading plan reported in the 10-Q, up to 133,447 shares, runs to Aug 27, 2026
-
8-KOct 26, 2026Quarterly results 8-K item 2.02
-
10-QOct 26, 2026Quarterly report (10-Q) period ended Sep 30, 2026
About the company
Agilysys Inc, Alpharetta, GA · from the 10-K filed May 21, 2026
Agilysys has been a leader in hospitality software for more than 45 years, delivering innovative cloud-native SaaS and on-premise solutions for hotels, multi-amenity resorts, cruise lines, casinos, corporate foodservice management, restaurants, universities, stadiums, and healthcare facilities. The Company’s software solutions include point-of-sale (POS), property management (PMS), inventory and procurement, payments, and related applications that manage and enhance the entire guest journey. Agilysys is also known for its world-class customer-centric service.
- Headquarters
- Alpharetta, GA
- Country
- United States
- Reports in
- USD
- Listed on
- Nasdaq
- Fiscal year ends
- March 31
- Last results
- Oct 26, 2026
- Incorporated in
- DE
Employees, at the top of the page: "As of March 31, 2026, we employed approximately 2,413 employees, with approximately 70%, 26%, 3%, and 1% of our employees located in India, North America, Asia-Pacific, and EMEA, respectively" (10-K). Address and exchange: SEC's company file.
Email alerts
Sources
The 10-K filed May 21, 2026 (open at SEC), compared with the 10-K filed May 23, 2025. Numbers from the XBRL of the 10-Ks; filings from SEC EDGAR.
Work with it: Excel workbook · CSV. Google Sheet that stays up to date: paste =IMPORTDATA("https://tickdelta.com/company/AGYS/export.csv") into a cell.