Esco Technologies Inc ESE
- Headquarters
- St. Louis, MO
- CEO
- Bryan H. Sayler
- Next results
- around Nov 19, 2026
Where each dollar of revenue went, FY2025
Revenue of $1.1B through the costs to a net profit of $299.2M · income statement of the 10-K
ESE among Technology peers
Six ratios from the latest 10-K. Each corner is the share of 230 peers the company is above, not a score.
What changed
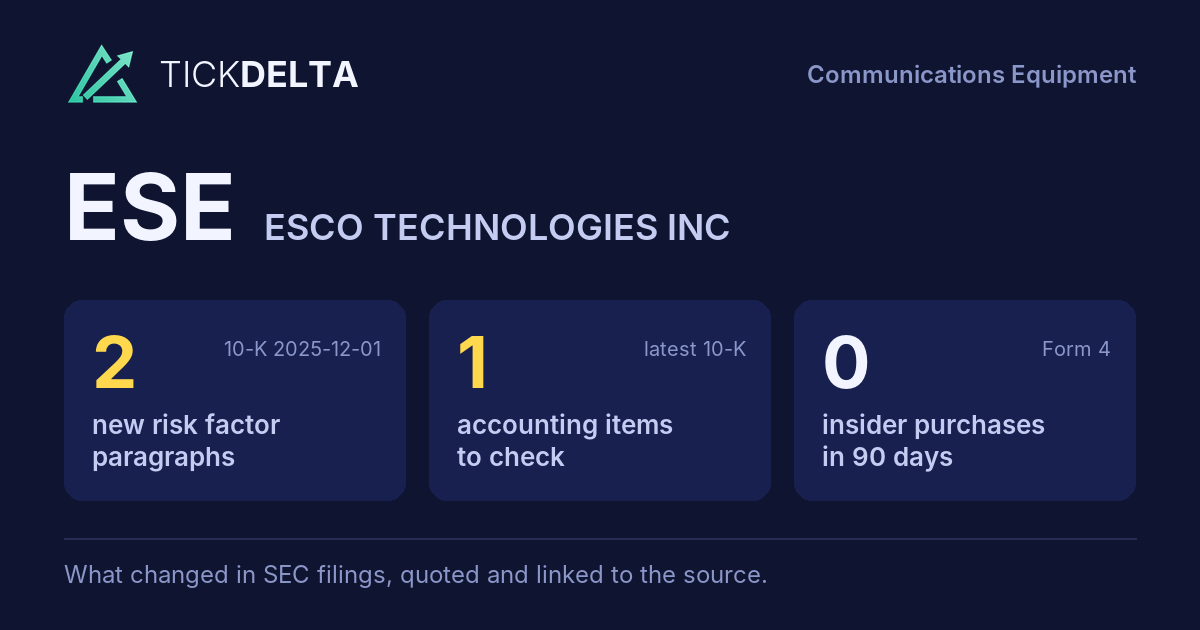
2 new risk paragraphs and 1 accounting fact worth reading about. 10-K filed Dec 1, 2025 against Nov 29, 2024.
Each row opens the detail with the quote and the filing. A row is a change worth reading, not a verdict.
Accounting checks
10 checks on the latest 10-K. Checks, not verdicts.
1fact worth reading about the other 9 checks found nothing to note
-
Cash from operations lower than net incomeCash from operations $241.9M vs net income $299.2M (FY ending Sep 30, 2025)
-
Receivables +14.2% ($222.1M to $253.6M) vs revenue +19.2% ($919.1M to $1.1B), -5.0 pts apart
8 more checks with nothing to note
-
Inventory +11.4% ($195.5M to $217.8M) vs revenue +19.2% ($919.1M to $1.1B), -7.7 pts apart
-
Same auditor in both 10-Ks: GRANT THORNTON LLP
-
No statement of substantial doubt about going concern
-
No 8-K item 4.02 in the last 2 years
-
No NT 10-K or NT 10-Q in the last 2 years
-
No sentence in the 10-K concludes that controls were not effective because of a material weakness
-
No 8-K item 2.06 in the last 2 years
-
No 8-K item 1.03 in the last 2 years
In their words
2 paragraphs in Risk Factors that were not in the 10-K filed Nov 29, 2024. Quoted as filed.
-
Item 1A · new paragraph · not in the 10-K filed Nov 29, 2024 10-K, ITEM 1A
Executive branch actions such as the imposition of tariffs on imports of component parts or raw materials exceeding our ability to pass them along to our customers, or changes in regulatory requirements;
-
Item 1A · new paragraph · not in the 10-K filed Nov 29, 2024 10-K, ITEM 1A
Future decisions of the UK Government which might significantly reduce funding for its naval programs;
New risk paragraphs, against peers
Latest 10-K of each, Technology companies closest in revenue
Paragraphs in Risk Factors with nothing like them in the company's 10-K the year before. A count of text, not of risk.
Financial performance
Last 4 fiscal years · 10-K XBRL
| Metric | FY2022 | FY2023 | FY2024 | FY2025 |
|---|---|---|---|---|
| Revenue | $857.5M | $855.8M | $919.1M | $1.1B |
| Net income | $82.3M | $92.5M | $101.9M | $299.2M |
| Operating cash flow | $135.3M | $76.9M | $127.5M | $241.9M |
| Free cash flow | $103.2M | $57.2M | $99.3M | $205.6M |
Revenue, FY2016 to FY2025
Ten fiscal years, each from its own 10-K · XBRL · USD
$1.1B ▲ 19.2% in FY2025$299.2M ▲ 193.7% in FY2025$205.6M ▲ 107.1% in FY2025
Recent filings
No new filings in the last 30 days · SEC EDGAR
Nothing new. The most recent filings:
-
8-KOct 2, 2026Material agreement signed, Material agreement ended, Acquisition or sale of assets completed, New debt or obligation, Director or officer change 8-K items 1.01, 1.02, 2.01, 2.03, 5.02
-
10-QAug 10, 2026Quarterly report (10-Q) period ended Jun 30, 2026
-
8-KAug 6, 2026Quarterly results, Regulation FD disclosure 8-K items 2.02, 7.01
-
8-KJun 3, 2026Material agreement signed, Material agreement ended, New debt or obligation 8-K items 1.01, 1.02, 2.03
About the company
Esco Technologies Inc, St. Louis, MO · from the 10-K filed Dec 1, 2025
The Registrant is ESCO Technologies Inc. (NYSE: ESE), sometimes referred to in this report as ESCO. Except where the context indicates otherwise, the terms “Company”, “we”, “our” and “us” are used in this report to refer to ESCO together with its subsidiaries through which its businesses are conducted. We are: A global provider of highly engineered components and systems for aviation, Navy, defense and industrial customers;
- Headquarters
- St. Louis, MO
- Country
- United States
- Reports in
- USD
- Listed on
- NYSE
- Fiscal year ends
- September 30
- Last results
- Aug 6, 2026
- Incorporated in
- MO
Email alerts
Sources
The 10-K filed Dec 1, 2025 (open at SEC), compared with the 10-K filed Nov 29, 2024. Numbers from the XBRL of the 10-Ks; filings from SEC EDGAR.
Work with it: Excel workbook · CSV. Google Sheet that stays up to date: paste =IMPORTDATA("https://tickdelta.com/company/ESE/export.csv") into a cell.