Aecom ACM
We are a leading global provider of professional infrastructure consulting and advisory services for governments, businesses and organizations throughout the world. 10-K, Item 1
- Headquarters
- Dallas, TX
- CEO
- Troy Rudd
- Next results
- around Feb 8, 2027
Where each dollar of revenue went, FY2025
Revenue of $16.1B through the costs to a net profit of $561.8M · income statement of the 10-K
ACM among Industrials peers
Six ratios from the latest 10-K. Each corner is the share of 251 peers the company is above, not a score.
What changed
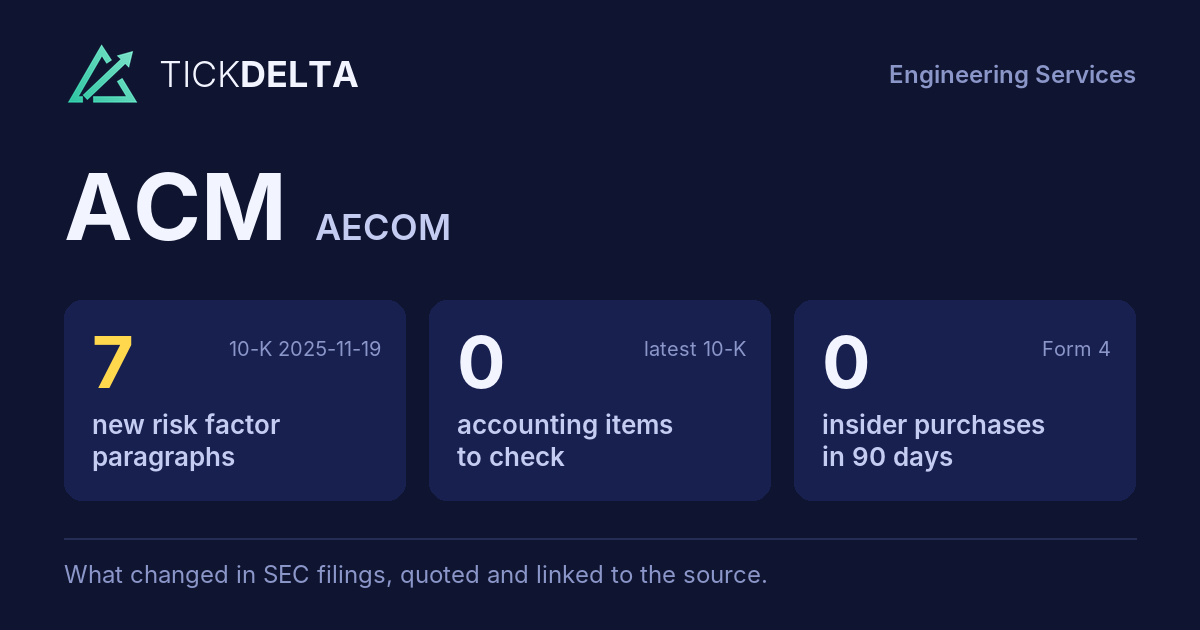
7 new risk paragraphs. 10-K filed Nov 19, 2025 against Nov 19, 2024.
Each row opens the detail with the quote and the filing. A row is a change worth reading, not a verdict.
Accounting checks
10 checks on the latest 10-K. Checks, not verdicts.
0facts worth reading about all 10 checks found nothing to note
-
Receivables -10.6% ($2.8B to $2.5B) vs revenue +0.2% ($16.1B to $16.1B), -10.8 pts apart
-
Cash from operations $821.6M vs net income $561.8M (FY ending Sep 30, 2025)
-
Same auditor in both 10-Ks: Ernst & Young LLP
7 more checks with nothing to note
-
No statement of substantial doubt about going concern
-
No 8-K item 4.02 in the last 2 years
-
No NT 10-K or NT 10-Q in the last 2 years
-
The same matters as last year: Revenue Recognition - Contract cost and claim recovery estimates
-
No sentence in the 10-K concludes that controls were not effective because of a material weakness
-
No 8-K item 2.06 in the last 2 years
-
No 8-K item 1.03 in the last 2 years
In their words
7 paragraphs in Risk Factors that were not in the 10-K filed Nov 19, 2024. Quoted as filed.
-
Item 1A · new paragraph · not in the 10-K filed Nov 19, 2024 10-K, ITEM 1A
Our books and records are subject to audit by the various governmental agencies we serve and their representatives. These audits can result in adjustments to the amount of contract costs we believe are reimbursable by the
-
Item 1A · new paragraph · not in the 10-K filed Nov 19, 2024 10-K, ITEM 1A
We may use artificial intelligence, machine learning, data science and similar technologies in our business, and challenges with properly managing such technologies could result in reputational harm, competitive harm, and legal liability, and adversely affect our business, financial condition and results of operations. Artificial…
New risk paragraphs, against peers
Latest 10-K of each, Industrials companies closest in revenue
Paragraphs in Risk Factors with nothing like them in the company's 10-K the year before. A count of text, not of risk.
Financial performance
Last 4 fiscal years · 10-K XBRL
| Metric | FY2022 | FY2023 | FY2024 | FY2025 |
|---|---|---|---|---|
| Revenue | $13.1B | $14.4B | $16.1B | $16.1B |
| Net income | $310.6M | $55.3M | $402.3M | $561.8M |
| Operating cash flow | $713.6M | $696.0M | $827.5M | $821.6M |
| Free cash flow | $576.6M | $590.4M | $707.9M | $684.9M |
Revenue, FY2017 to FY2025
Ten fiscal years, each from its own 10-K · XBRL · USD
$16.1B ▲ 0.2% in FY2025$561.8M ▲ 39.7% in FY2025$684.9M ▼ 3.2% in FY2025
Recent filings
1 filing in the last 30 days · SEC EDGAR
-
8-KNov 16, 2026Quarterly results, Other events 8-K items 2.02, 8.01
About the company
Aecom, Dallas, TX · from the 10-K filed Nov 19, 2025
We are a leading global provider of professional infrastructure consulting and advisory services for governments, businesses and organizations throughout the world. We provide advisory, planning, consulting, architectural and engineering design, construction and program management services, and investment and development services to public and private clients worldwide in major end markets such as transportation, facilities, water, environmental, and energy.
- Headquarters
- Dallas, TX
- Country
- United States
- Reports in
- USD
- Listed on
- NYSE
- Fiscal year ends
- September 30
- Last results
- Nov 16, 2026
- Incorporated in
- DE
Email alerts
Sources
The 10-K filed Nov 19, 2025 (open at SEC), compared with the 10-K filed Nov 19, 2024. Numbers from the XBRL of the 10-Ks; filings from SEC EDGAR.
Work with it: Excel workbook · CSV. Google Sheet that stays up to date: paste =IMPORTDATA("https://tickdelta.com/company/ACM/export.csv") into a cell.