Universal Display Corp \PA\ OLED
We are a leader in the research, development and commercialization of organic light emitting diode (OLED) technologies and materials for use in display and solid-state lighting applications. 10-K, Item 1
- Headquarters
- Ewing, NJ
- CEO
- Steven V. Abramson
- Next results
- around Feb 18, 2027
Where each dollar of revenue went, FY2025
Revenue of $650.6M through the costs to a net profit of $242.1M · income statement of the 10-K
OLED among Technology peers
Six ratios from the latest 10-K. Each corner is the share of 230 peers the company is above, not a score.
What changed
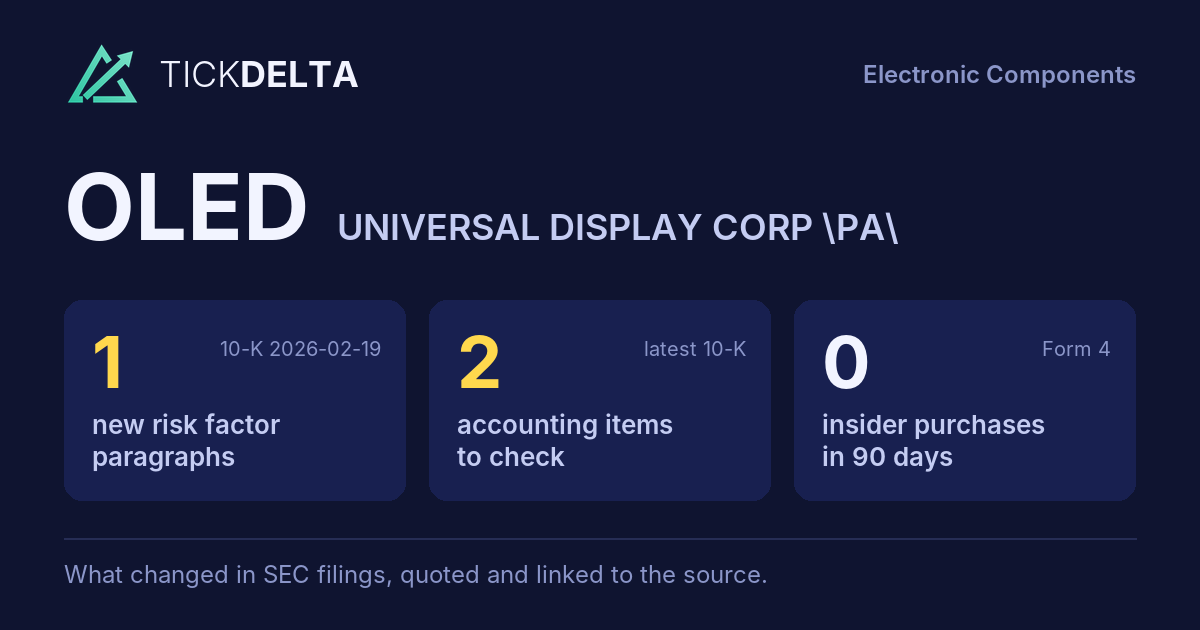
1 new risk paragraph and 2 accounting facts worth reading about. 10-K filed Feb 19, 2026 against Feb 20, 2025.
Each row opens the detail with the quote and the filing. A row is a change worth reading, not a verdict.
Accounting checks
11 checks on the latest 10-K. Checks, not verdicts.
2facts worth reading about the other 9 checks found nothing to note
-
Cash from operations lower than net incomeCash from operations $210.8M vs net income $242.1M (FY ending Dec 31, 2025)
-
Inventory growing faster than revenueInventory +31.7% ($182.9M to $240.9M) vs revenue +0.5% ($647.7M to $650.6M), +31.2 pts apart
-
Receivables +5.5% ($113.6M to $120.0M) vs revenue +0.5% ($647.7M to $650.6M), +5.1 pts apart
8 more checks with nothing to note
-
Same auditor in both 10-Ks: KPMG, LLP
-
No statement of substantial doubt about going concern
-
No 8-K item 4.02 in the last 2 years
-
No NT 10-K or NT 10-Q in the last 2 years
-
The same matters as last year: Estimated per unit fee for long-term OLED contracts
-
No sentence in the 10-K concludes that controls were not effective because of a material weakness
-
No 8-K item 2.06 in the last 2 years
-
No 8-K item 1.03 in the last 2 years
In their words
1 paragraph in Risk Factors that was not in the 10-K filed Feb 20, 2025. Quoted as filed.
-
Item 1A · new paragraph · not in the 10-K filed Feb 20, 2025 10-K, ITEM 1A
In addition, our business could be adversely impacted if our customers experience budget, inflationary or other pressures, such as increases in the cost of borrowing from rising interest rates. Increases in interest rates may have a particularly pronounced impact on highly leveraged customers located in the Asia-Pacific region. These…
New risk paragraphs, against peers
Latest 10-K of each, Technology companies closest in revenue
Paragraphs in Risk Factors with nothing like them in the company's 10-K the year before. A count of text, not of risk.
Financial performance
Last 4 fiscal years · 10-K XBRL
| Metric | FY2022 | FY2023 | FY2024 | FY2025 |
|---|---|---|---|---|
| Revenue | $616.6M | $576.4M | $647.7M | $650.6M |
| Net income | $210.1M | $203.0M | $222.1M | $242.1M |
| Operating cash flow | $126.8M | $154.8M | $253.7M | $210.8M |
| Free cash flow | $84.3M | $95.0M | $211.1M | $154.4M |
Revenue, FY2016 to FY2025
Ten fiscal years, each from its own 10-K · XBRL · USD
$650.6M ▲ 0.5% in FY2025$242.1M ▲ 9.0% in FY2025$154.4M ▼ 26.9% in FY2025
Recent filings
2 filings in the last 30 days · SEC EDGAR
-
8-KOct 28, 2026Quarterly results 8-K item 2.02
-
10-QOct 28, 2026Quarterly report (10-Q) period ended Sep 30, 2026
About the company
Universal Display Corp \PA\, Ewing, NJ · from the 10-K filed Feb 19, 2026
We are a leader in the research, development and commercialization of organic light emitting diode (OLED) technologies and materials for use in display and solid-state lighting applications. OLEDs are thin, lightweight and power-efficient solid-state devices that emit light that can be manufactured on both flexible and rigid substrates, making them highly suitable for use in full-color displays and as lighting products. OLED displays are capturing a growing share of the display market, especially in the mobile phone, television, monitor, wearable, tablet, notebook and personal computer, augmented reality (AR), virtual reality (VR) and automotive markets.
- Headquarters
- Ewing, NJ
- Country
- United States
- Reports in
- USD
- Listed on
- Nasdaq
- Fiscal year ends
- December 31
- Last results
- Oct 28, 2026
- Incorporated in
- PA
Email alerts
Sources
The 10-K filed Feb 19, 2026 (open at SEC), compared with the 10-K filed Feb 20, 2025. Numbers from the XBRL of the 10-Ks; filings from SEC EDGAR.
Work with it: Excel workbook · CSV. Google Sheet that stays up to date: paste =IMPORTDATA("https://tickdelta.com/company/OLED/export.csv") into a cell.