Group 1 Automotive Inc GPI
Group 1 Automotive, Inc. is a leading operator in the automotive retail industry. 10-K, Item 1
- Employees
- 20,452
- Headquarters
- Houston, TX
- CEO
- Daryl Kenningham
- Next results
- around Jan 28, 2027
Where each dollar of revenue went, FY2025
Revenue of $22.6B through the costs to a net profit of $325.2M · income statement of the 10-K
GPI among Consumer discretionary peers
Six ratios from the latest 10-K. Each corner is the share of 168 peers the company is above, not a score.
What changed
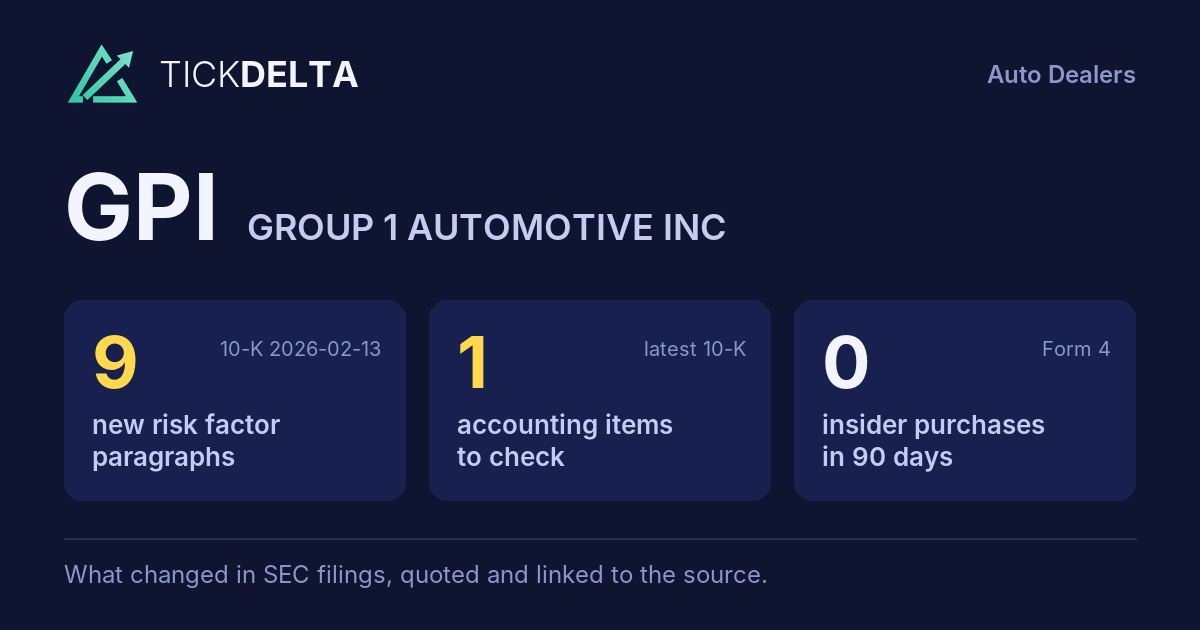
9 new risk paragraphs and 1 accounting fact worth reading about. 10-K filed Feb 13, 2026 against Feb 14, 2025.
Each row opens the detail with the quote and the filing. A row is a change worth reading, not a verdict.
Accounting checks
11 checks on the latest 10-K. Checks, not verdicts.
1fact worth reading about the other 10 checks found nothing to note
-
Critical audit matters changedNew this year: Intangible Franchise Rights (“The Company’s evaluation of intangible franchise rights for impairment is performed annually, or more frequently if events or circumstances indicate possible impairment. The Company first completes a qualitative assessment to determine whether it is more-likely-than-not that an impairment exists. If”); Goodwill - U.K. Reporting Unit (“The Company’s evaluation of goodwill for impairment involves the comparison of the fair value of each reporting unit to its carrying value. For the U.K. reporting unit, the Company uses a combination of the income and market approaches to estimate reporting unit fair value, which requires management”). No longer listed: Goodwill Impairment Assessment
-
Receivables +1.8% ($303.0M to $308.4M) vs revenue +13.2% ($19.9B to $22.6B), -11.4 pts apart
9 more checks with nothing to note
-
Cash from operations $694.5M vs net income $325.2M (FY ending Dec 31, 2025)
-
Inventory +4.0% ($2.6B to $2.7B) vs revenue +13.2% ($19.9B to $22.6B), -9.3 pts apart
-
Same auditor in both 10-Ks: Deloitte & Touche LLP
-
No statement of substantial doubt about going concern
-
No 8-K item 4.02 in the last 2 years
-
No NT 10-K or NT 10-Q in the last 2 years
-
No sentence in the 10-K concludes that controls were not effective because of a material weakness
-
No 8-K item 2.06 in the last 2 years
-
No 8-K item 1.03 in the last 2 years
In their words
9 paragraphs in Risk Factors that were not in the 10-K filed Feb 14, 2025. Quoted as filed.
-
Item 1A · new paragraph · not in the 10-K filed Feb 14, 2025 10-K, ITEM 1A
Existing and potential new trade policies, such as tariffs, could adversely affect our operations, costs and business.
-
Item 1A · new paragraph · not in the 10-K filed Feb 14, 2025 10-K, ITEM 1A
While the possibility exists for delays, reductions or exemptions of the automotive and reciprocal tariffs, the potential impacts of the tariffs described above remain uncertain and may cause a significant impact on the affordability of our products as well as the future mix of and demand for vehicles provided by our manufacturers, as…
-
Item 1A · new paragraph · not in the 10-K filed Feb 14, 2025 10-K, ITEM 1A
In addition, we may face increased competition in the markets in which we operate from vehicle manufacturers not currently represented in our dealership portfolio, including emerging Chinese automotive manufacturers. In the U.K., Chinese-branded vehicles have increased their share of new vehicle sales in recent periods, growing from…
-
Item 1A · new paragraph · not in the 10-K filed Feb 14, 2025 10-K, ITEM 1A
Increased attention to sustainability matters may adversely impact our business, reputation and access to capital. We face increased attention and evolving expectations from investors, regulators and other stakeholders regarding sustainability matters, including climate change, environmental and social impacts, and voluntary or…
New risk paragraphs, against peers
Latest 10-K of each, Consumer discretionary companies closest in revenue
Paragraphs in Risk Factors with nothing like them in the company's 10-K the year before. A count of text, not of risk.
Financial performance
Last 4 fiscal years · 10-K XBRL
| Metric | FY2022 | FY2023 | FY2024 | FY2025 |
|---|---|---|---|---|
| Revenue | $16.2B | $17.9B | $19.9B | $22.6B |
| Net income | $751.5M | $601.6M | $498.1M | $325.2M |
| Operating cash flow | $585.9M | $190.2M | $586.3M | $694.5M |
| Free cash flow | $430.4M | $4.8M | $341.2M | $424.5M |
Revenue, FY2016 to FY2025
Ten fiscal years, each from its own 10-K · XBRL · USD
$22.6B ▲ 13.2% in FY2025$325.2M ▼ 34.7% in FY2025$424.5M ▲ 24.4% in FY2025
Recent filings
8 filings in the last 30 days · SEC EDGAR
-
OfficerNov 10, 2026CEO change (the “Company”), upon the recommendation of the Company’s President and Chief Executive Officer, appointed Peter C.
-
Planned saleOct 30, 2026Steven Mizell (Officer) gave notice of a planned sale of 550 shares worth about $143K Form 144, approximate sale date Oct 30, 2026
-
Planned saleOct 29, 2026Hobson Gillian A. (Officer) gave notice of a planned sale of 1,189 shares worth about $307K Form 144, approximate sale date Oct 29, 2026
-
Planned saleOct 29, 2026Gillian Hobson (Officer) gave notice of a planned sale of 811 shares worth about $210K Form 144, approximate sale date Oct 29, 2026
-
10-QOct 29, 2026Quarterly report (10-Q) period ended Sep 30, 2026
About the company
Group 1 Automotive Inc, Houston, TX · from the 10-K filed Feb 13, 2026
Group 1 Automotive, Inc. is a leading operator in the automotive retail industry. We sell and/or lease new and used cars and light trucks; arrange related vehicle financing; sell service and insurance contracts; provide automotive maintenance and repair services; and sell vehicle parts retail and wholesale. We have operations in geographically diverse markets that extend across 17 states in the U.S. and 62 towns and cities in the U.K. As of December 31, 2025, our retail network consists of 145 dealerships and 21 collision centers in the U.S. and 109 dealerships and 11 collision centers in the U.K.
- Headquarters
- Houston, TX
- Country
- United States
- Reports in
- USD
- Listed on
- NYSE
- Fiscal year ends
- December 31
- Last results
- Oct 28, 2026
- Incorporated in
- DE
Employees, at the top of the page: "As of December 31, 2025, we had 20,452 employees (full-time, part-time and temporary), of which 13,563 were employed in the U" (10-K). Address and exchange: SEC's company file.
Email alerts
Sources
The 10-K filed Feb 13, 2026 (open at SEC), compared with the 10-K filed Feb 14, 2025. Numbers from the XBRL of the 10-Ks; filings from SEC EDGAR.
Work with it: Excel workbook · CSV. Google Sheet that stays up to date: paste =IMPORTDATA("https://tickdelta.com/company/GPI/export.csv") into a cell.