Bentley Systems Inc BSY
Our purpose is to advance the world’s infrastructure for better quality of life. 10-K, Item 1
- Headquarters
- Exton, PA
- CEO
- Nicholas Cumins
- Next results
- around Feb 25, 2027
Where each dollar of revenue went, FY2025
Revenue of $1.5B through the costs to a net profit of $277.9M · income statement of the 10-K
BSY among Technology peers
Six ratios from the latest 10-K. Each corner is the share of 230 peers the company is above, not a score.
What changed
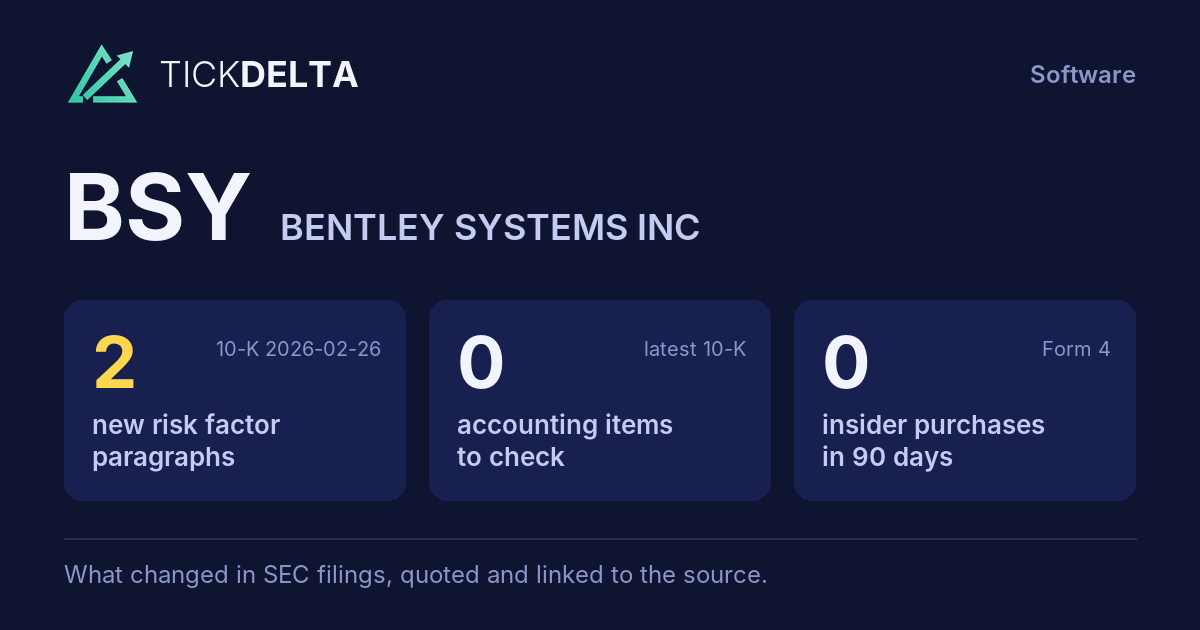
2 new risk paragraphs. 10-K filed Feb 26, 2026 against Feb 26, 2025.
Each row opens the detail with the quote and the filing. A row is a change worth reading, not a verdict.
Accounting checks
9 checks on the latest 10-K. Checks, not verdicts.
0facts worth reading about all 9 checks found nothing to note
-
Cash from operations $538.5M vs net income $277.9M (FY ending Dec 31, 2025)
-
Same auditor in both 10-Ks: KPMG LLP
-
No statement of substantial doubt about going concern
6 more checks with nothing to note
-
No 8-K item 4.02 in the last 2 years
-
No NT 10-K or NT 10-Q in the last 2 years
-
The same matters as last year: IT systems used in subscriptions and licenses revenues
-
No sentence in the 10-K concludes that controls were not effective because of a material weakness
-
No 8-K item 2.06 in the last 2 years
-
No 8-K item 1.03 in the last 2 years
In their words
2 paragraphs in Risk Factors that were not in the 10-K filed Feb 26, 2025. Quoted as filed.
-
Item 1A · new paragraph · not in the 10-K filed Feb 26, 2025 10-K, ITEM 1A
litigation, and possible liability. Although we devote resources to maintaining our security and integrity, we may not prevent security incidents.
-
Item 1A · new paragraph · not in the 10-K filed Feb 26, 2025 10-K, ITEM 1A
be adversely affected, use of our software and services could decrease, and we could be exposed to a risk of loss, litigation, and regulatory proceedings.
New risk paragraphs, against peers
Latest 10-K of each, Technology companies closest in revenue
Paragraphs in Risk Factors with nothing like them in the company's 10-K the year before. A count of text, not of risk.
Financial performance
Last 4 fiscal years · 10-K XBRL
| Metric | FY2022 | FY2023 | FY2024 | FY2025 |
|---|---|---|---|---|
| Revenue | $1.1B | $1.2B | $1.4B | $1.5B |
| Net income | $174.8M | $326.8M | $234.8M | $277.9M |
| Operating cash flow | $274.3M | $416.7M | $435.3M | $538.5M |
| Free cash flow | $255.8M | $391.7M | $421.2M | $520.2M |
Revenue, FY2018 to FY2025
Ten fiscal years, each from its own 10-K · XBRL · USD
$1.5B ▲ 11.0% in FY2025$277.9M ▲ 18.3% in FY2025$520.2M ▲ 23.5% in FY2025
Recent filings
9 filings in the last 30 days · SEC EDGAR
-
Planned saleNov 10, 2026Bentley Keith A. (Director) gave notice of a planned sale of 350,000 shares worth about $17.8M Form 144, approximate sale date Nov 10, 2026, under a 10b5-1 plan adopted Aug 10, 2026
-
Planned saleNov 6, 2026WERNER ANDRE (Officer) gave notice of a planned sale of 10,000 shares worth about $450K Form 144, approximate sale date Nov 6, 2026
-
Planned saleNov 5, 2026Keith A. Bentley (member of the Company’s Board of Directors) adopted a 10b5-1 trading plan reported in the 10-Q, up to 350,000 shares, runs to May 7, 2027
-
Planned saleNov 5, 2026Julien Moutte (Company’s Chief Technology Officer) adopted a 10b5-1 trading plan reported in the 10-Q, up to 12,000 shares, runs to Aug 18, 2027
-
Planned saleNov 5, 2026Raymond B. Bentley (member of the Company’s Board of Directors) adopted a 10b5-1 trading plan reported in the 10-Q, up to 1,000,000 shares, runs to Jun 16, 2027
About the company
Bentley Systems Inc, Exton, PA · from the 10-K filed Feb 26, 2026
Our purpose is to advance the world’s infrastructure for better quality of life. Our mission is to reshape how infrastructure systems and critical resources are delivered and optimized. We were founded in 1984 by the Bentley brothers and on September 25, 2020, we completed our initial public offering (“IPO”). Our enduring commitment is to develop and support the most comprehensive portfolio of integrated software offerings across disciplines, sectors, geographies, and the infrastructure lifecycle, enabling digital workflows that improve project delivery and asset performance.
- Headquarters
- Exton, PA
- Country
- United States
- Reports in
- USD
- Listed on
- Nasdaq
- Fiscal year ends
- December 31
- Last results
- Nov 5, 2026
- Incorporated in
- DE
Email alerts
Sources
The 10-K filed Feb 26, 2026 (open at SEC), compared with the 10-K filed Feb 26, 2025. Numbers from the XBRL of the 10-Ks; filings from SEC EDGAR.
Work with it: Excel workbook · CSV. Google Sheet that stays up to date: paste =IMPORTDATA("https://tickdelta.com/company/BSY/export.csv") into a cell.