Silicon Laboratories Inc. SLAB
Silicon Laboratories Inc. is a leader in secure, intelligent wireless technology for a more connected world. 10-K, Item 1
- Employees
- 1,930
- Headquarters
- Austin, TX
- CEO
- Robert Matthew Johnson
- Next results
- around Feb 3, 2027
Where each dollar of revenue went, FY2022
Revenue of $1.0B through the costs to a net profit of $91.4M · income statement of the 10-K
SLAB among Technology peers
Six ratios from the latest 10-K. Each corner is the share of 230 peers the company is above, not a score.
What changed
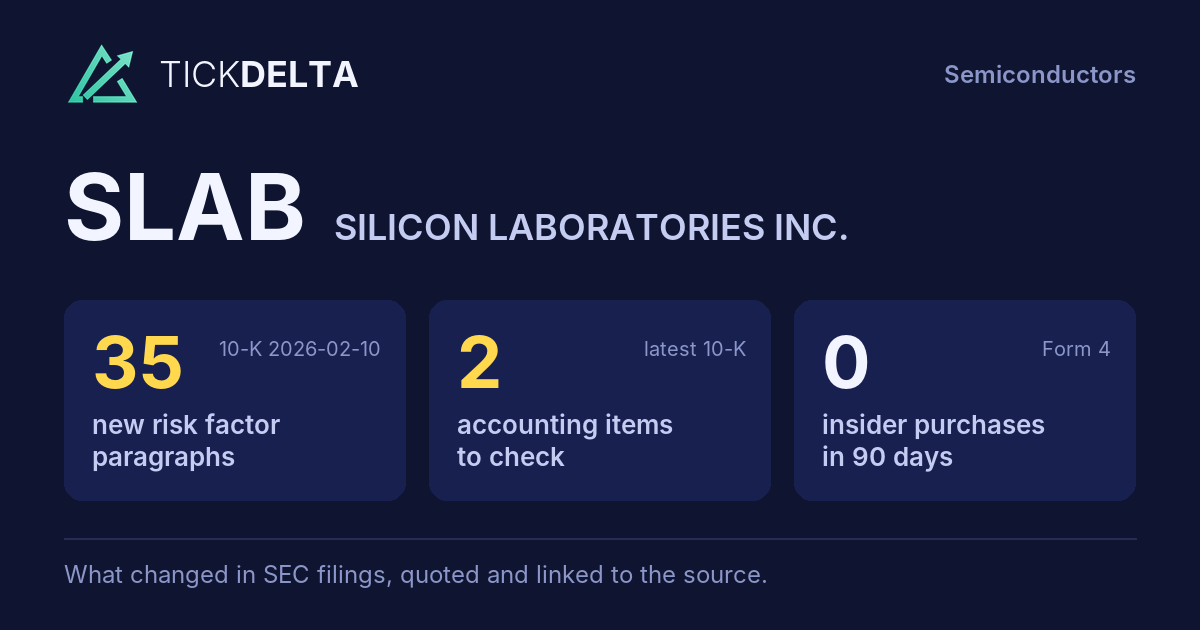
35 new risk paragraphs and 2 accounting facts worth reading about. 10-K filed Feb 10, 2026 against Feb 4, 2025.
Each row opens the detail with the quote and the filing. A row is a change worth reading, not a verdict.
Accounting checks
11 checks on the latest 10-K. Checks, not verdicts.
2facts worth reading about the other 9 checks found nothing to note
-
Auditor change8-K item 4.01 (change in certifying accountant) filed Mar 6, 2025
-
Critical audit matters changedNew this year: Inventories - Inventory Valuation (“Inventory is stated at the lower of cost, determined using the first-in, first-out method, or net realizable value. The Company writes down the carrying value of inventory to net realizable value if it is obsolete or unmarketable based upon the age of inventory or if quantities are in excess of cust”). No longer listed: Inventory Valuation
-
Receivables +18.4% ($54.5M to $64.5M) vs revenue +34.3% ($584.4M to $784.8M), -15.9 pts apart
8 more checks with nothing to note
-
Cash from operations $95.7M vs net income −$64.9M (FY ending Jan 3, 2026)
-
Inventory -9.5% ($105.6M to $95.6M) vs revenue +34.3% ($584.4M to $784.8M), -43.8 pts apart
-
No statement of substantial doubt about going concern
-
No 8-K item 4.02 in the last 2 years
-
No NT 10-K or NT 10-Q in the last 2 years
-
No sentence in the 10-K concludes that controls were not effective because of a material weakness
-
No 8-K item 2.06 in the last 2 years
-
No 8-K item 1.03 in the last 2 years
In their words
35 paragraphs in Risk Factors that were not in the 10-K filed Feb 4, 2025. Quoted as filed.
-
Item 1A · new paragraph · not in the 10-K filed Feb 4, 2025 10-K, ITEM 1A
We may not complete the proposed Merger within the time frame we anticipate, or at all, which could have an adverse effect on our business, financial condition, results of operations, cash flows and stock price On February 4, 2026, we entered into the Merger Agreement with Parent and Merger Subsidiary, pursuant to which Merger…
-
Item 1A · new paragraph · not in the 10-K filed Feb 4, 2025 10-K, ITEM 1A
The announcement and pendency of the Merger, as well as any delays in the expected timeframe, could cause disruption in our business and create uncertainties, which could have an adverse effect on our business, results of operations, cash flows and financial condition, regardless of whether the Merger is completed. These risks and…
-
Item 1A · new paragraph · not in the 10-K filed Feb 4, 2025 10-K, ITEM 1A
Lawsuits relating to the Merger could be filed against us and our directors and officers, including by our stockholders. Although litigation is common in connection with acquisitions of public companies, regardless of any merits related to the underlying acquisition, the outcome of any litigation cannot be assured and could delay or…
-
Item 1A · new paragraph · not in the 10-K filed Feb 4, 2025 10-K, ITEM 1A
Our business, financial condition, and results of operations could be materially and adversely affected by global or industry-specific shortages of memory components or other key components necessary for our customers’ products Our customers’ products often incorporate third-party memory components, such as DRAM or NAND, that are…
New risk paragraphs, against peers
Latest 10-K of each, Technology companies closest in revenue
Paragraphs in Risk Factors with nothing like them in the company's 10-K the year before. A count of text, not of risk.
Financial performance
Last 4 fiscal years · 10-K XBRL
| Metric | FY2022 | FY2023 | FY2024 | FY2025 |
|---|---|---|---|---|
| Revenue | $1.0B | $782.3M | $584.4M | $784.8M |
| Net income | $91.4M | −$34.5M | −$191.0M | −$64.9M |
| Operating cash flow | $141.3M | −$30.3M | −$13.9M | $95.7M |
| Free cash flow | $114.7M | −$52.6M | −$25.7M | $65.8M |
Revenue, FY2016 to FY2025
Ten fiscal years, each from its own 10-K · XBRL · USD
$784.8M ▲ 34.3% in FY2025−$64.9M in FY2025$65.8M in FY2025
Recent filings
2 filings in the last 30 days · SEC EDGAR
-
8-KNov 10, 2026Quarterly results 8-K item 2.02
-
10-QNov 10, 2026Quarterly report (10-Q) period ended Oct 3, 2026
About the company
Silicon Laboratories Inc., Austin, TX · from the 10-K filed Feb 10, 2026
Silicon Laboratories Inc. is a leader in secure, intelligent wireless technology for a more connected world. Our integrated hardware and software platforms, intuitive development tools, industry-leading ecosystem, and robust support help customers build advanced devices for industrial, commercial, home, and life applications. We make it easy for developers to solve complex wireless challenges throughout the product lifecycle and get to market quickly with innovative solutions that transform industries, grow economies, and improve lives.
- Headquarters
- Austin, TX
- Country
- United States
- Reports in
- USD
- Listed on
- Nasdaq
- Fiscal year ends
- January 2
- Last results
- Nov 10, 2026
- Incorporated in
- DE
Employees, at the top of the page: "As of January 3, 2026, we employed 1,930 people, of whom 72% were in engineering roles" (10-K). Address and exchange: SEC's company file.
Email alerts
Sources
The 10-K filed Feb 10, 2026 (open at SEC), compared with the 10-K filed Feb 4, 2025. Numbers from the XBRL of the 10-Ks; filings from SEC EDGAR.
Work with it: Excel workbook · CSV. Google Sheet that stays up to date: paste =IMPORTDATA("https://tickdelta.com/company/SLAB/export.csv") into a cell.