Mercury Systems Inc MRCY
Mercury Systems is a global leader in aerospace and defense electronics, providing breakthrough capabilities in signal and data processing. 10-K, Item 1
- Employees
- 2,102
- Headquarters
- Andover, MA
- CEO
- William L. Ballhaus
- Next results
- around Feb 2, 2027
Where each dollar of revenue went, FY2022
Revenue of $988.2M through the costs to a net profit of $11.3M · income statement of the 10-K
MRCY among Technology peers
Six ratios from the latest 10-K. Each corner is the share of 230 peers the company is above, not a score.
What changed
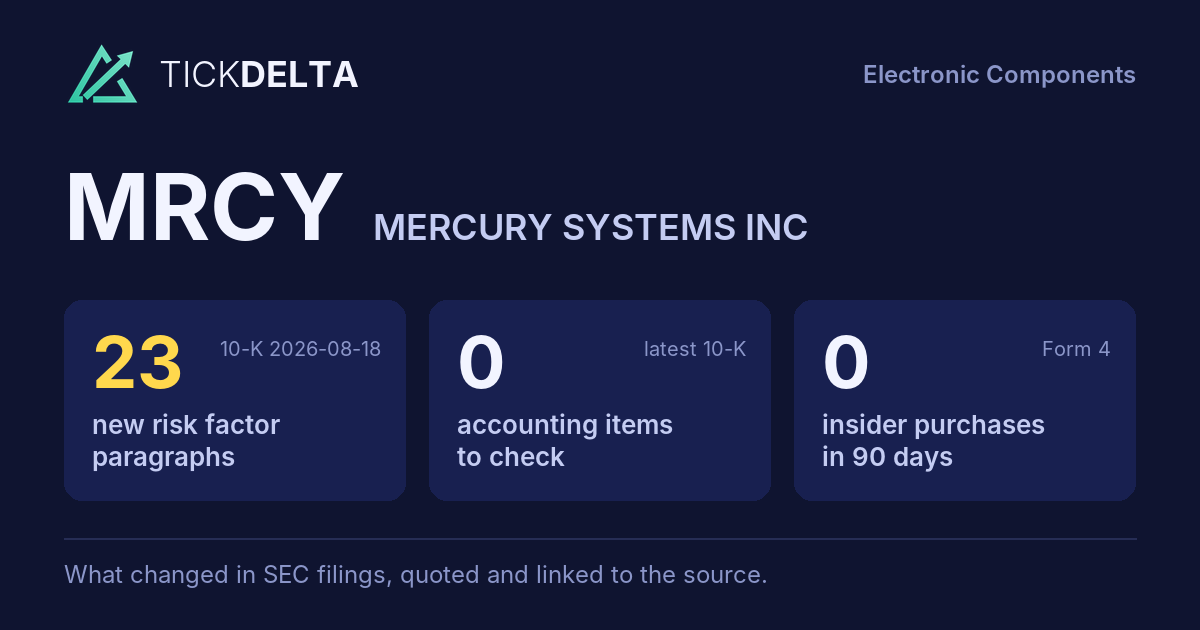
23 new risk paragraphs. 10-K filed Aug 18, 2026 against Aug 11, 2025.
Each row opens the detail with the quote and the filing. A row is a change worth reading, not a verdict.
Accounting checks
11 checks on the latest 10-K. Checks, not verdicts.
0facts worth reading about all 11 checks found nothing to note
-
Receivables -36.8% ($109.6M to $69.2M) vs revenue +7.9% ($912.0M to $983.6M), -44.7 pts apart
-
Cash from operations $102.4M vs net income −$29.7M (FY ending Jul 3, 2026)
-
Inventory +10.2% ($332.9M to $367.0M) vs revenue +7.9% ($912.0M to $983.6M), +2.4 pts apart
8 more checks with nothing to note
-
Same auditor in both 10-Ks: KPMG LLP
-
No statement of substantial doubt about going concern
-
No 8-K item 4.02 in the last 2 years
-
No NT 10-K or NT 10-Q in the last 2 years
-
The same matters as last year: Estimate of total contract costs to be incurred for certain fixed price contract revenue recognized over time
-
No sentence in the 10-K concludes that controls were not effective because of a material weakness
-
No 8-K item 2.06 in the last 2 years
-
No 8-K item 1.03 in the last 2 years
In their words
23 paragraphs in Risk Factors that were not in the 10-K filed Aug 11, 2025. Quoted as filed.
-
Item 1A · new paragraph · not in the 10-K filed Aug 11, 2025 10-K, ITEM 1A
We may be unable to increase production to satisfy the increasing demand for our products. We may be unable to successfully execute our production plans and meet growing demand for our products, which could adversely affect our business, financial condition and results of operations. Our backlog and new bookings have increased…
-
Item 1A · new paragraph · not in the 10-K filed Aug 11, 2025 10-K, ITEM 1A
Ineffective inventory management may lead to excess or obsolete stock, higher costs, operational disruptions or inaccurate valuation. We maintain significant amounts of raw materials, work‑in‑process and finished goods to support production and customer demand. Inaccurate demand forecasting, changes in customer requirements, supply…
-
Item 1A · new paragraph · not in the 10-K filed Aug 11, 2025 10-K, ITEM 1A
Price escalation for semiconductor and memory components may adversely affect our profitability. We rely on advanced electronic components, including semiconductor microchips, memory modules and specialized microelectronics, to manufacture our products and solutions. The global market for these components has experienced, and may…
-
Item 1A · new paragraph · not in the 10-K filed Aug 11, 2025 10-K, ITEM 1A
Beyond tariffs, the U.S. government has continually expanded export-control restrictions under the Export Administration Regulations (“EAR”) and International Traffic in Arms Regulations (“ITAR”) targeting advanced electronics, semiconductors, and dual-use technologies. These regulations have increased licensing requirements, added…
New risk paragraphs, against peers
Latest 10-K of each, Technology companies closest in revenue
Paragraphs in Risk Factors with nothing like them in the company's 10-K the year before. A count of text, not of risk.
Financial performance
Last 4 fiscal years · 10-K XBRL
| Metric | FY2023 | FY2024 | FY2025 | FY2026 |
|---|---|---|---|---|
| Revenue | $973.9M | $835.3M | $912.0M | $983.6M |
| Net income | −$28.3M | −$137.6M | −$37.9M | −$29.7M |
| Operating cash flow | −$21.3M | $60.4M | $138.9M | $102.4M |
| Free cash flow | −$60.0M | $26.1M | $119.0M | $68.1M |
Revenue, FY2017 to FY2026
Ten fiscal years, each from its own 10-K · XBRL · USD
$983.6M ▲ 7.9% in FY2026−$29.7M in FY2026$68.1M ▼ 42.8% in FY2026
Recent filings
4 filings in the last 30 days · SEC EDGAR
-
OfficerNov 10, 2026CAO change On November 10, 2026, the Company announced that Brian Caulfield has been appointed as acting Chief Accounting Officer effective as of November 13, 2026.
-
10-QNov 10, 2026Quarterly report (10-Q) period ended Oct 2, 2026
-
8-KNov 3, 2026Director or officer change, Shareholder vote results, Other events 8-K items 5.02, 5.07, 8.01
-
Planned saleOct 21, 2026KUPINSKY STUART (Officer) gave notice of a planned sale of 1,000 shares worth about $76K Form 144, approximate sale date Oct 21, 2026, under a 10b5-1 plan adopted May 7, 2026
About the company
Mercury Systems Inc, Andover, MA · from the 10-K filed Aug 18, 2026
Mercury Systems is a global leader in aerospace and defense electronics, providing breakthrough capabilities in signal and data processing. With a four-decade legacy of innovation that spans silicon to systems and radio frequency (“RF”) front ends to effectors, we accelerate commercial technology adoption to deliver powerful and secure mission-critical processing solutions to the edge. We are headquartered in Andover, Massachusetts, and have multiple locations worldwide. Our end-to-end processing ecosystem, the Mercury Processing Platform, is built on technologies we have developed and acquired over 40 years.
- Headquarters
- Andover, MA
- Country
- United States
- Reports in
- USD
- Listed on
- Nasdaq
- Fiscal year ends
- June 30
- Last results
- Nov 10, 2026
- Incorporated in
- MA
Employees, at the top of the page: "• Employee Overview: As of July 3, 2026, we employed 2,102 people excluding contractors around the globe, including 518 in R&D, 111 in sales and marketing, 1,186 in manufacturing and customer support and 287 in general and administrative functions" (10-K). Address and exchange: SEC's company file.
Email alerts
Sources
The 10-K filed Aug 18, 2026 (open at SEC), compared with the 10-K filed Aug 11, 2025. Numbers from the XBRL of the 10-Ks; filings from SEC EDGAR.
Work with it: Excel workbook · CSV. Google Sheet that stays up to date: paste =IMPORTDATA("https://tickdelta.com/company/MRCY/export.csv") into a cell.