Bruker Corp BRKR
We are a developer, manufacturer, and distributor of high-performance scientific instruments and analytical and diagnostic solutions that enable our customers to explore life and materials at microscopic, molecular and cellular levels. 10-K, Item 1
- Employees
- 11,085
- Headquarters
- Billerica, MA
- CEO
- Frank H. Laukien
- Next results
- around Jan 11, 2027
Where each dollar of revenue went, FY2024
Revenue of $3.4B through the costs to a net profit of $113.1M · income statement of the 10-K
BRKR among Technology peers
Six ratios from the latest 10-K. Each corner is the share of 230 peers the company is above, not a score.
What changed
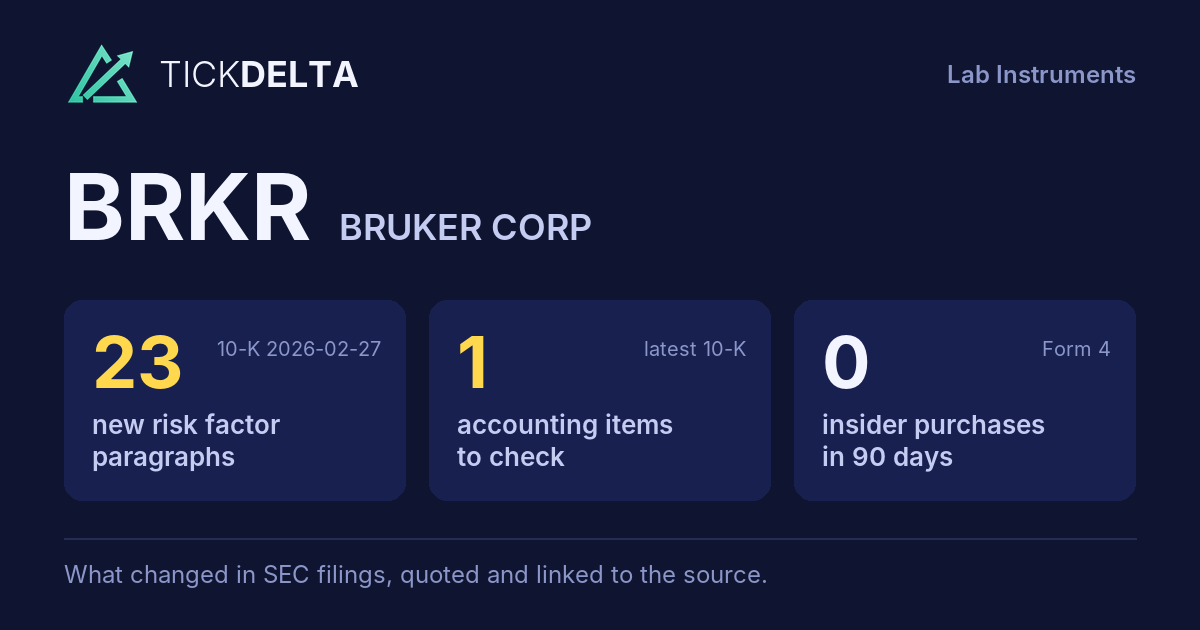
23 new risk paragraphs and 1 accounting fact worth reading about. 10-K filed Feb 27, 2026 against Mar 3, 2025.
Each row opens the detail with the quote and the filing. A row is a change worth reading, not a verdict.
Accounting checks
11 checks on the latest 10-K. Checks, not verdicts.
1fact worth reading about the other 10 checks found nothing to note
-
Critical audit matters changedNew this year: Interim Goodwill Impairment Test - Bruker Spatial Biology and Automation Reporting Units (“As described in Notes 2 and 6 to the consolidated financial statements, as of December 31, 2025, the goodwill associated with the Bruker Scientific Instruments (BSI) NANO segment was $525.8 million, of which a portion relates to the Bruker Spatial Biology (BSB) reporting unit and the goodwill associ”). No longer listed: Acquisition of ELITechGroup - Valuation of Customer Relationships and Technology. Same as last year: Revenue Recognition - System Sales
-
Receivables -3.6% ($565.5M to $544.9M) vs revenue +2.1% ($3.4B to $3.4B), -5.7 pts apart
9 more checks with nothing to note
-
Cash from operations $134.1M vs net income −$8.6M (FY ending Dec 31, 2025)
-
Inventory +2.5% ($1.1B to $1.1B) vs revenue +2.1% ($3.4B to $3.4B), +0.4 pts apart
-
Same auditor in both 10-Ks: PricewaterhouseCoopers LLP
-
No statement of substantial doubt about going concern
-
No 8-K item 4.02 in the last 2 years
-
No NT 10-K or NT 10-Q in the last 2 years
-
No sentence in the 10-K concludes that controls were not effective because of a material weakness
-
No 8-K item 2.06 in the last 2 years
-
No 8-K item 1.03 in the last 2 years
In their words
23 paragraphs in Risk Factors that were not in the 10-K filed Mar 3, 2025. Quoted as filed.
-
Item 1A · new paragraph · not in the 10-K filed Mar 3, 2025 10-K, ITEM 1A
New U.S. and reciprocal tariffs that have been imposed, and remain subject to potential change and other uncertainties, have had a material adverse effect on our business, results of operations and financial condition, and may continue to do so in the foreseeable future. Recently, the U.S. government has indicated its intent to modify…
-
Item 1A · new paragraph · not in the 10-K filed Mar 3, 2025 10-K, ITEM 1A
Delays in the release of Chinese government stimulus spending have had a material adverse effect on our business, results of operations and financial condition, and may continue to do so for the foreseeable future. A significant portion of our revenue is derived from sales into China, some of which are directly funded through Chinese…
-
Item 1A · new paragraph · not in the 10-K filed Mar 3, 2025 10-K, ITEM 1A
In addition to the foreign currency exposure associated with differences between where our products are manufactured and sold by us and our competitors, our exposure to currency exchange rate fluctuations results from the currency translation exposure
-
Item 1A · new paragraph · not in the 10-K filed Mar 3, 2025 10-K, ITEM 1A
As of December 31, 2025, we had an outstanding aggregate principal amount of debt totaling approximately $1.9 billion and had $900.0 million available for borrowing under the 2024 Revolving Credit Agreement, subject to compliance with financial covenant ratios.
New risk paragraphs, against peers
Latest 10-K of each, Technology companies closest in revenue
Paragraphs in Risk Factors with nothing like them in the company's 10-K the year before. A count of text, not of risk.
Financial performance
Last 4 fiscal years · 10-K XBRL
| Metric | FY2022 | FY2023 | FY2024 | FY2025 |
|---|---|---|---|---|
| Revenue | $2.5B | $3.0B | $3.4B | $3.4B |
| Net income | $296.6M | $427.2M | $113.1M | −$8.6M |
| Operating cash flow | $274.4M | $350.1M | $251.3M | $134.1M |
| Free cash flow | $145.2M | $243.2M | $136.0M | $43.3M |
Revenue, FY2016 to FY2025
Ten fiscal years, each from its own 10-K · XBRL · USD
$3.4B ▲ 2.1% in FY2025−$8.6M in FY2025$43.3M ▼ 68.2% in FY2025
Recent filings
4 filings in the last 30 days · SEC EDGAR
-
8-KNov 5, 2026Other events 8-K item 8.01
-
10-QNov 5, 2026Quarterly report (10-Q) period ended Sep 30, 2026
-
8-KNov 4, 2026Quarterly results 8-K item 2.02
-
8-KOct 29, 2026Other events 8-K item 8.01
About the company
Bruker Corp, Billerica, MA · from the 10-K filed Feb 27, 2026
We are a developer, manufacturer, and distributor of high-performance scientific instruments and analytical and diagnostic solutions that enable our customers to explore life and materials at microscopic, molecular and cellular levels. Many of our products are used to detect, measure and visualize structural characteristics of chemical, biological and industrial material samples. Our products and solutions address the rapidly evolving needs of a diverse array of customers in life and materials science research, biopharmaceuticals, applied markets, microbiology, in-vitro diagnostics, and nanotechnology.
- Headquarters
- Billerica, MA
- Country
- United States
- Reports in
- USD
- Listed on
- Nasdaq
- Fiscal year ends
- December 31
- Last results
- Nov 4, 2026
- Incorporated in
- DE
Employees, at the top of the page: "As of December 31, 2025, Bruker had approximately 11,085 employees worldwide" (10-K). Address and exchange: SEC's company file.
Email alerts
Sources
The 10-K filed Feb 27, 2026 (open at SEC), compared with the 10-K filed Mar 3, 2025. Numbers from the XBRL of the 10-Ks; filings from SEC EDGAR.
Work with it: Excel workbook · CSV. Google Sheet that stays up to date: paste =IMPORTDATA("https://tickdelta.com/company/BRKR/export.csv") into a cell.