TTM Technologies Inc TTMI
We are a leading global manufacturer of technology products, including mission systems, RF components, RF microwave/microelectronic assemblies, and technologically advanced interconnect products, including PCBs and substrates. 10-K, Item 1
- Employees
- 18,200
- Headquarters
- Santa Ana, CA
- CEO
- Edwin Roks
- Next results
- around Feb 3, 2027
Where each dollar of revenue went, FY2025
Revenue of $2.9B through the costs to a net profit of $177.4M · income statement of the 10-K
TTMI among Technology peers
Six ratios from the latest 10-K. Each corner is the share of 230 peers the company is above, not a score.
What changed
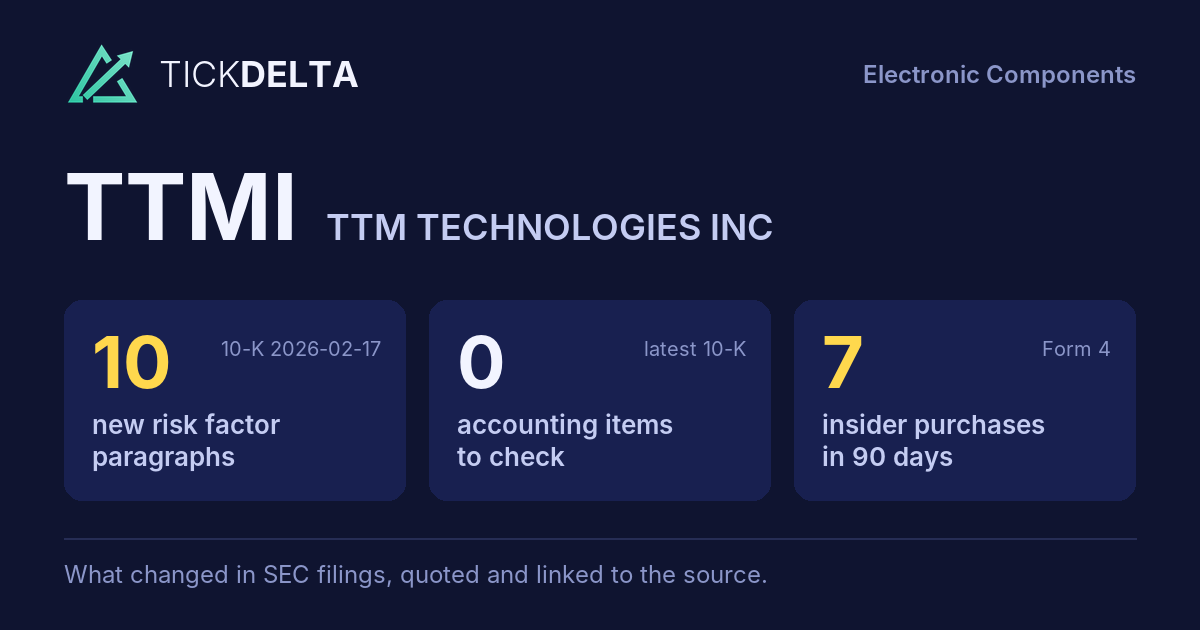
10 new risk paragraphs. 10-K filed Feb 17, 2026 against Feb 21, 2025.
Each row opens the detail with the quote and the filing. A row is a change worth reading, not a verdict.
Accounting checks
11 checks on the latest 10-K. Checks, not verdicts.
0facts worth reading about all 11 checks found nothing to note
-
Receivables +25.7% ($448.6M to $563.7M) vs revenue +19.0% ($2.4B to $2.9B), +6.7 pts apart
-
Cash from operations $291.9M vs net income $177.4M (FY ending Dec 29, 2025)
-
Inventory +11.1% ($225.0M to $250.1M) vs revenue +19.0% ($2.4B to $2.9B), -7.8 pts apart
8 more checks with nothing to note
-
Same auditor in both 10-Ks: KPMG LLP
-
No statement of substantial doubt about going concern
-
No 8-K item 4.02 in the last 2 years
-
No NT 10-K or NT 10-Q in the last 2 years
-
The same matters as last year: Evaluation of the sufficiency of audit evidence over net sales
-
No sentence in the 10-K concludes that controls were not effective because of a material weakness
-
No 8-K item 2.06 in the last 2 years
-
No 8-K item 1.03 in the last 2 years
In their words
10 paragraphs in Risk Factors that were not in the 10-K filed Feb 21, 2025. Quoted as filed.
-
Item 1A · new paragraph · not in the 10-K filed Feb 21, 2025 10-K, ITEM 1A
Changes in future business conditions could cause goodwill, intangible assets, and other long-lived assets to become impaired, which would result in significant losses and write-downs that would reduce our operating income.
-
Item 1A · new paragraph · not in the 10-K filed Feb 21, 2025 10-K, ITEM 1A
Our results of operations fluctuate for a variety of reasons, including, but not limited to, timing of orders from and shipments to major customers, manufacturing capacity utilization levels, price competition, and changes in our mix of revenues generated from quick-turn versus standard delivery time services.
-
Item 1A · new paragraph · not in the 10-K filed Feb 21, 2025 10-K, ITEM 1A
The PCB industry is intensely competitive, highly fragmented, and rapidly changing. The worldwide electronics industry is characterized by relatively short product life cycles and significant fluctuations in product demand, and is subject to economic cycles
-
Item 1A · new paragraph · not in the 10-K filed Feb 21, 2025 10-K, ITEM 1A
Some of our competitors and potential competitors have advantages over us, including: greater financial and manufacturing resources that can be devoted to the development, production, and sale of their products; more established and broader sales and marketing channels; preferred vendor status with existing and potential customers; more…
New risk paragraphs, against peers
Latest 10-K of each, Technology companies closest in revenue
Paragraphs in Risk Factors with nothing like them in the company's 10-K the year before. A count of text, not of risk.
Financial performance
Last 4 fiscal years · 10-K XBRL
| Metric | FY2022 | FY2023 | FY2024 | FY2025 |
|---|---|---|---|---|
| Revenue | $2.5B | $2.2B | $2.4B | $2.9B |
| Net income | $94.6M | −$18.7M | $56.3M | $177.4M |
| Operating cash flow | $272.9M | $187.3M | $236.9M | $291.9M |
| Free cash flow | $170.0M | $27.0M | $51.2M | −$683K |
Revenue, FY2016 to FY2025
Ten fiscal years, each from its own 10-K · XBRL · USD
$2.9B ▲ 19.0% in FY2025$177.4M ▲ 215.2% in FY2025−$683K in FY2025
Recent filings
20 filings in the last 30 days · SEC EDGAR
-
BuyNov 9, 2026FRANKLIN PHILIP G (Director) bought $310K open-market purchase on Nov 5, 2026
-
Cluster buyNov 9, 2026Cluster buy: 3 insiders bought $2.3M Oct 28, 2026 to Nov 5, 2026: Ali Wajid, Roks Edwin, FRANKLIN PHILIP G
-
BuyNov 5, 2026Ali Wajid (Director) bought $632K open-market purchase on Nov 5, 2026
-
BuyOct 28, 2026Ali Wajid (Director) bought $902K open-market purchase on Oct 28, 2026
-
BuyOct 28, 2026Roks Edwin (President and CEO) bought $440K open-market purchase on Oct 28, 2026
About the company
TTM Technologies Inc, Santa Ana, CA · from the 10-K filed Feb 17, 2026
We are a leading global manufacturer of technology products, including mission systems, RF components, RF microwave/microelectronic assemblies, and technologically advanced interconnect products, including PCBs and substrates. In 2025, we generated approximately $2.9 billion in net sales and ended the year with approximately 18,200 employees worldwide. We currently operate a total of 24 specialized facilities in North America and Asia. We focus on providing time-to-market and volume production of advanced technology products and offer a one-stop design, engineering, and manufacturing solution to our customers.
- Headquarters
- Santa Ana, CA
- Country
- United States
- Reports in
- USD
- Listed on
- Nasdaq
- Fiscal year ends
- December 28
- Last results
- Oct 22, 2026
- Incorporated in
- DE
Employees, at the top of the page: "As of December 29, 2025, we had approximately 18,200 employees" (10-K). Address and exchange: SEC's company file.
Email alerts
Sources
The 10-K filed Feb 17, 2026 (open at SEC), compared with the 10-K filed Feb 21, 2025. Numbers from the XBRL of the 10-Ks; filings from SEC EDGAR.
Work with it: Excel workbook · CSV. Google Sheet that stays up to date: paste =IMPORTDATA("https://tickdelta.com/company/TTMI/export.csv") into a cell.