Ormat Technologies, Inc. ORA
We are a leading vertically integrated company primarily engaged in the geothermal power business. 10-K, Item 1
- Headquarters
- Reno, NV
- CEO
- Mr. Doron Blachar
- Next results
- around Feb 25, 2027
Where each dollar of revenue went, FY2025
Revenue of $989.5M through the costs to a net profit of $123.9M · income statement of the 10-K
ORA among Utilities peers
Six ratios from the latest 10-K. Each corner is the share of 58 peers the company is above, not a score.
What changed
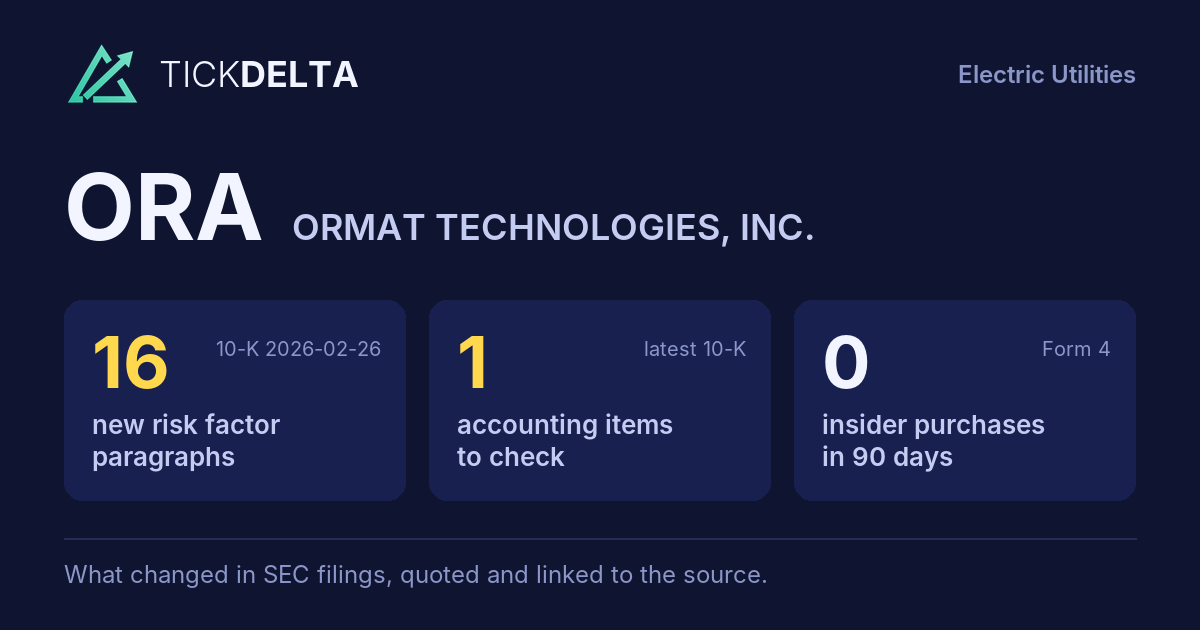
16 new risk paragraphs and 1 accounting fact worth reading about. 10-K filed Feb 26, 2026 against Feb 27, 2025.
Each row opens the detail with the quote and the filing. A row is a change worth reading, not a verdict.
Accounting checks
11 checks on the latest 10-K. Checks, not verdicts.
1fact worth reading about the other 10 checks found nothing to note
-
Critical audit matters changedNew this year: Tel-Aviv, Israel Kesselman & Kesselman; February 26, 2026 Certified Public Accountants (Isr.); A member firm of PricewaterhouseCoopers International Limited. No longer listed: Tel-Aviv, Israel. Same as last year: Estimates of Future Costs in Product Revenue Recognition
-
Receivables +0.4% ($164.1M to $164.8M) vs revenue +12.5% ($879.7M to $989.5M), -12.1 pts apart
9 more checks with nothing to note
-
Cash from operations $335.1M vs net income $123.9M (FY ending Dec 31, 2025)
-
Inventory +18.8% ($38.1M to $45.3M) vs revenue +12.5% ($879.7M to $989.5M), +6.3 pts apart
-
Same auditor in both 10-Ks: Kesselman & Kesselman C.P.A.s
-
No statement of substantial doubt about going concern
-
No 8-K item 4.02 in the last 2 years
-
No NT 10-K or NT 10-Q in the last 2 years
-
No sentence in the 10-K concludes that controls were not effective because of a material weakness
-
No 8-K item 2.06 in the last 2 years
-
No 8-K item 1.03 in the last 2 years
In their words
16 paragraphs in Risk Factors that were not in the 10-K filed Feb 27, 2025. Quoted as filed.
-
Item 1A · new paragraph · not in the 10-K filed Feb 27, 2025 10-K, ITEM 1A
The energy storage market is impacted by battery prices that are linked to lithium prices and tariffs affecting China. 2025 was a volatile year for BESS pricing as tariffs were enacted and changed as well as the increase in demand due to the enactment of the OBBBA. These tariffs, the adoption and expansion of trade restrictions, the…
-
Item 1A · new paragraph · not in the 10-K filed Feb 27, 2025 10-K, ITEM 1A
Our investments in next-generation geothermal technologies including in EGS involve significant risks and may not achieve anticipated returns. We have made, and may continue to make, investments in EGS, which is an emerging geothermal technology that differs materially from conventional geothermal development. EGS projects seek to…
-
Item 1A · new paragraph · not in the 10-K filed Feb 27, 2025 10-K, ITEM 1A
Existing congestion of transmission capacity, as well as expansion of transmission systems and competition from other developers seeking access to expanded systems, could also affect our performance.
-
Item 1A · new paragraph · not in the 10-K filed Feb 27, 2025 10-K, ITEM 1A
The absence of new or renewed BLM permits for solar PV projects on U.S. federal lands could impair our development activities, project pipeline and growth prospects. The BLM has not issued new permits or renewed certain permits for standalone solar facilities, solar projects paired with energy storage, or solar installations intended to…
New risk paragraphs, against peers
Latest 10-K of each, Utilities companies closest in revenue
Paragraphs in Risk Factors with nothing like them in the company's 10-K the year before. A count of text, not of risk.
Financial performance
Last 4 fiscal years · 10-K XBRL
| Metric | FY2022 | FY2023 | FY2024 | FY2025 |
|---|---|---|---|---|
| Revenue | $734.2M | $829.4M | $879.7M | $989.5M |
| Net income | $65.8M | $124.4M | $123.7M | $123.9M |
| Operating cash flow | $281.0M | $309.4M | $410.9M | $335.1M |
| Free cash flow | −$282.5M | −$309.0M | −$76.8M | −$284.7M |
Revenue, FY2016 to FY2025
Ten fiscal years, each from its own 10-K · XBRL · USD
$989.5M ▲ 12.5% in FY2025$123.9M ▲ 0.1% in FY2025−$284.7M in FY2025
Recent filings
2 filings in the last 30 days · SEC EDGAR
-
10-QNov 5, 2026Quarterly report (10-Q) period ended Sep 30, 2026
-
8-KNov 4, 2026Quarterly results 8-K item 2.02
About the company
Ormat Technologies, Inc., Reno, NV · from the 10-K filed Feb 26, 2026
We are a leading vertically integrated company primarily engaged in the geothermal power business. We leverage our core capabilities, proprietary technologies, and global presence to expand our activities in conventional geothermal development, recovered energy generation and emerging geothermal technologies, including piloting of new EGS technologies. In addition, we are expanding into different complementary energy solutions, including stand alone utility scale energy storage services and solar PV generation (including hybrid geothermal and solar PV as well as solar plus energy storage).
- Headquarters
- Reno, NV
- Country
- United States
- Reports in
- USD
- Listed on
- NYSE
- Fiscal year ends
- December 31
- Last results
- Nov 4, 2026
- Incorporated in
- DE
Email alerts
Sources
The 10-K filed Feb 26, 2026 (open at SEC), compared with the 10-K filed Feb 27, 2025. Numbers from the XBRL of the 10-Ks; filings from SEC EDGAR.
Work with it: Excel workbook · CSV. Google Sheet that stays up to date: paste =IMPORTDATA("https://tickdelta.com/company/ORA/export.csv") into a cell.