Q2 Holdings, Inc. QTWO
Q2 is a leading provider of digital solutions to financial institutions, financial technology companies, or FinTechs, and alternative finance companies, or Alt-FIs, seeking to incorporate banking into their customer engagement and servicing strategies. 10-K, Item 1
- Employees
- 2,549
- Headquarters
- Austin, TX
- CEO
- Matthew P. Flake
- Next results
- around Feb 10, 2027
Where each dollar of revenue went, FY2025
Revenue of $794.8M through the costs to a net profit of $52.0M · income statement of the 10-K
QTWO among Technology peers
Six ratios from the latest 10-K. Each corner is the share of 230 peers the company is above, not a score.
What changed
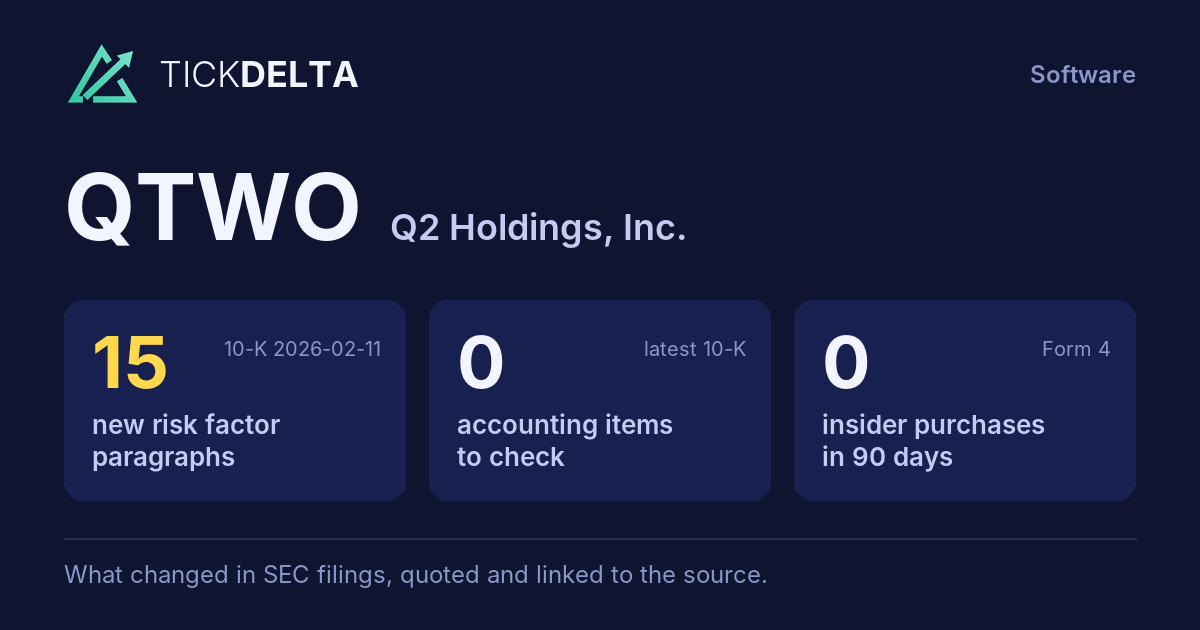
15 new risk paragraphs. 10-K filed Feb 11, 2026 against Feb 12, 2025.
Each row opens the detail with the quote and the filing. A row is a change worth reading, not a verdict.
Accounting checks
10 checks on the latest 10-K. Checks, not verdicts.
0facts worth reading about all 10 checks found nothing to note
-
Receivables +22.9% ($42.1M to $51.7M) vs revenue +14.1% ($696.5M to $794.8M), +8.8 pts apart
-
Cash from operations $201.5M vs net income $52.0M (FY ending Dec 31, 2025)
-
Same auditor in both 10-Ks: Ernst & Young LLP
7 more checks with nothing to note
-
No statement of substantial doubt about going concern
-
No 8-K item 4.02 in the last 2 years
-
No NT 10-K or NT 10-Q in the last 2 years
-
The same matters as last year: Accounting for Revenue Recognition
-
No sentence in the 10-K concludes that controls were not effective because of a material weakness
-
No 8-K item 2.06 in the last 2 years
-
No 8-K item 1.03 in the last 2 years
In their words
15 paragraphs in Risk Factors that were not in the 10-K filed Feb 12, 2025. Quoted as filed.
-
Item 1A · new paragraph · not in the 10-K filed Feb 12, 2025 10-K, ITEM 1A
In addition, the imposition by the U.S. of additional tariffs on a broad range of imports from multiple countries, and the potential for further expansion of such tariffs, including retaliatory tariffs being imposed by foreign countries, has introduced uncertainty into the global trade environment. Although our operations do not involve…
-
Item 1A · new paragraph · not in the 10-K filed Feb 12, 2025 10-K, ITEM 1A
Our ability to operate effectively depends, in part, on the availability, security, and resilience of these third-party platforms and the providers' continued compliance with applicable contractual, legal, and regulatory requirements. Disruptions, outages, cyber incidents, data loss, or other security events affecting our third-party…
-
Item 1A · new paragraph · not in the 10-K filed Feb 12, 2025 10-K, ITEM 1A
A disruption at a key vendor, such as a third-party public cloud service provider, third-party Internet service provider, software update distributor or cybersecurity firm, could impair our systems or our clients' ability to access our platforms. Because certain cloud and hosting services are provided by a limited number of large…
-
Item 1A · new paragraph · not in the 10-K filed Feb 12, 2025 10-K, ITEM 1A
Additionally, AI model health presents a growing risk to our business and operations. As we develop, test, deploy and operate AI models that are integrated with or support our products and services, these models must remain compliant with evolving regulatory and model risk management requirements and fit for purpose over time. Gaps in…
New risk paragraphs, against peers
Latest 10-K of each, Technology companies closest in revenue
Paragraphs in Risk Factors with nothing like them in the company's 10-K the year before. A count of text, not of risk.
Financial performance
Last 4 fiscal years · 10-K XBRL
| Metric | FY2022 | FY2023 | FY2024 | FY2025 |
|---|---|---|---|---|
| Revenue | $565.7M | $624.6M | $696.5M | $794.8M |
| Net income | −$109.0M | −$65.4M | −$38.5M | $52.0M |
| Operating cash flow | $36.6M | $70.3M | $135.8M | $201.5M |
| Free cash flow | $25.4M | $64.6M | $129.1M | $194.7M |
Revenue, FY2016 to FY2025
Ten fiscal years, each from its own 10-K · XBRL · USD
$794.8M ▲ 14.1% in FY2025$52.0M in FY2025$194.7M ▲ 50.8% in FY2025
Recent filings
5 filings in the last 30 days · SEC EDGAR
-
Planned saleNov 12, 2026MICHAEL SCOTT KERR (Officer) gave notice of a planned sale of 2,655 shares worth about $200K Form 144, approximate sale date Nov 11, 2026, under a 10b5-1 plan adopted Aug 12, 2026
-
Planned saleOct 28, 2026Scott Kerr (Senior Vice President) adopted a 10b5-1 trading plan reported in the 10-Q, up to 32,853 shares, runs to Dec 31, 2027
-
8-KOct 28, 2026Quarterly results 8-K item 2.02
-
8-KOct 28, 2026Director or officer change, Regulation FD disclosure 8-K items 5.02, 7.01
-
10-QOct 28, 2026Quarterly report (10-Q) period ended Sep 30, 2026
About the company
Q2 Holdings, Inc., Austin, TX · from the 10-K filed Feb 11, 2026
Q2 is a leading provider of digital solutions to financial institutions, financial technology companies, or FinTechs, and alternative finance companies, or Alt-FIs, seeking to incorporate banking into their customer engagement and servicing strategies. Our solutions transform the ways in which financial institutions and other financial services providers engage with account holders and retail and commercial End Users.
- Headquarters
- Austin, TX
- Country
- United States
- Reports in
- USD
- Listed on
- NYSE
- Fiscal year ends
- December 31
- Last results
- Oct 28, 2026
Employees, at the top of the page: "As of December 31, 2025, we had 2,549 employees, of which 2,548 were full time employees, 1,664 of which were employed in the United States, and 884 were employed outside of the United States" (10-K). Address and exchange: SEC's company file.
Email alerts
Sources
The 10-K filed Feb 11, 2026 (open at SEC), compared with the 10-K filed Feb 12, 2025. Numbers from the XBRL of the 10-Ks; filings from SEC EDGAR.
Work with it: Excel workbook · CSV. Google Sheet that stays up to date: paste =IMPORTDATA("https://tickdelta.com/company/QTWO/export.csv") into a cell.